This thread will look at debt at football clubs, focusing on the Premier League Big Six. The fundamental question is whether this debt is too high, but the answer is complicated by the numerous definitions of debt, all of which can be valid #AFC #CFC #LFC #MCFC #MUFC #THFC
At the narrowest extreme, we have just bank debt, but the broadest extreme covers total liabilities, which includes all financial obligations, including transfer debt, tax liabilities, trade creditors, provisions for future losses, accrued expenses and even deferred income.
The net debt reported in an English club’s financial statement is in line with IFRS (International Financial Reporting Standards) and essentially covers purely financial obligations, such as overdrafts, bank loans, bonds, shareholder loans and finance leases less cash.
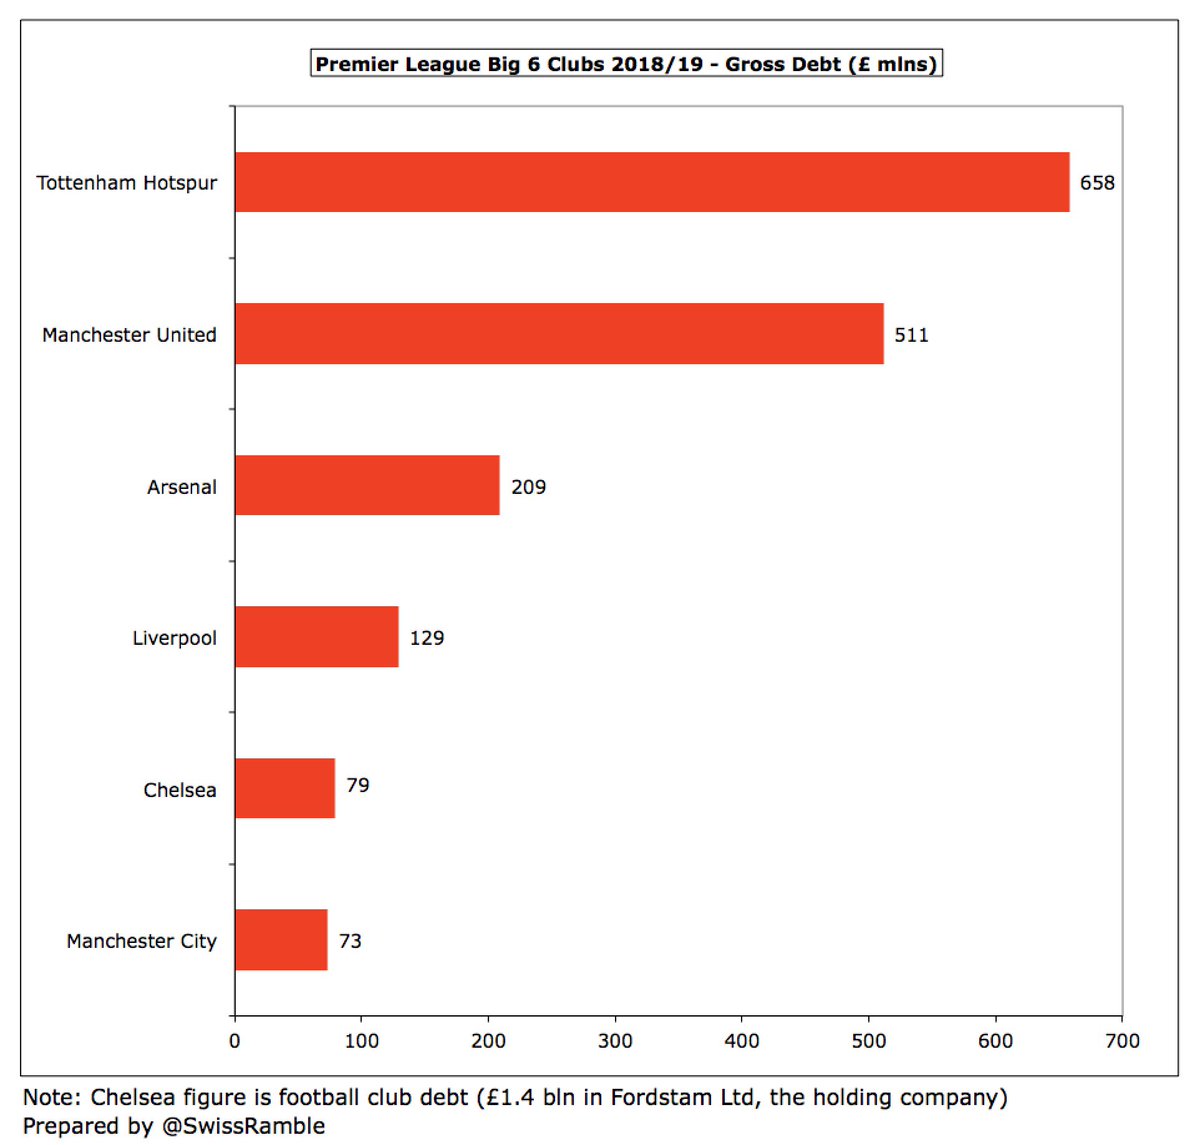
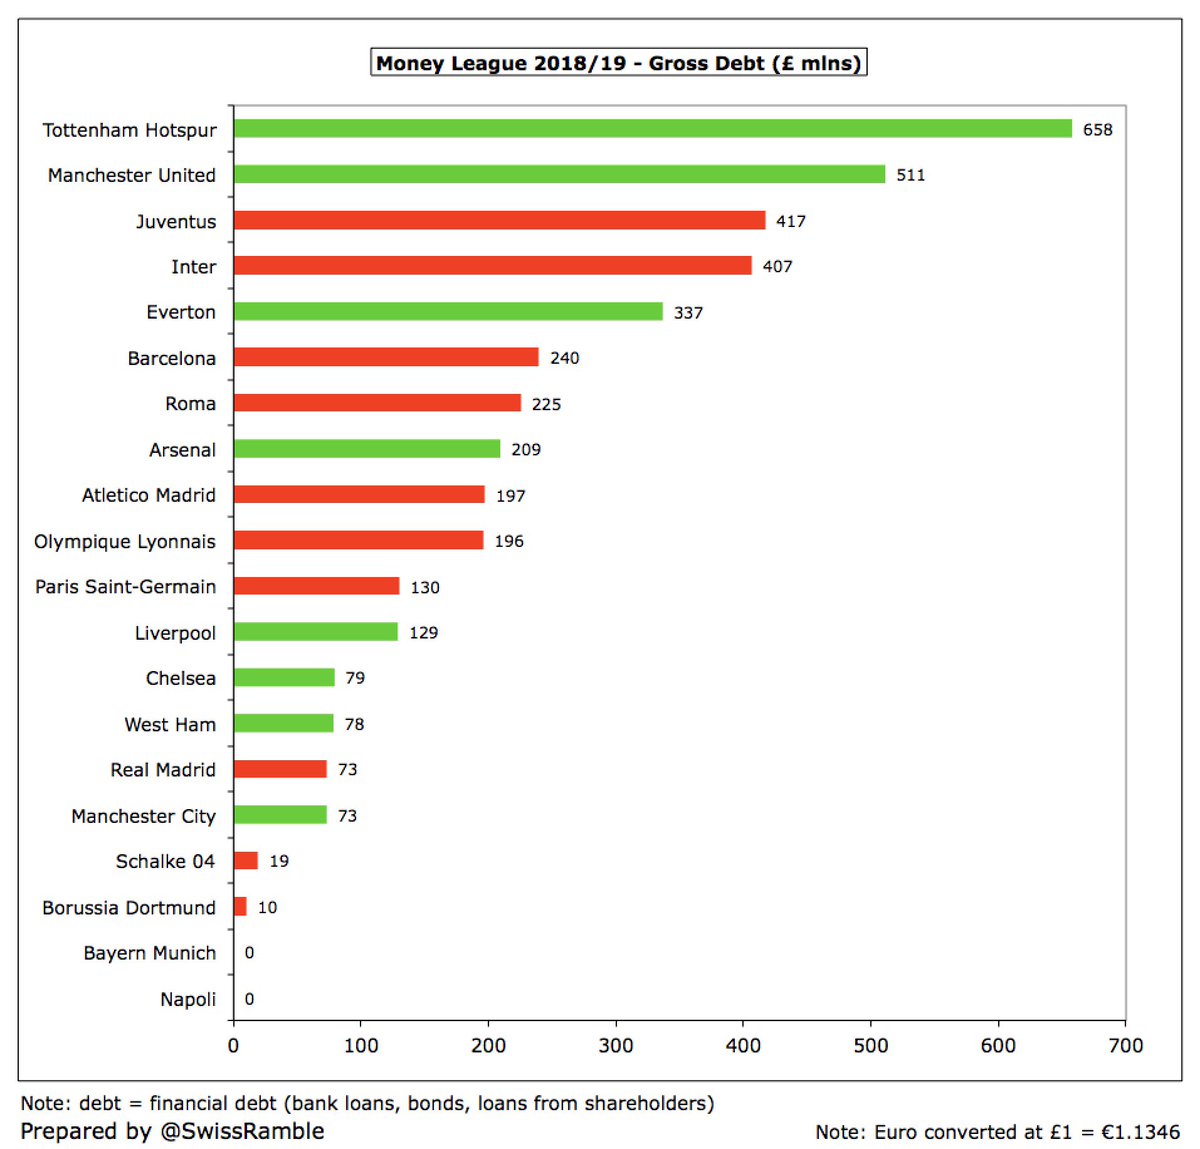
On that basis, #THFC had the highest gross debt in England as at end of 2018/19 season with £658m (to fund the new stadium), followed by #MUFC £511m (Glazers’ leveraged buy-out), #AFC £211m (remaining Emirates stadium mortgage) and #LFC £129m (Anfield main stand expansion). 
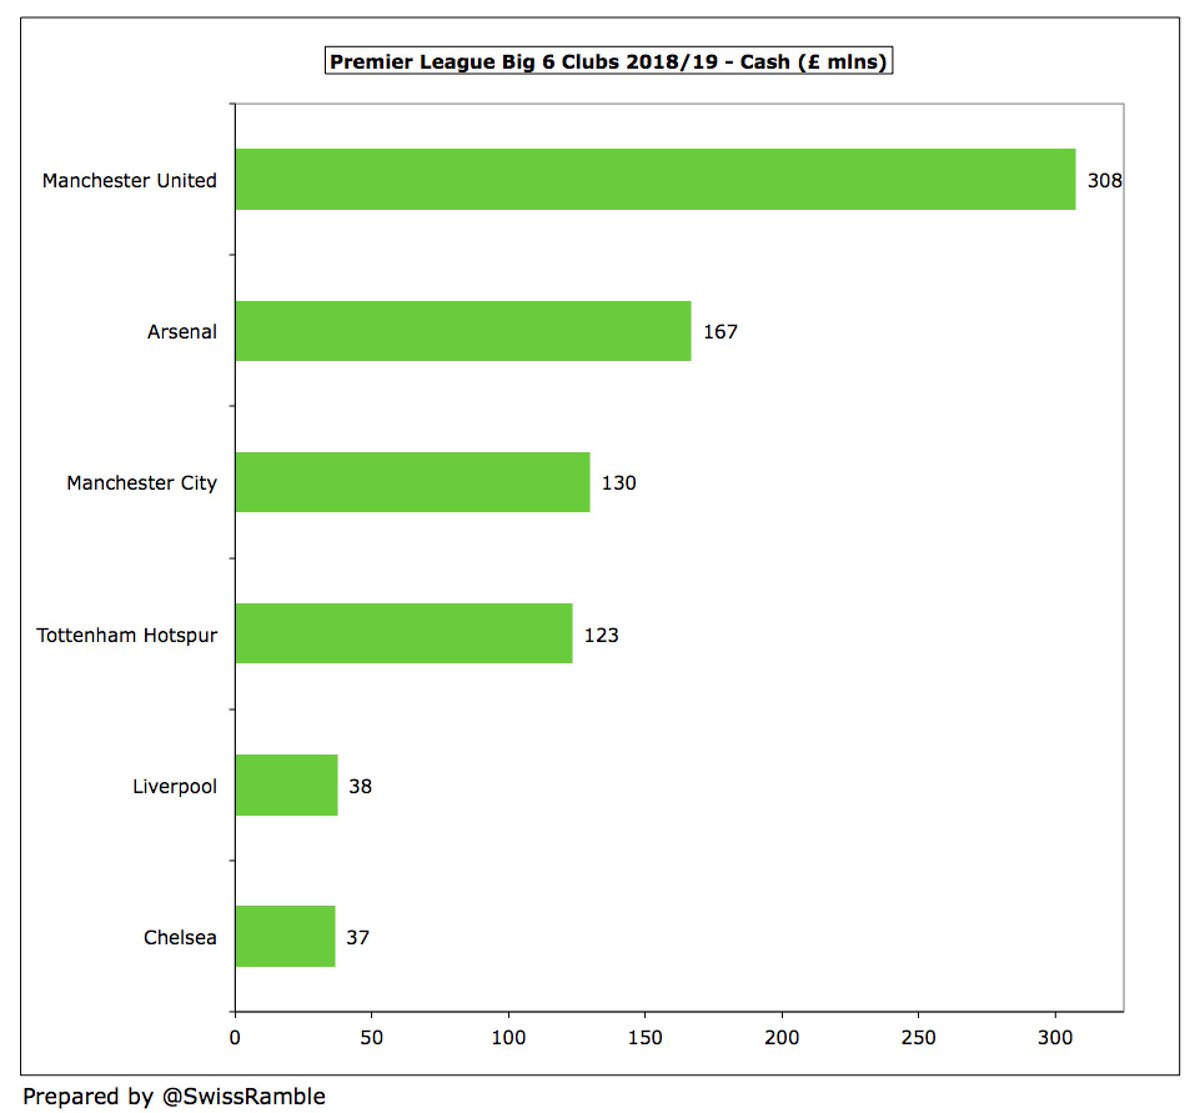
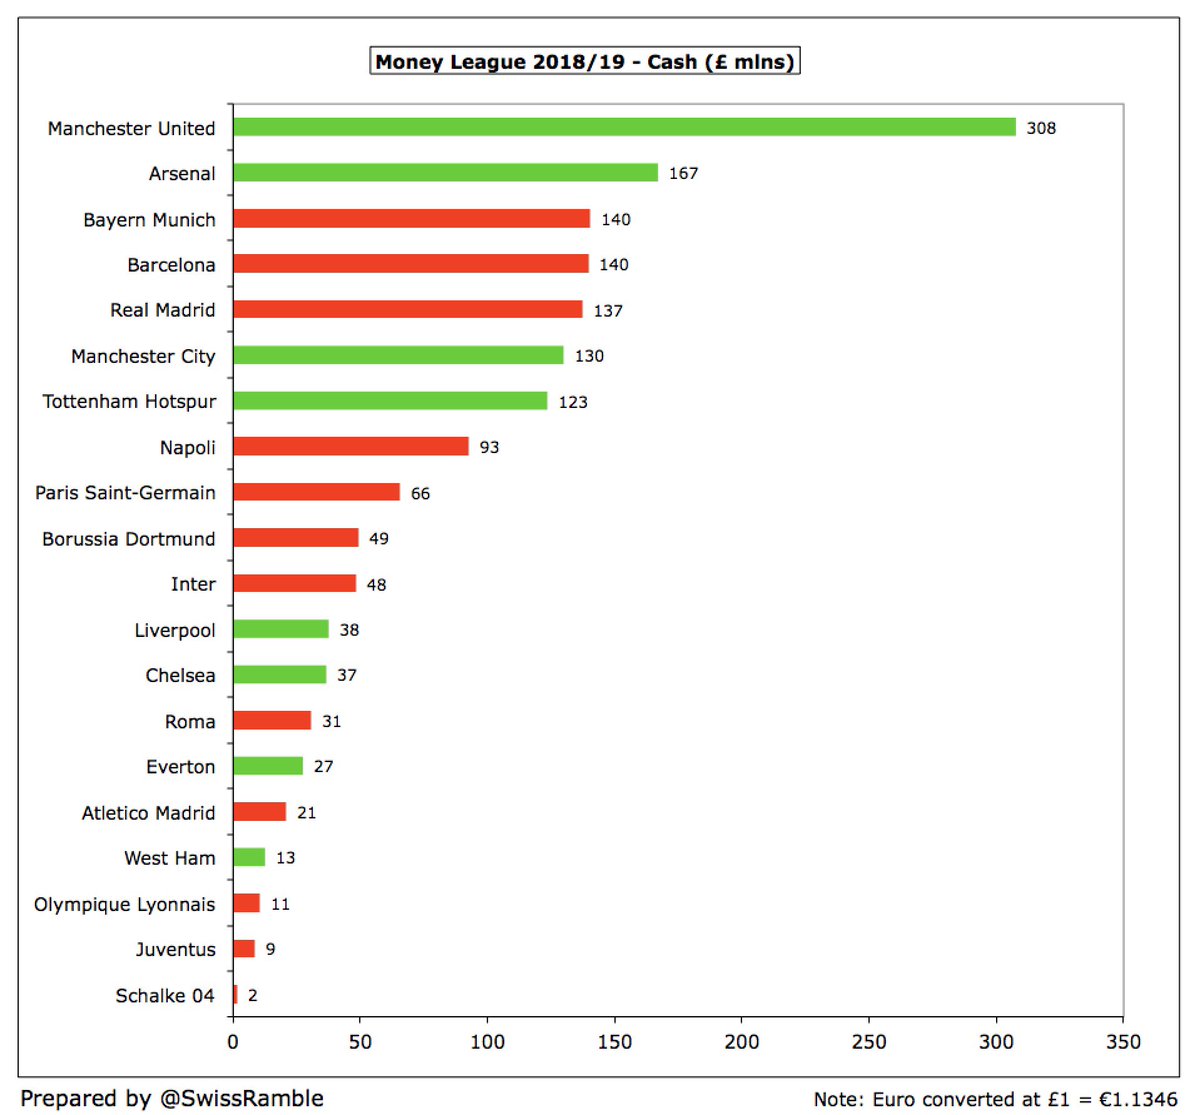
However, this was offset by large cash balances in some cases: #MUFC £308m, #AFC £167m, #MCFC £130m and #THFC £123m. At the other end of the spectrum, #LFC and #CFC only had £38m and £37m respectively. These balances are likely to be much lower now due to COVID impact on revenue. 
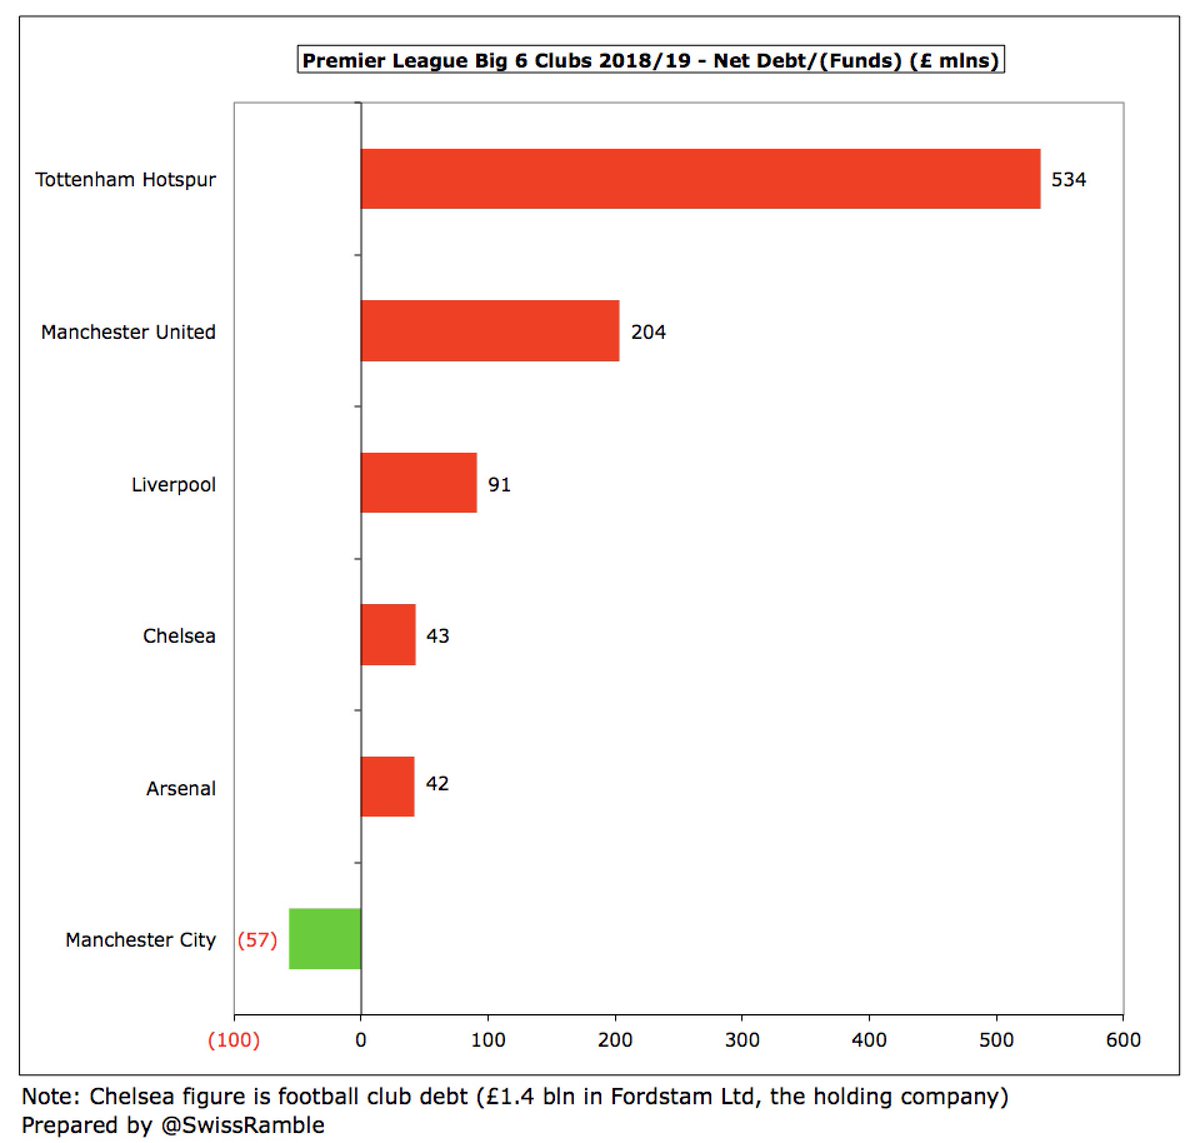
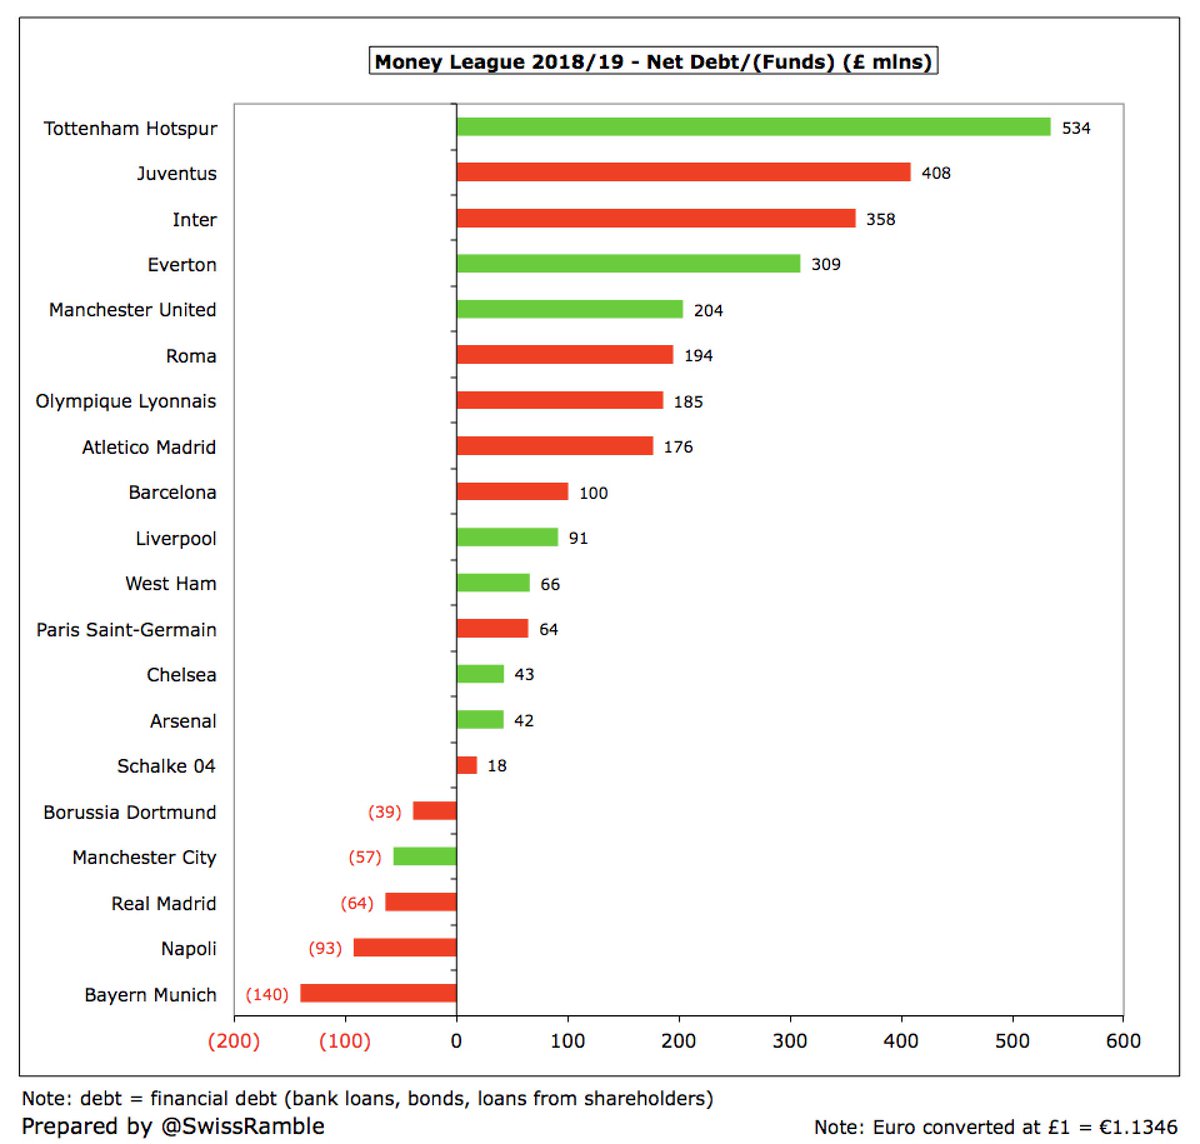
As a consequence, four of the Big Six had net debt below £100m: #LFC £91m, #CFC £43m and #AFC £42m, while #MCFC even had net funds of £57m. That left two clubs with hefty net debt: #THFC £534m and #MUFC £204m. 
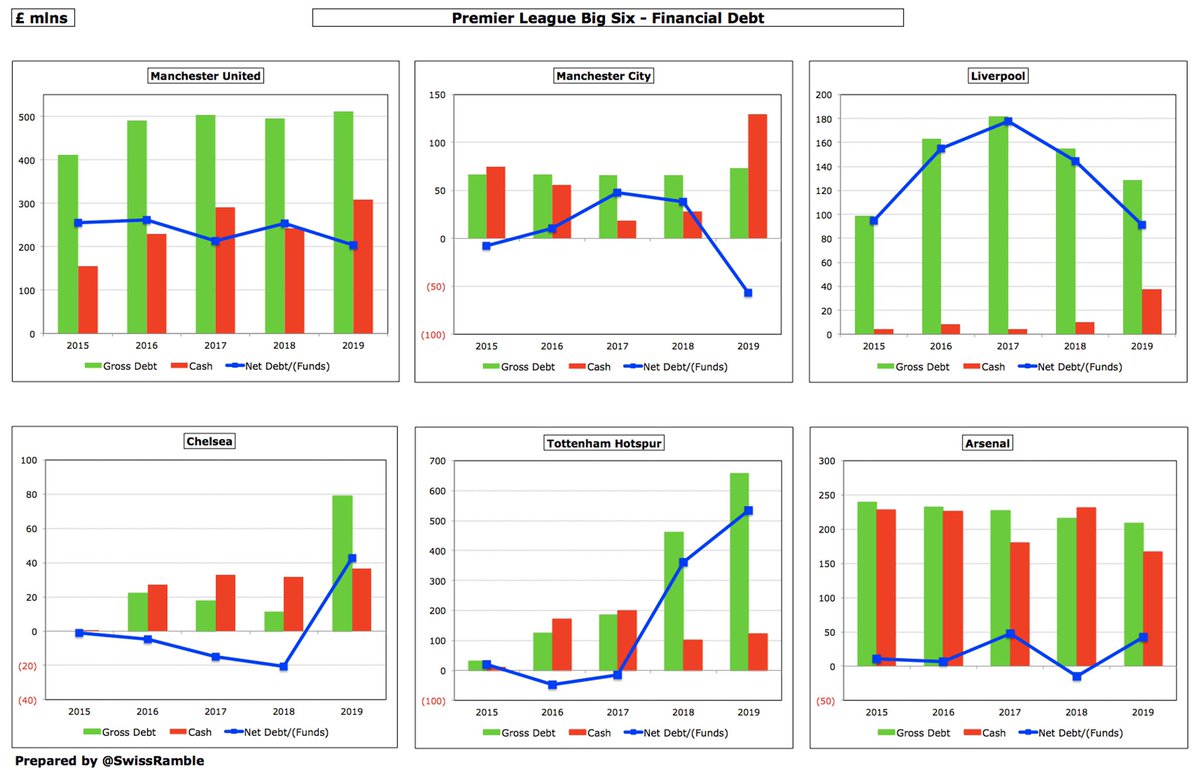
Over the last few years, debt has significantly grown at #THFC (new stadium), while there have been steady reductions at #AFC (down from £240m in 2015 to £209m) and #LFC (down from £182m in 2017 to £129m). Despite all their refinancings, #MUFC has remained around £500m level. 
In fact, #THFC £658m and #MUFC £511m have the highest financial debt in Europe, followed by two Italian clubs, #Juventus £417m and #Inter £407m, then #EFC £337m. It is striking how low debt is at German clubs: #S04 £19m, #BVB £10m and #FCBayern zero. 
However, English clubs also tend to hold more cash, e.g. four of the seven highest balances, led by #MUFC £308m and #AFC £167m. That said, the elite European clubs also had fairly high cash: #FCBayern £140m, #FCBarcelona £140m and #RealMadrid £137m. 
In terms of net debt, England has 3 of the top 5 clubs in the Money League. #THFC “lead the way” with £534m, followed by #Juventus £408m, #Inter £358m, #EFC £309m and #MUFC £204m. Five clubs had net funds (cash higher than debt): #BVB, #MCFC, #RealMadrid, #SSCNapoli & #FCBayern. 
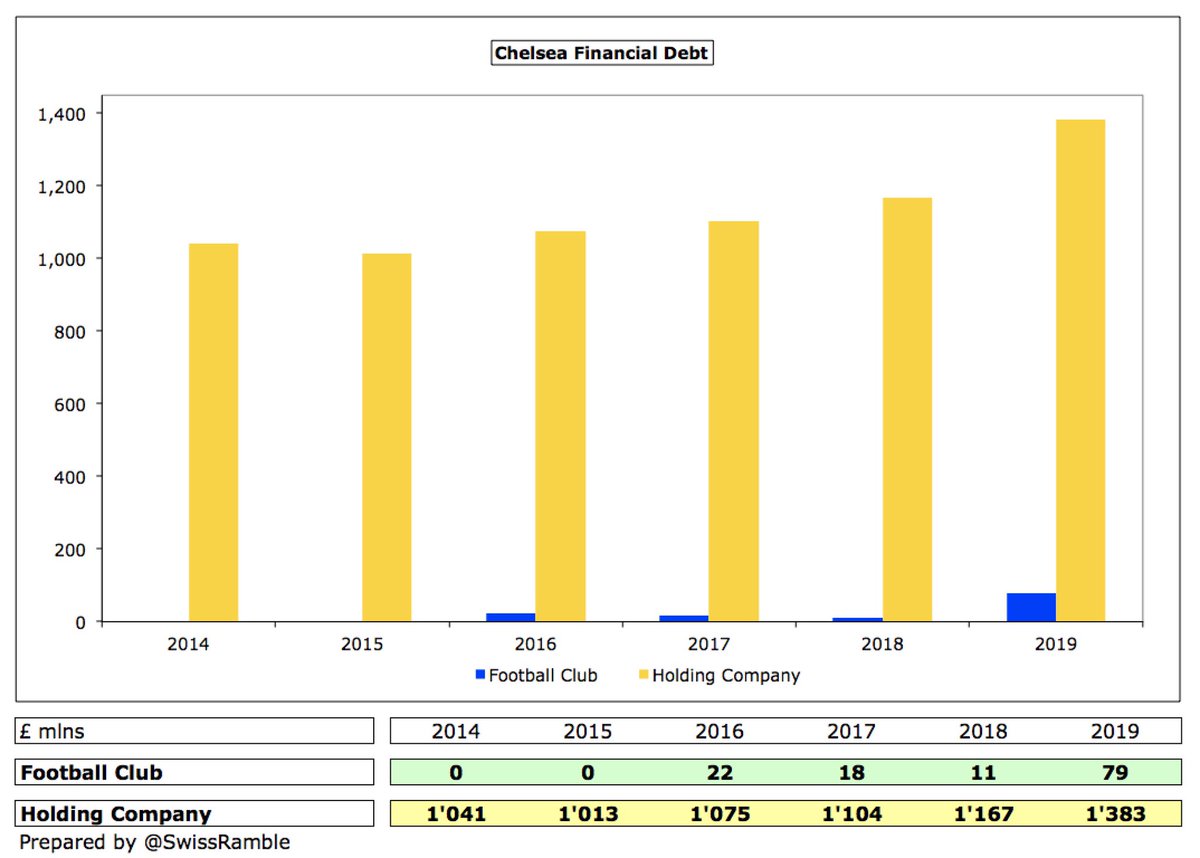
As a technical aside, I have taken all the #CFC figures from the football club accounts, where their debt is negligible, but it should be noted that they have £1.4 bln debt in their holding company (Fordstam Limited), almost entirely owed to their owner, Roman Abramovich. 
An important element in a football club’s business model is transfer debt. In most cases, these payables are not overdue, but in line with the payment schedule agreed between the respective clubs for transfer fees. So clubs have payables, receivables and net transfer debt.
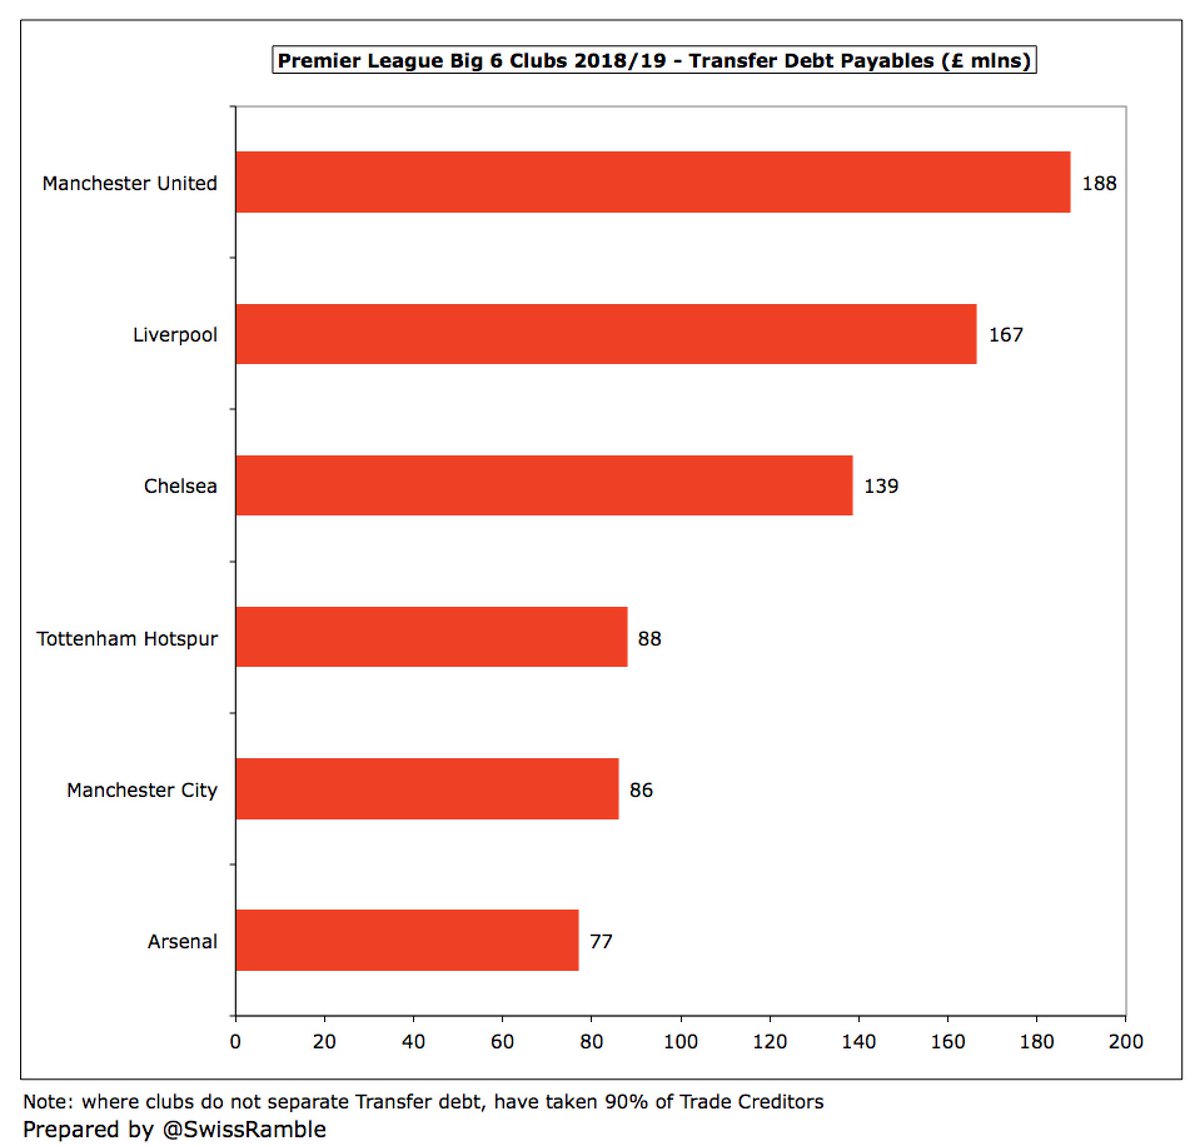
#MUFC had the highest transfer debt as at June 2019 with £188m, followed by #LFC £167m and #CFC £139m (though the latter two do not separate this figure in their accounts, so I have estimated 90% of Trade Creditors). Others are below £100m: #THFC £88m, #MCFC £86m and #AFC £77m. 
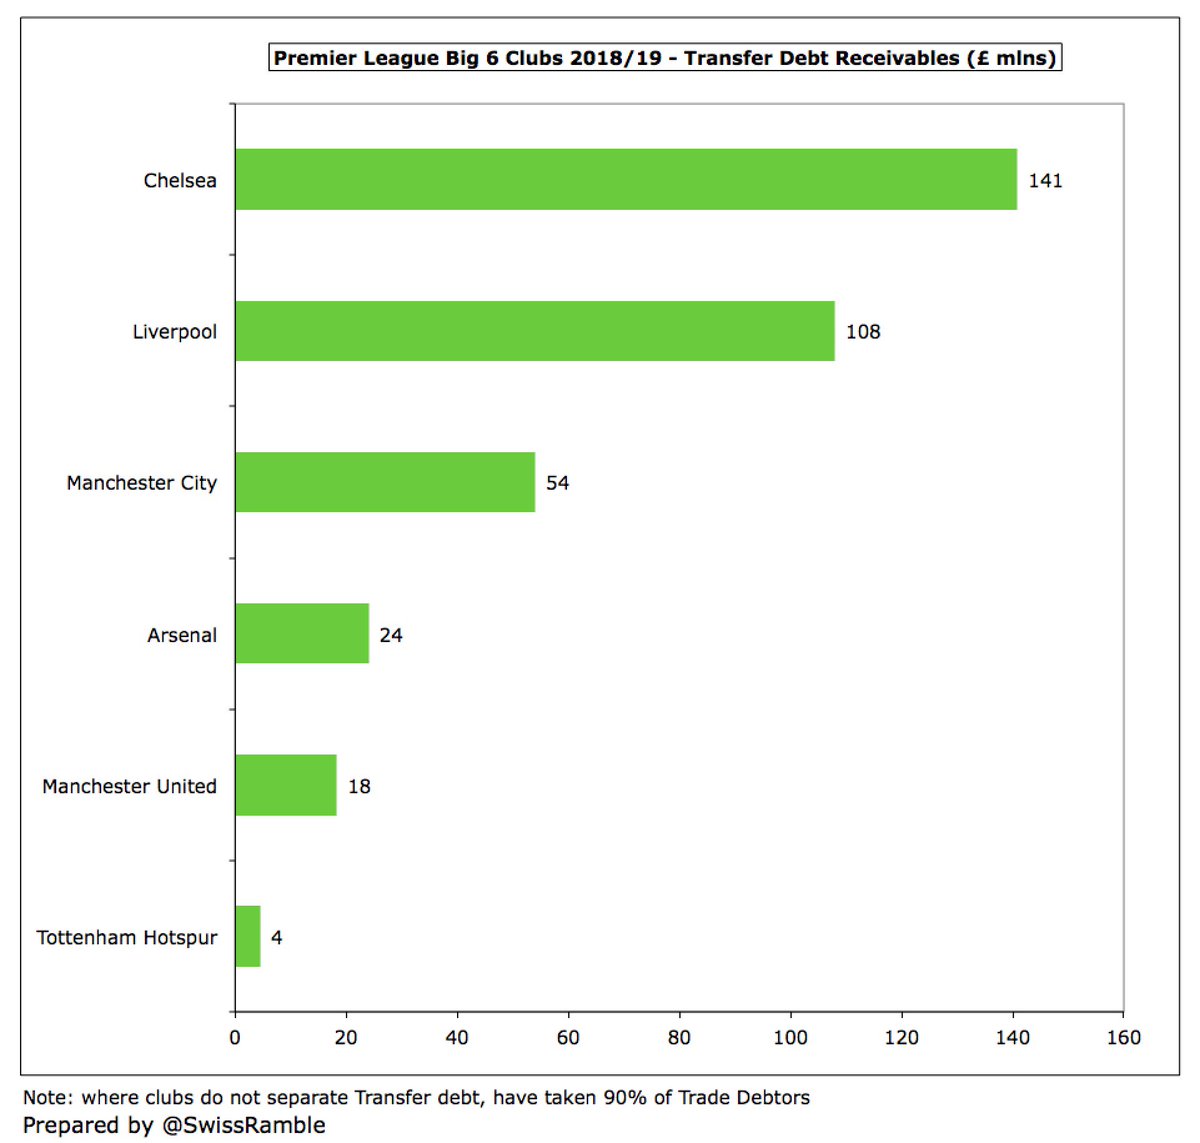
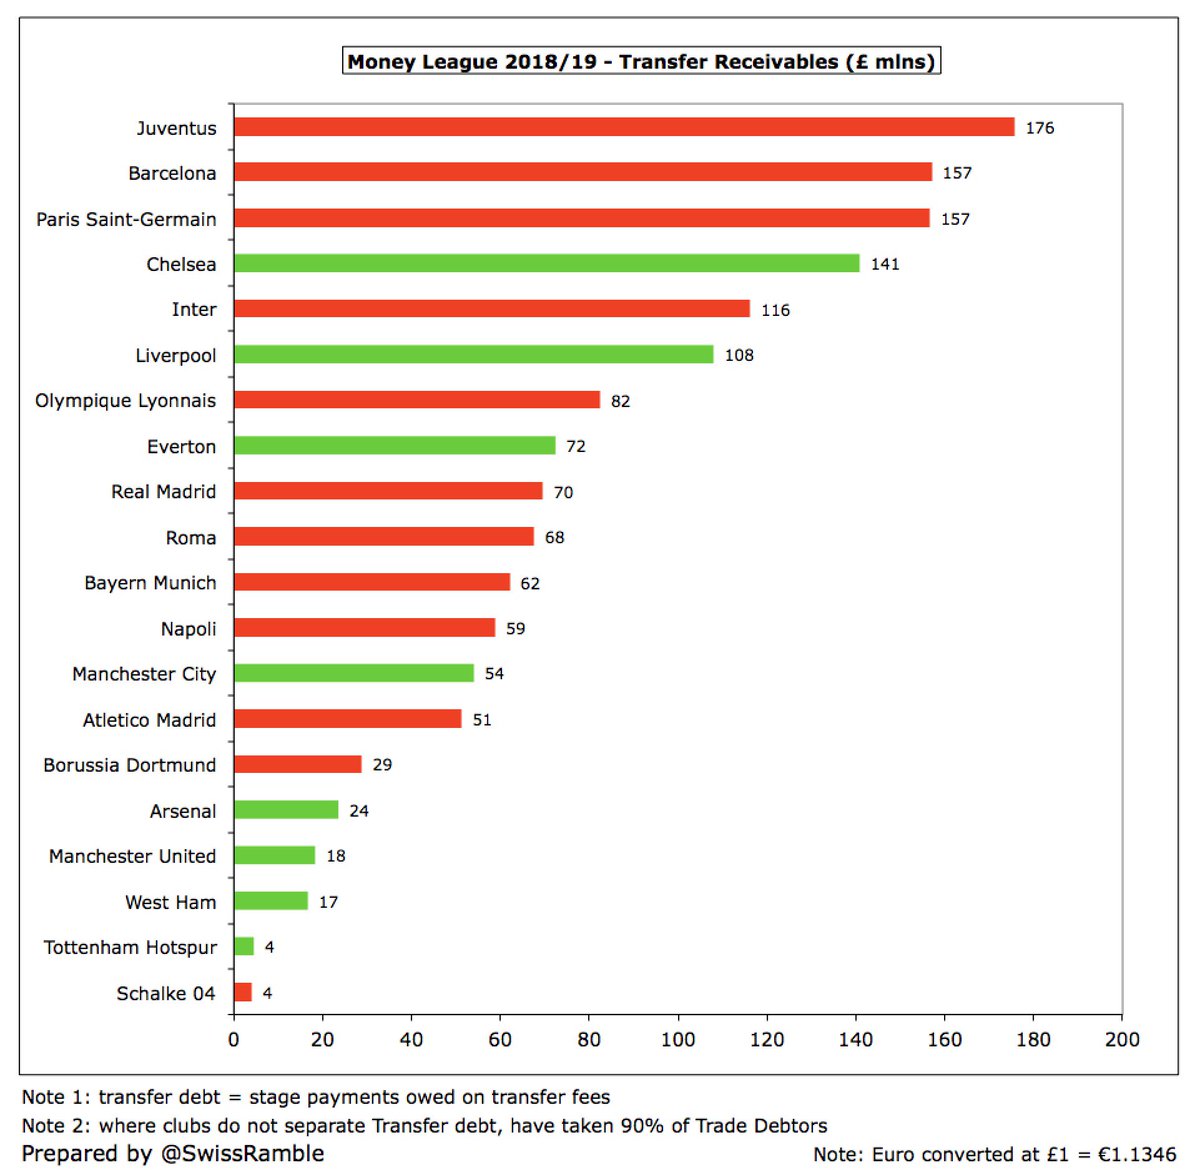
However, the Big Six clubs are in turn owed money on transfers by other clubs, led by #CFC £141m and #LFC £108m (both estimated as 90% of Trade Debtors). Much less at other clubs: #MCFC £54m, #AFC £24m, #MUFC £18m and #THFC £4m. 
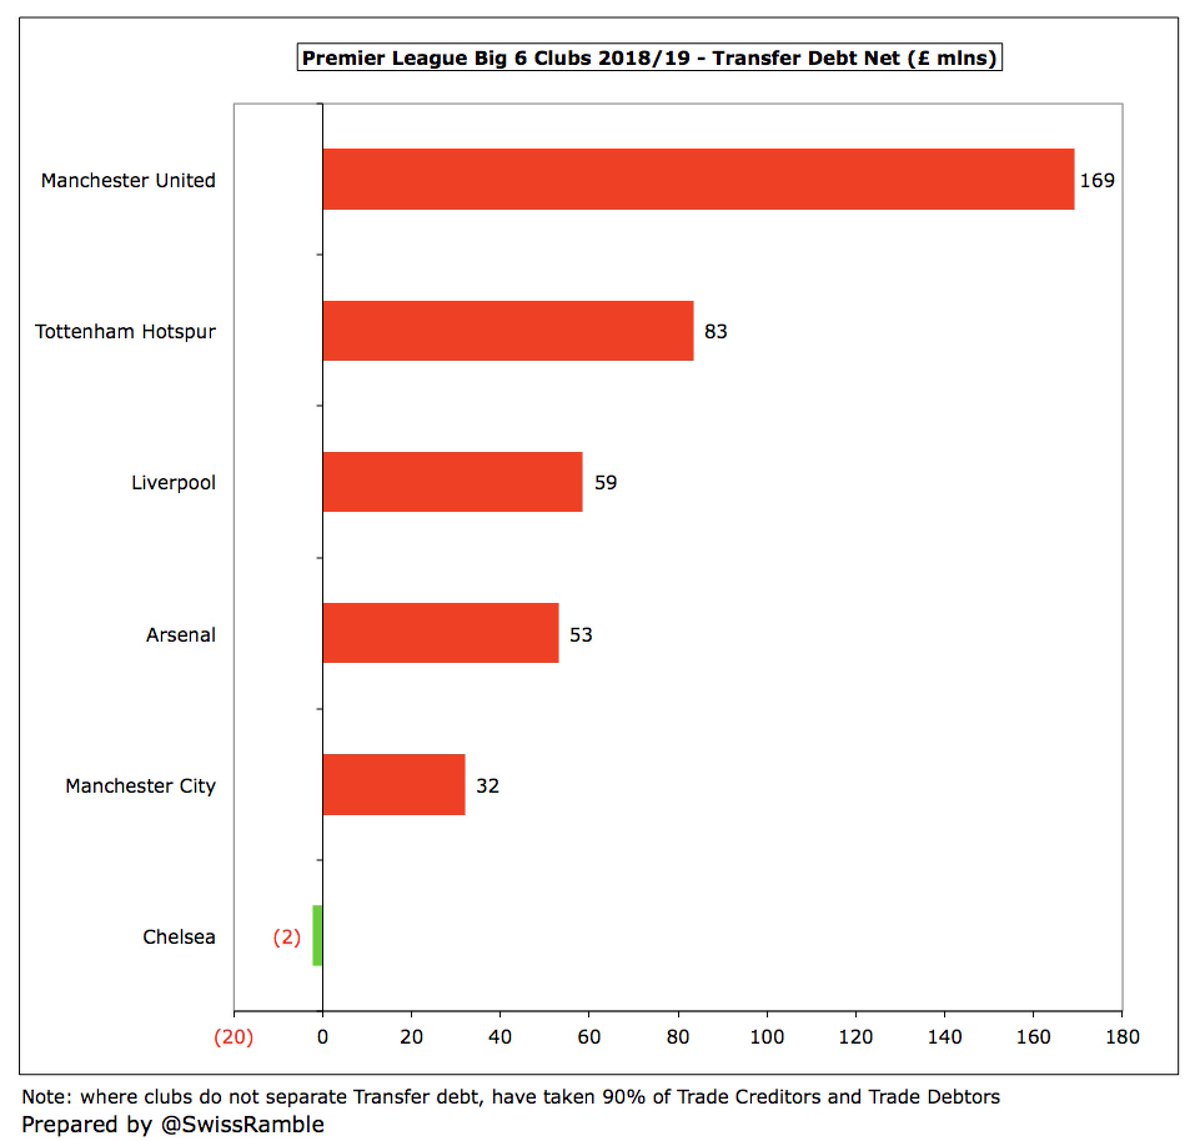
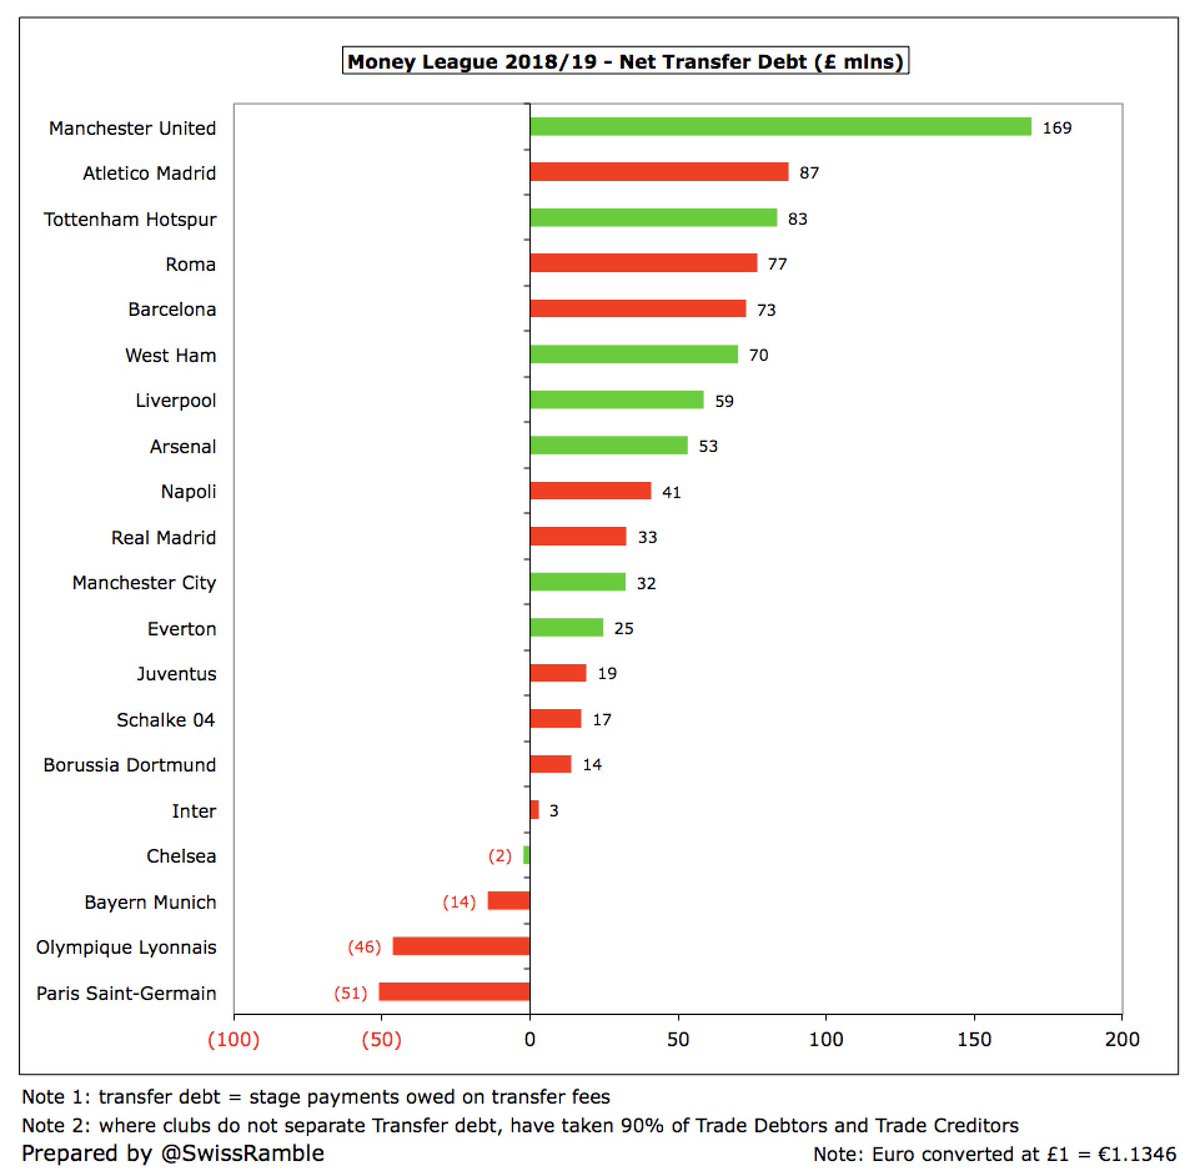
Consequently, #MUFC had by far the highest net transfer debt with a chunky £169m, followed by #THFC £83m, #LFC £59m, #AFC £53m and #MCFC £32m. By my calculations, #CFC had £2m net transfer receivables. 
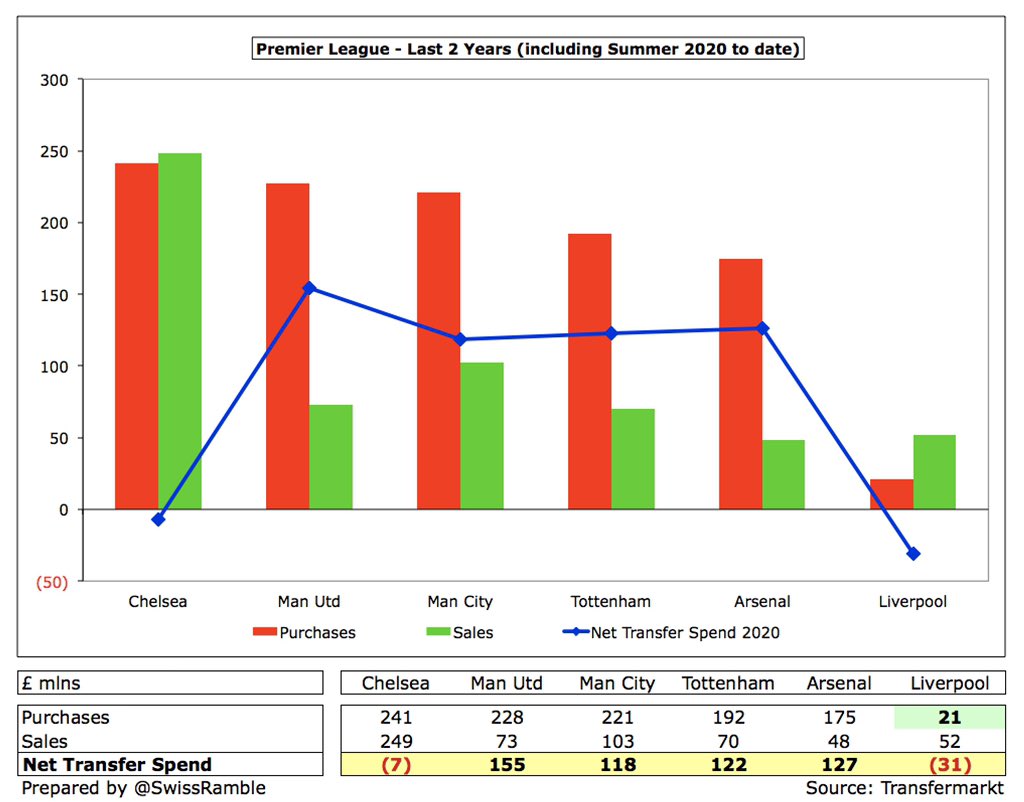
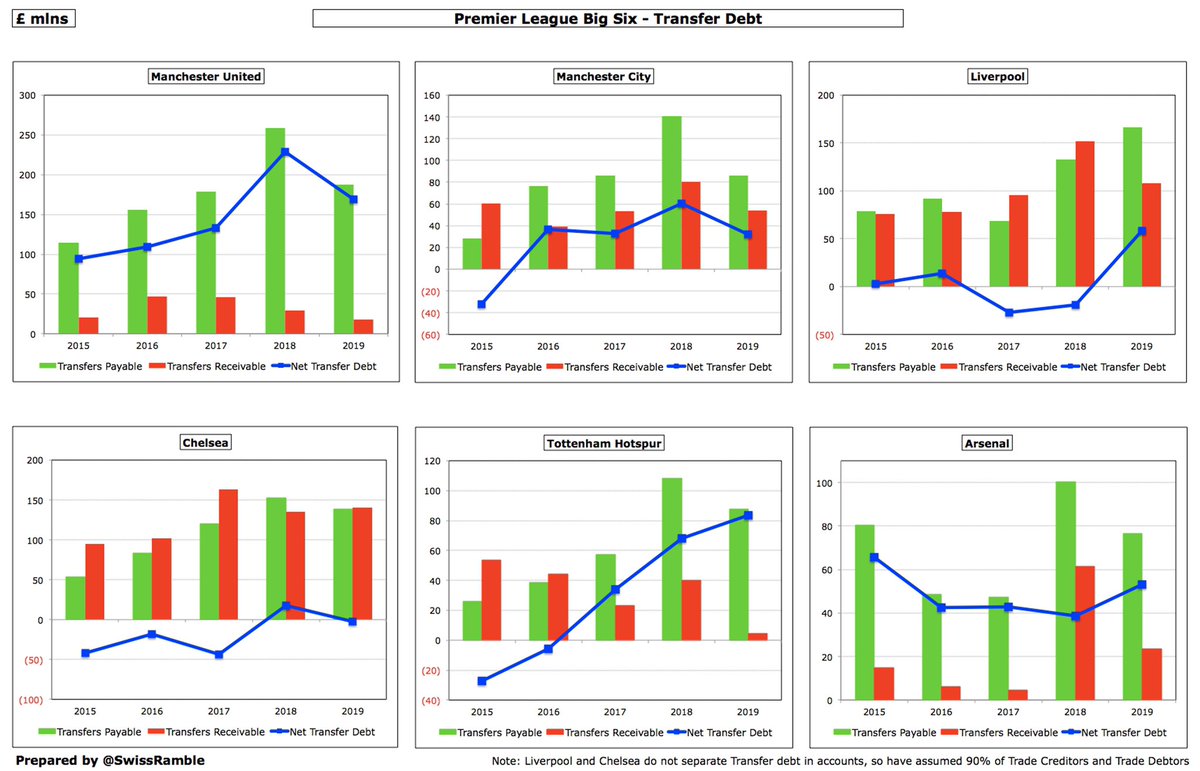
In fairness, #MUFC transfer debt has fallen from an incredible £258m in 2018 to “only” £188m. Similar reductions at other Big 6 teams except #LFC, who have seen big increases in last 2 years. Clubs are paying low sums upfront in this window, so transfer debt likely to rise again. 
Of course, continental clubs have been “financing” transfers in this way for years, so it is no surprise to see #FCBarcelona £230m and #Juventus £195m at the top of the European transfer debt league. Also quite high payables at #ASRoma £144m, #Atleti £139m and #Inter £119m. 
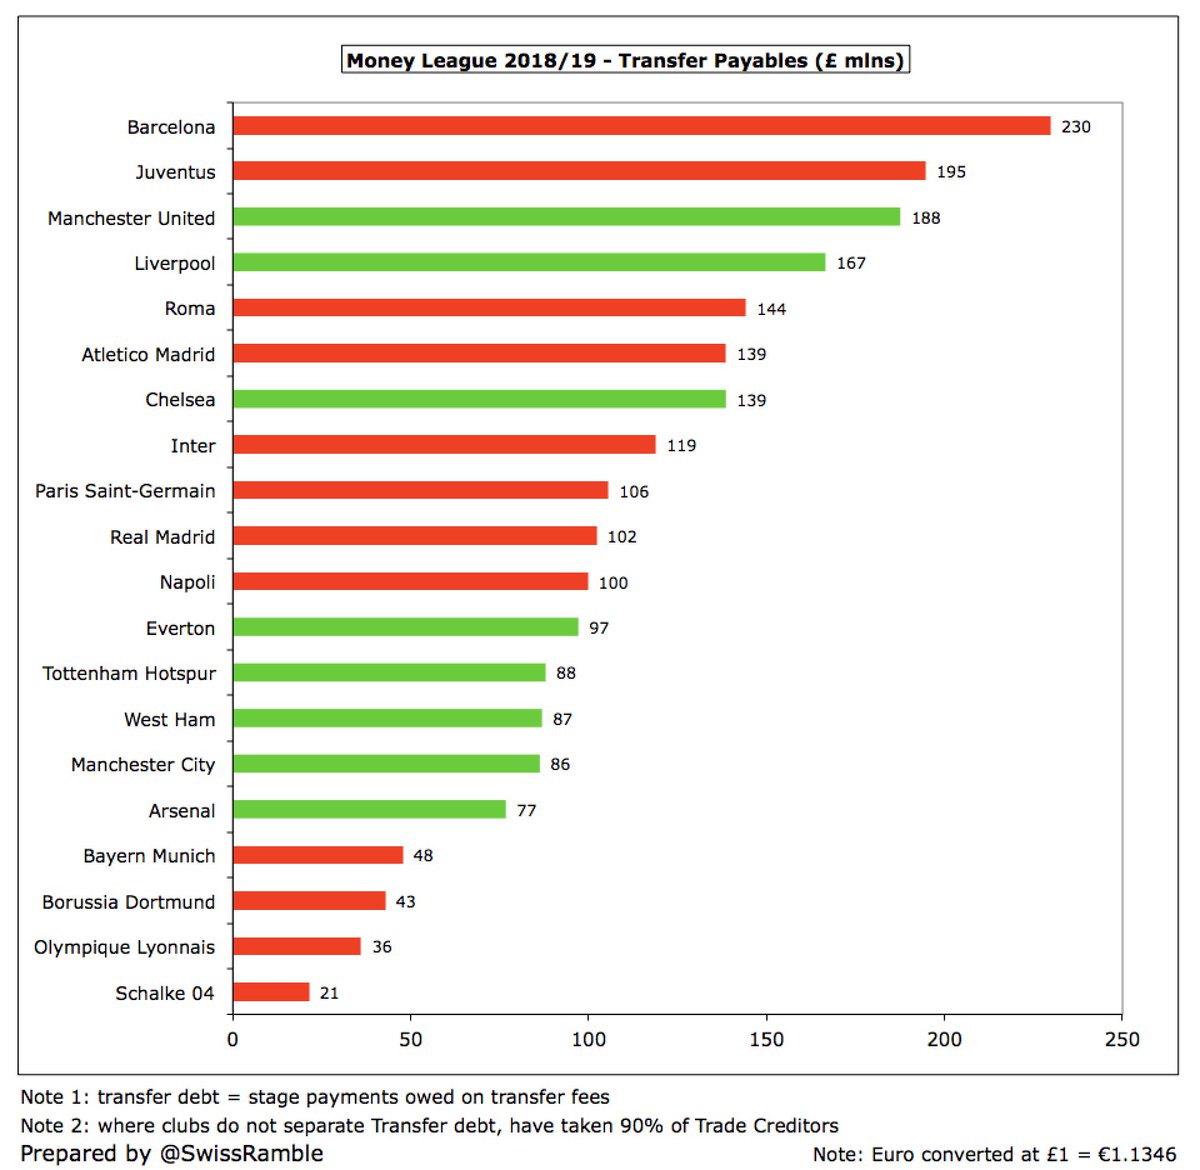
However, this approach to transfers works both ways, so the highest transfer receivables (amounts owed by other clubs) are also at #Juventus £176m and #FCBarcelona £157m, followed by #PSG £157m. 
Therefore, only one club has net transfer debt above £100m, namely #MUFC £169m. Whether United fans think that this money has been spent wisely is debatable. Next highest are #Atleti £87m, #THFC £83m, #ASRoma £77m, #FCBarcelona £73m and (maybe surprisingly) #WHUFC £70m. 
When some in the media comment on debt at European clubs, they often use the widest possible definition, i.e. total liabilities, almost as if they want to make it look as bad as possible. Those clubs might misquote Mark Twain: “Reports of my debt have been greatly exaggerated.”
Total liabilities include all operational debt: (a) trade creditors, amounts outstanding for things like rent & electricity; (b) money owed to staff; (c) accruals, where no invoice has been received; (d) provisions, which are estimate of probable future losses, e.g. legal claims. 
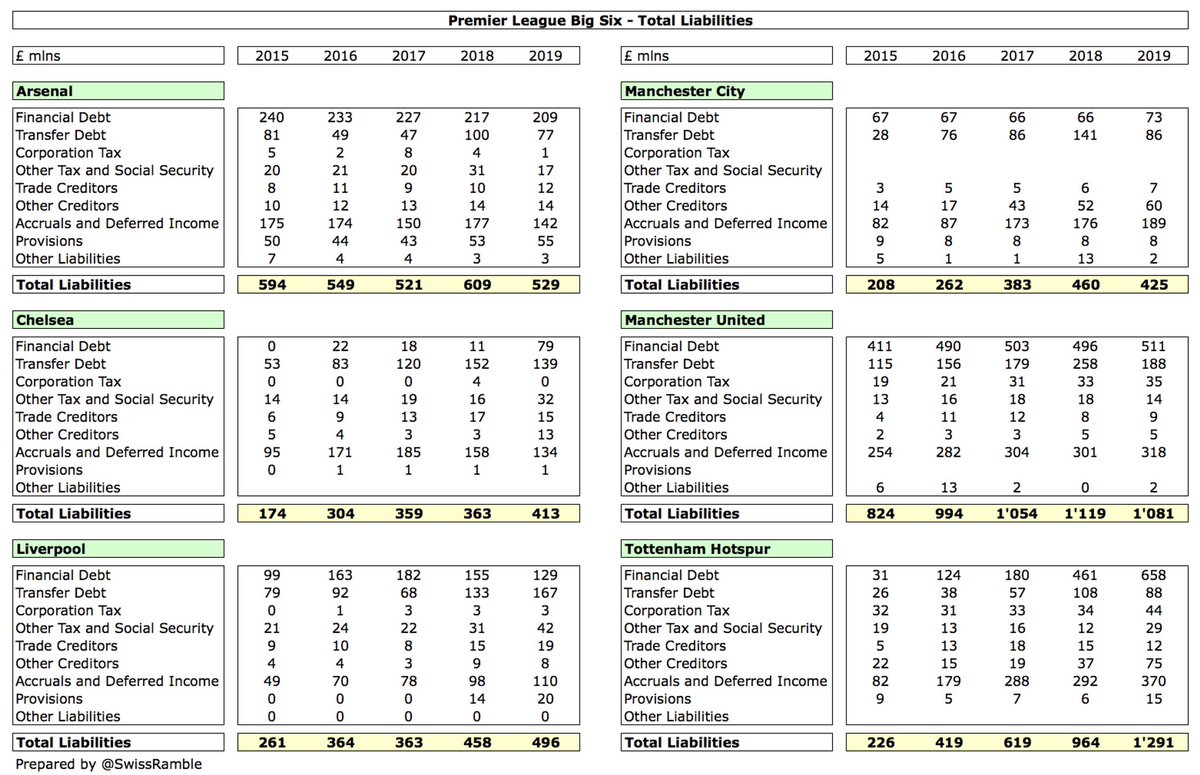
Also includes deferred income for payments received for services not yet provided, e.g. season ticket money for matches to be played in future. Booked as a liability, as cash received has not yet being fully earned, but it is clearly not a debt that will have to be repaid.
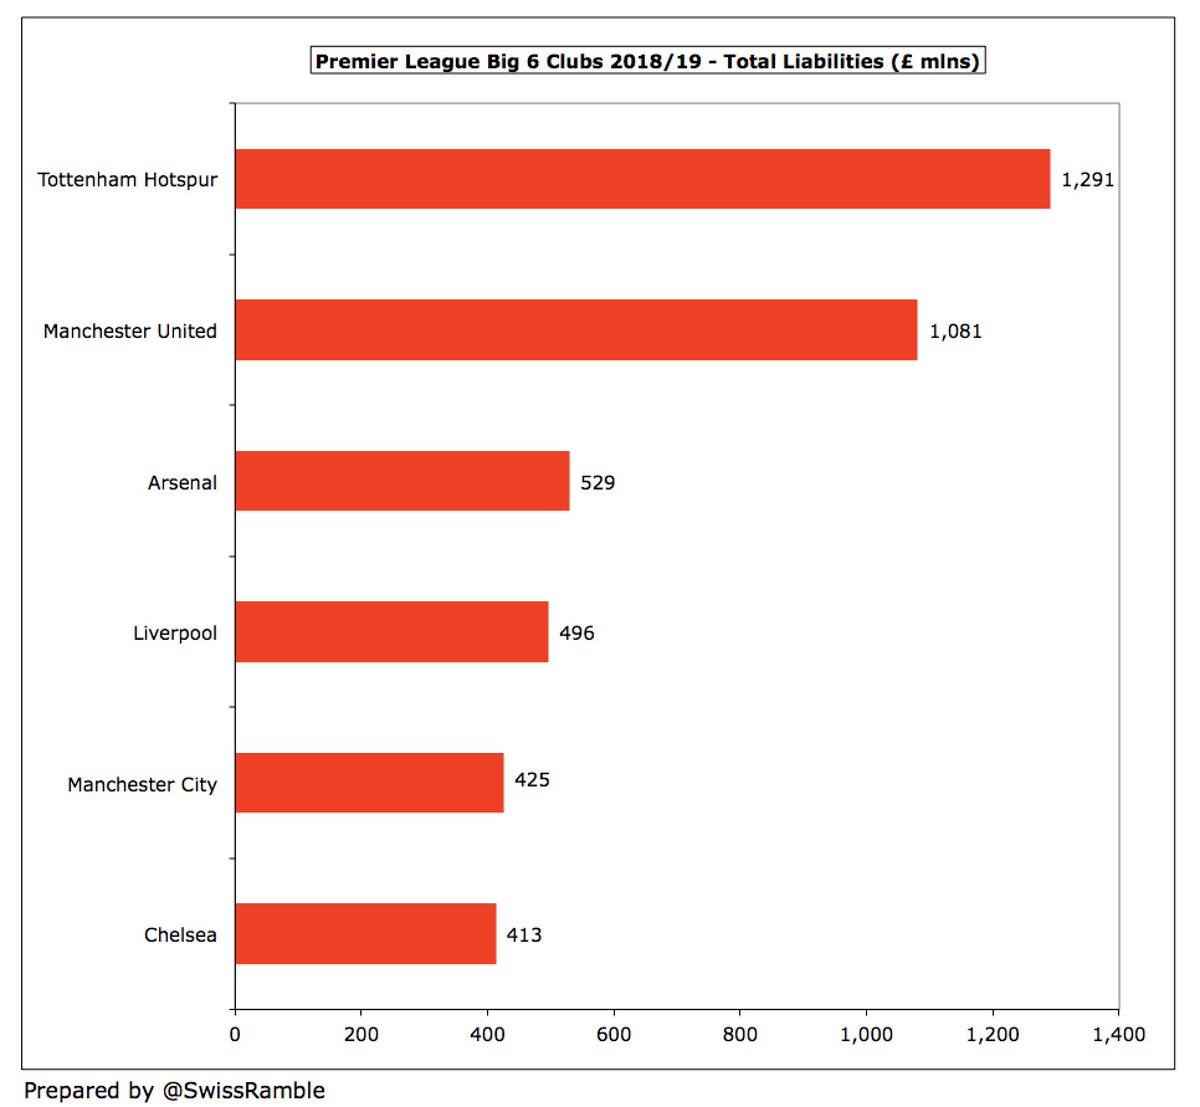
On this basis, it’s a similar story to financial debt with two clubs having over a billion total liabilities, namely #THFC £1,291m and #MUFC £1,081m, then a big gap to #AFC £529m, #LFC £496m, #MCFC £425m and #CFC £413m. 
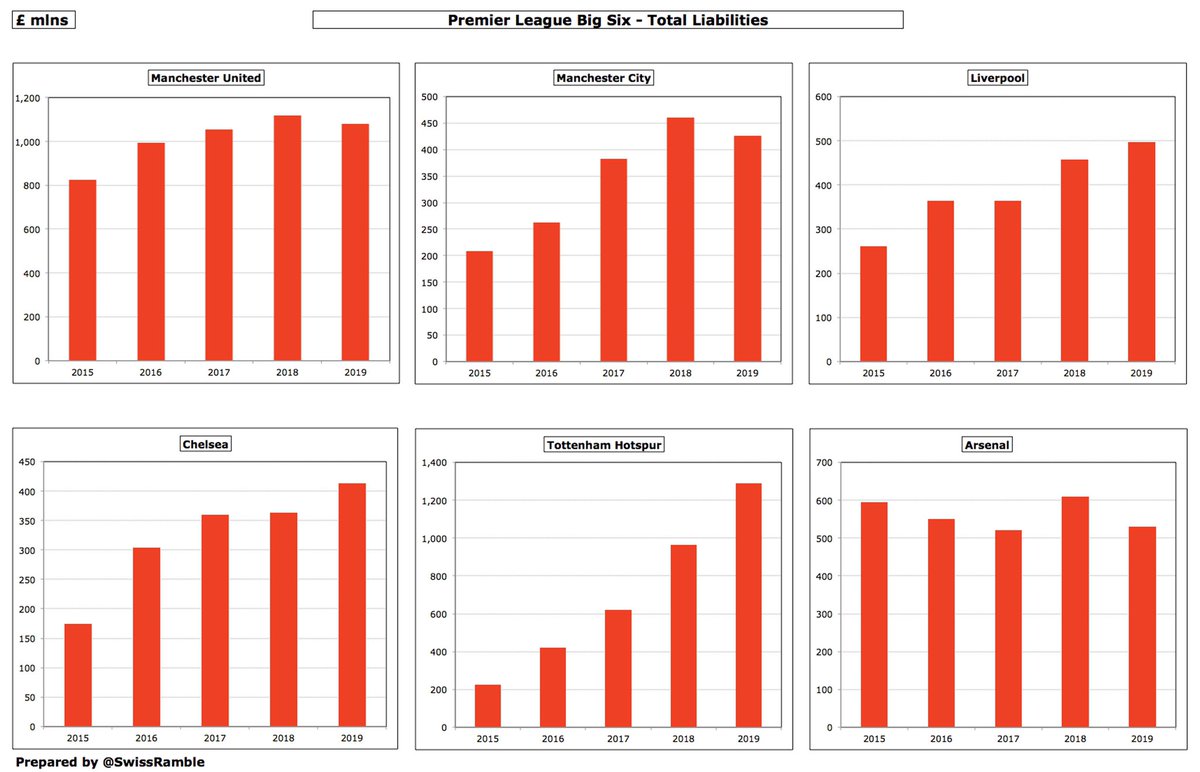
Most of the Big Six have seen their total liabilities steadily increasing over the last few years, though there were some falls in 2019 compared to the previous season, notably at #AFC (down from £609m to £529m) and #MCFC (down from £460m to £425m). 
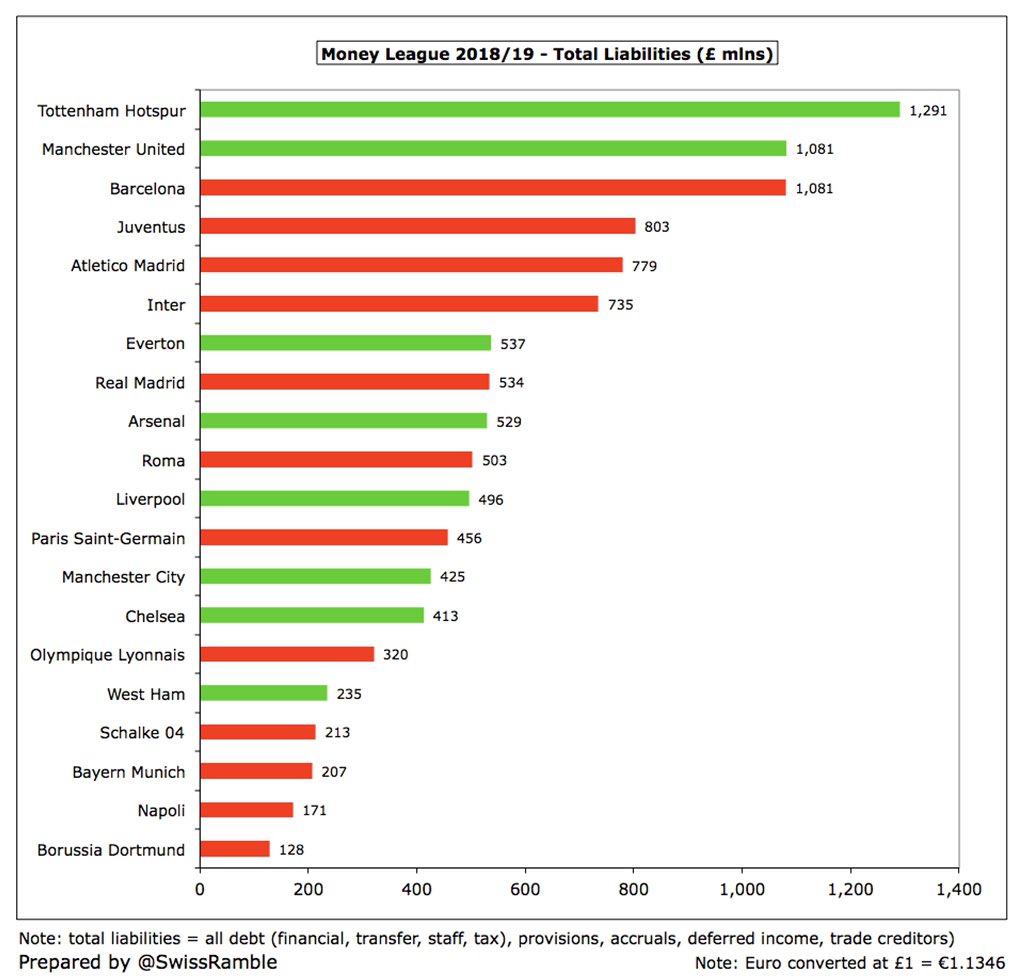
#FCBarcelona have often been criticised (with some justification) for high debt (total liabilities), but worth noting that their £1,081m is the same as #MUFC and lower than #THFC £1,291m. Also high #Juventus £803m, #Atleti £779m & #Inter £735m. In contrast, only £128m at #BVB. 
UEFA have introduced a third definition of debt, effectively between the narrow calculation of financial debt and the widest possible measure of total liabilities. This includes net debt for borrowings (i.e. bank loans, overdrafts and owner loans) plus net transfer debt. 
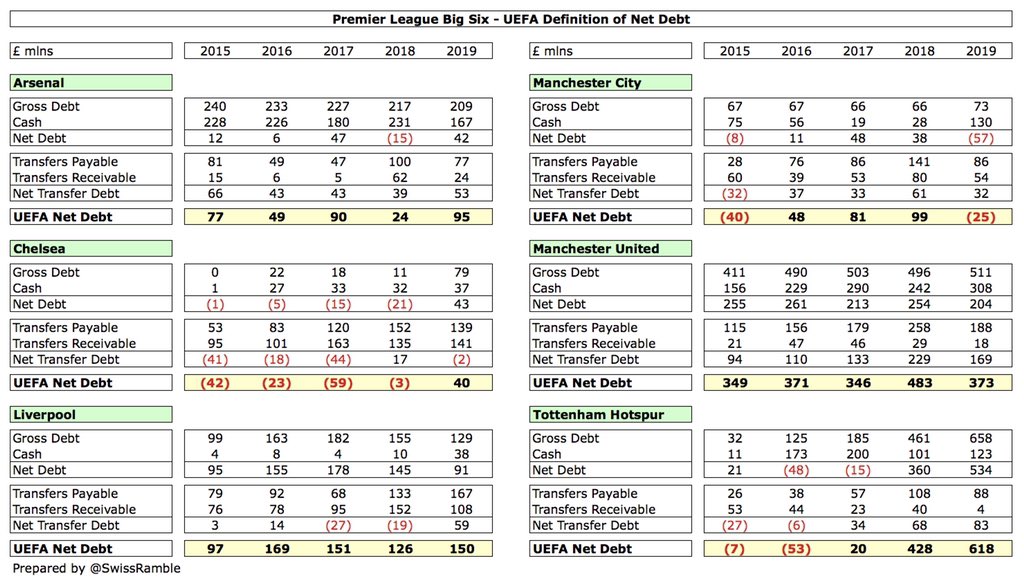
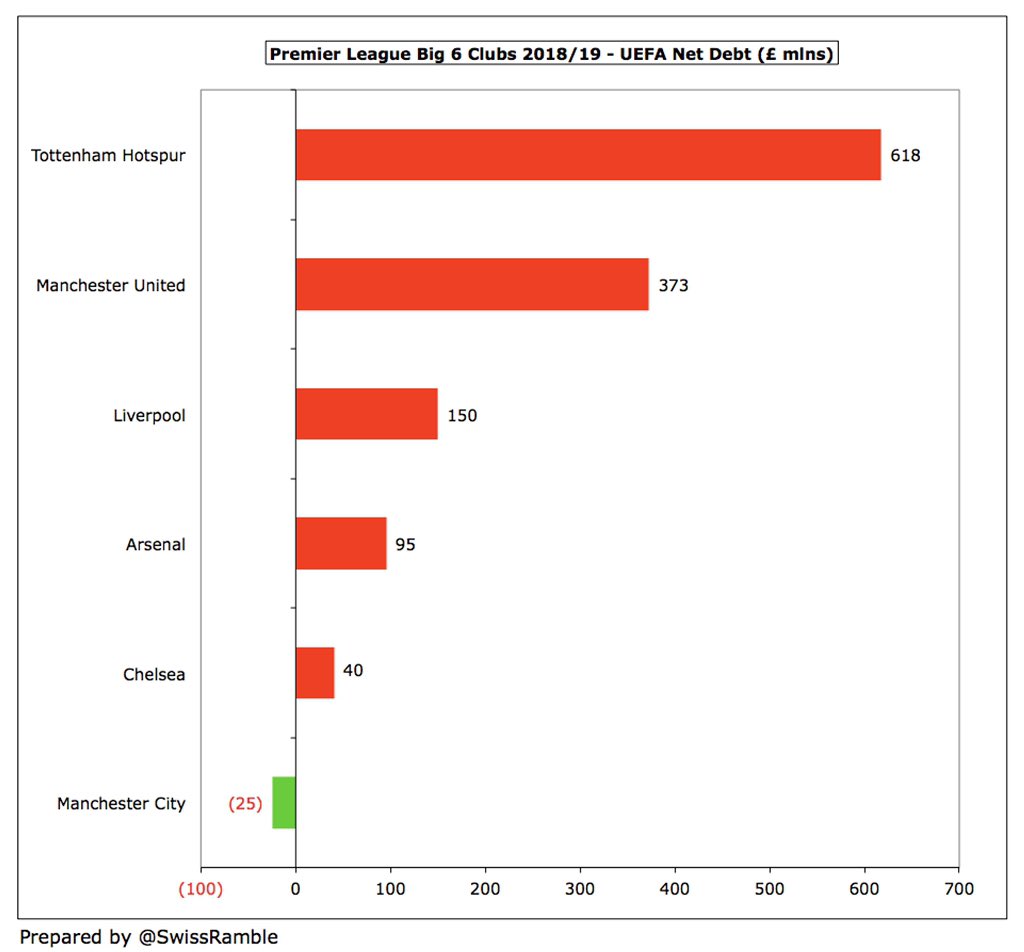
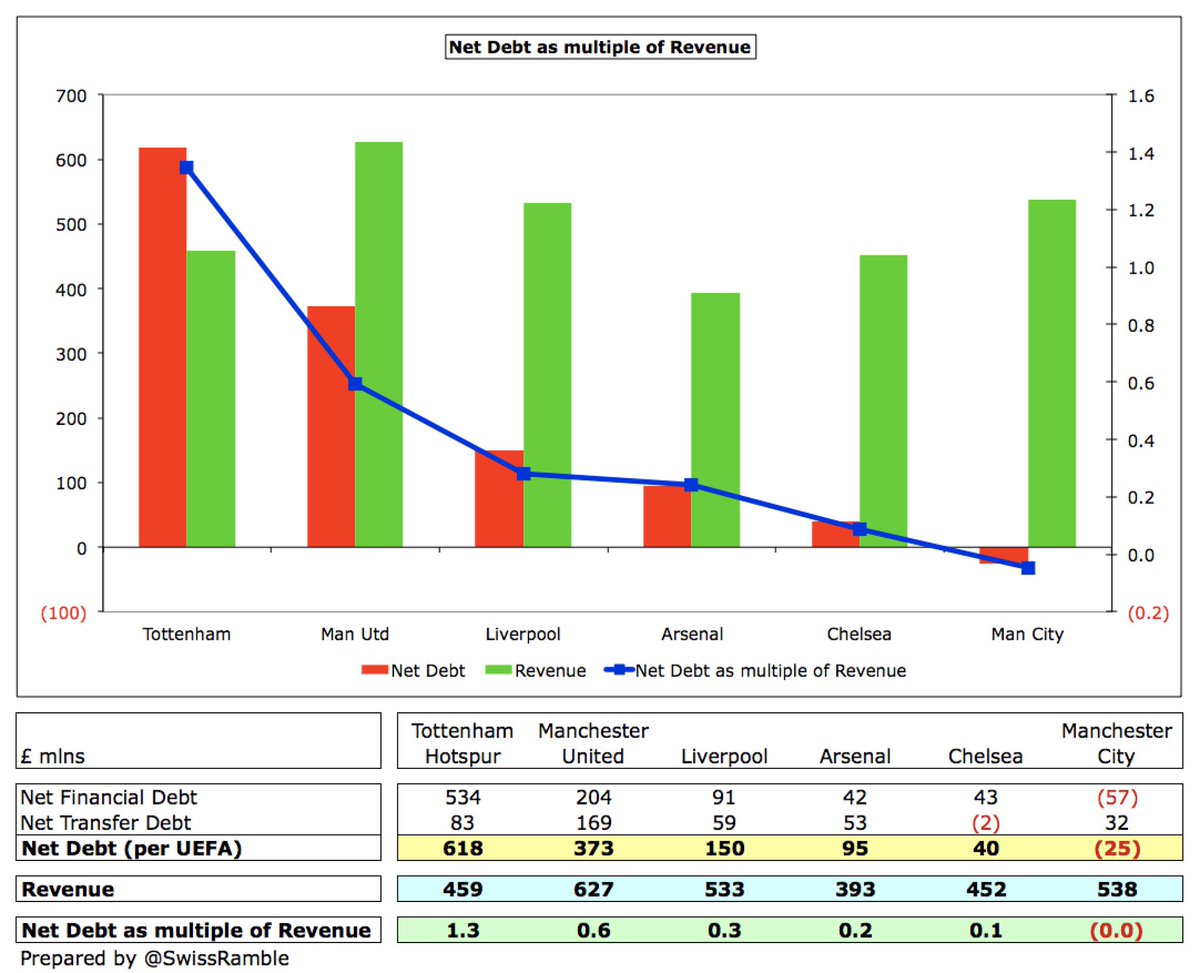
Even with this UEFA definition, it’s the same old story with highest net debt reported at #THFC £618m and #MUFC £373m, then a big gap to #LFC £150m, #AFC £95m & #CFC £40m. #MCFC actually have £25m net funds, as much of their financing has been via share capital from their owners. 
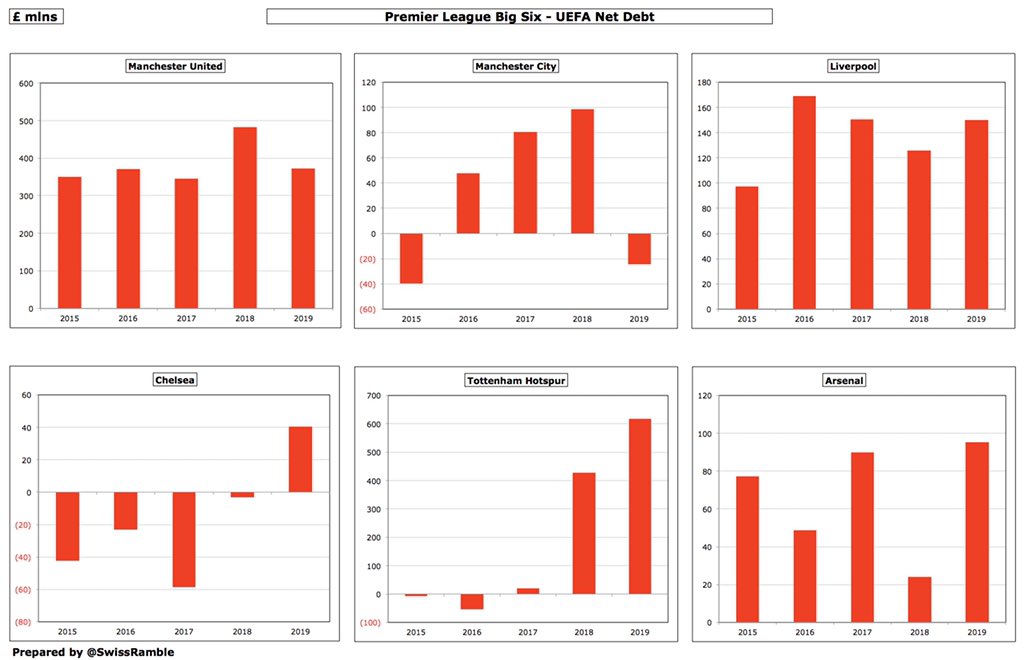
The UEFA definition of net debt is more volatile over the years. For example, #AFC shot up from £24m to £95m in 2019, largely due to a steep reduction in cash from £231m to £167m. Ironically, it tends to reward clubs where owners provide funding in the form of share capital. 
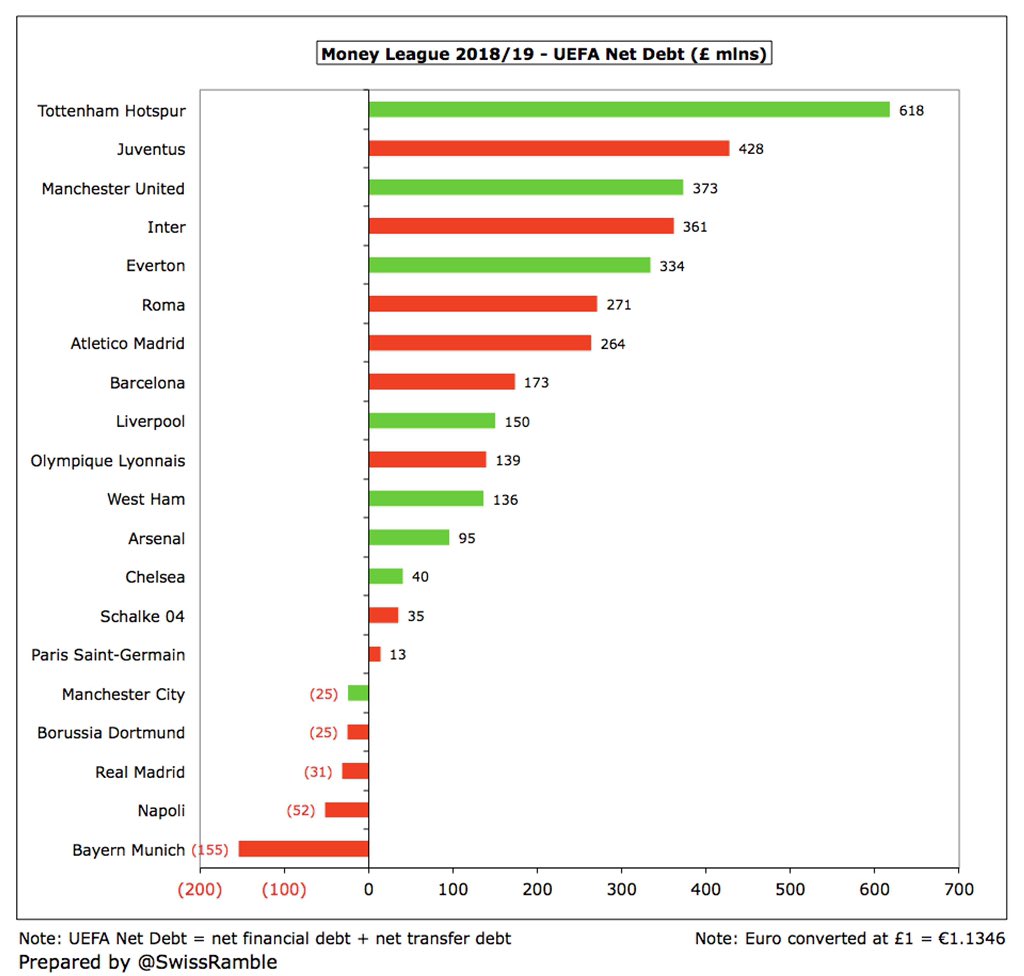
In Europe, the highest net debt per UEFA’s definition is like a re-run of the old Anglo-Italian Cup with #THFC leading the way with £618m, followed by #Juventus £428m, #MUFC £373m and #Inter £361m. #FCBayern look best on this basis with £155m net funds. 
To state the obvious, liabilities are only one side of the story (or balance sheet). To get a full picture of a club’s health, we should also look at its assets. This is where English clubs look better, as they often have higher assets, as they usually own their own stadiums.
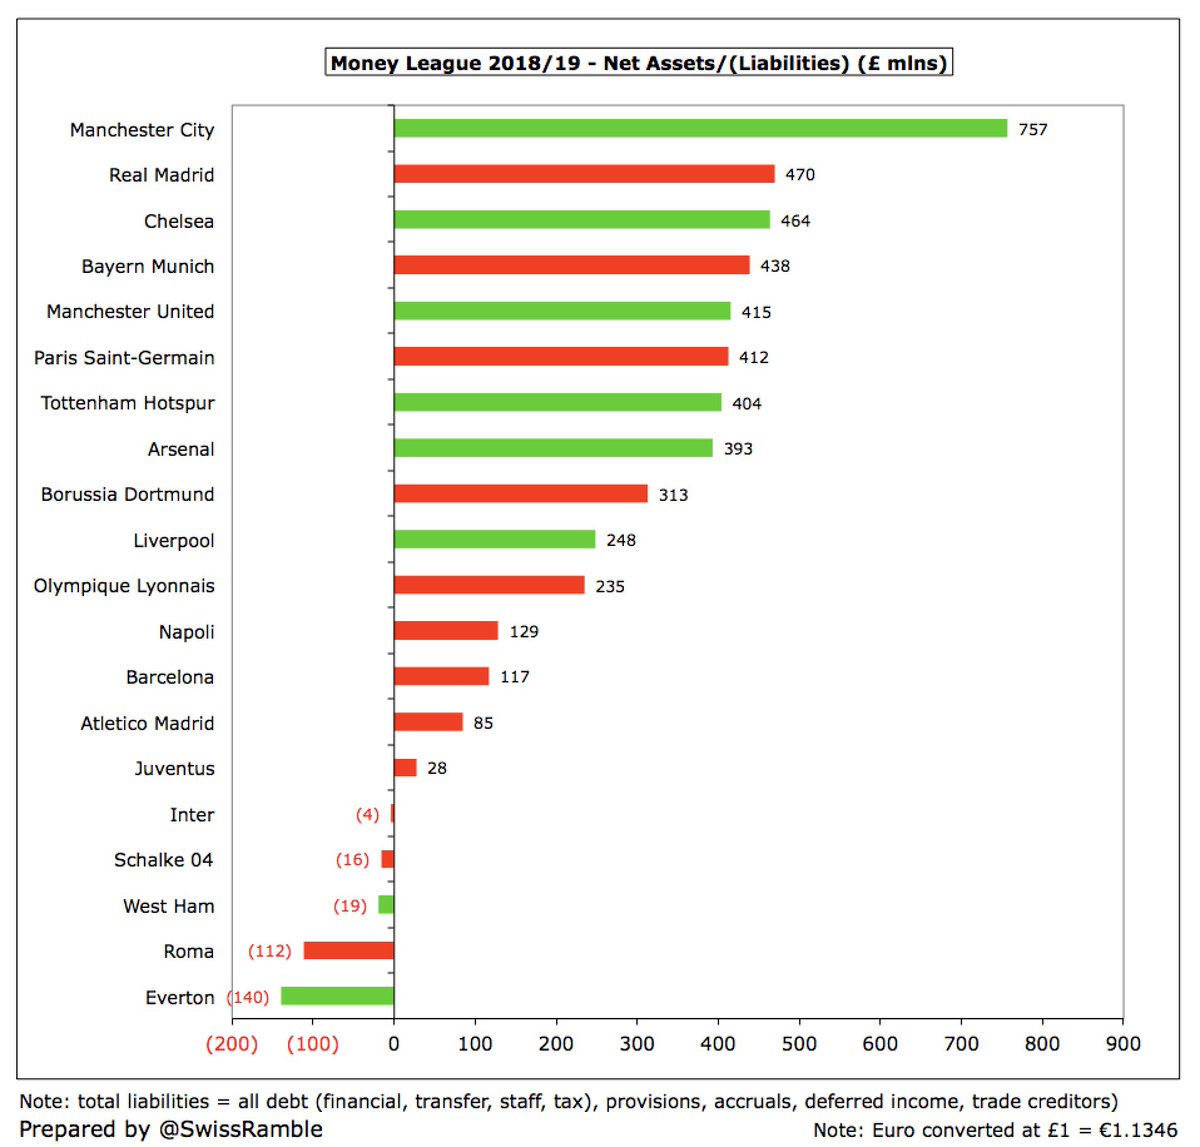
In this way, three clubs have assets over a billion: #THFC £1,695m, #MUFC £1,497m and #MCFC £1,182m. #MCFC net assets (assets less liabilities) are a mighty £757m, followed by #CFC £464m, #MUFC £415m, #THFC £404m, #AFC £393m and #LFC £248m. 
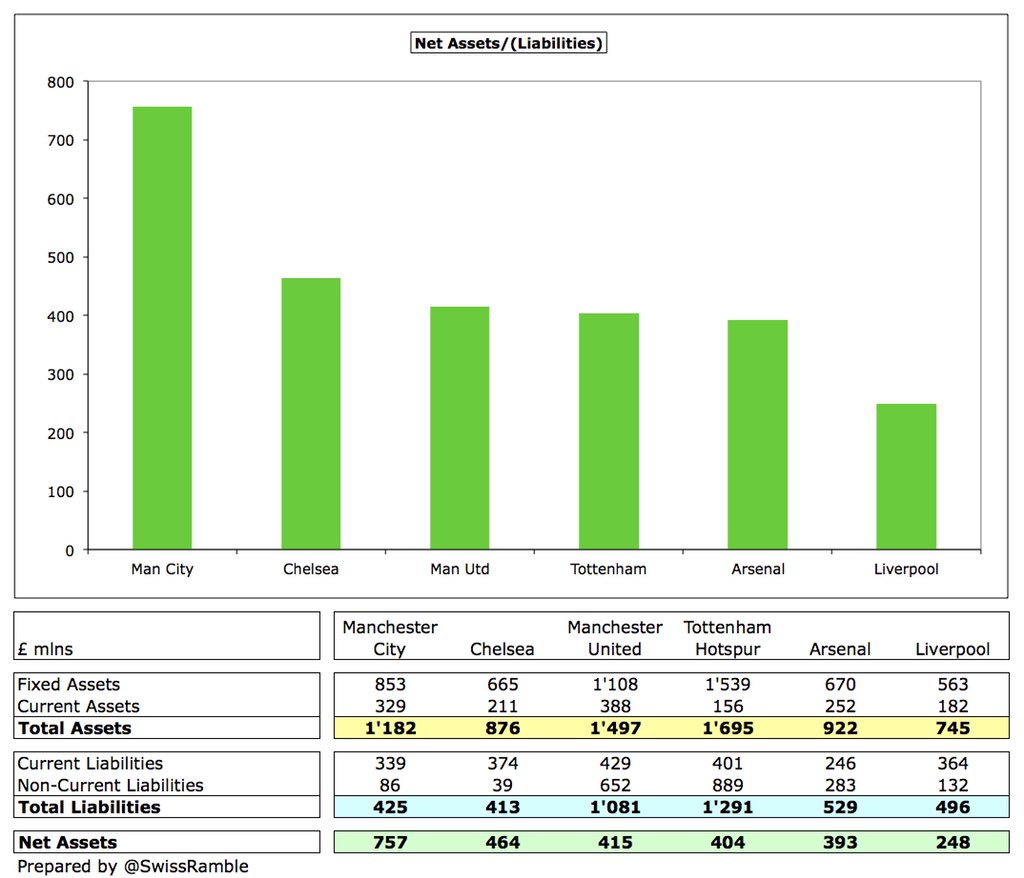
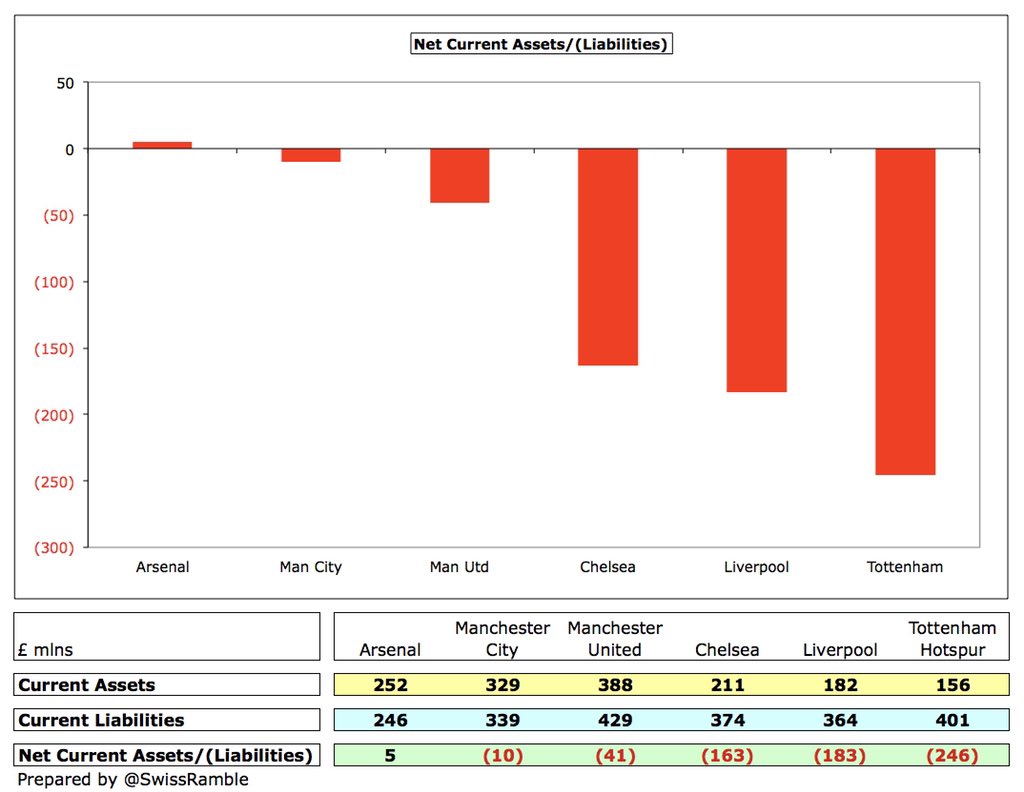
The picture is less rosy when we look at net current assets (current assets less current liabilities), where liabilities are higher than assets in all cases except #AFC – and their net receivable is only £5m. 
In terms of net assets, 5 of the top 8 clubs in Europe are English with #MCFC leading with £757m. The 3 best placed continental clubs are #RealMadrid £470m (2nd), #FCBayern £438m (4th) & #PSG £412m (6th). Five clubs have net liabilities: #EFC, #ASRoma, #WHUFC, Schalke & #Inter. 
Once again, accounting values are a little misleading when looking at the balance sheet, because of the way that some assets are treated. This can be clearly seen with player valuations, which are shown in the books as the original transfer fee less accumulated amortisation.
However, the value in the real world is almost always higher. This is particularly the case with players developed in-house, which have zero value in the accounts. I don’t know exactly how much Messi would be worth if sold, but I do know that it’s more than zero.
In this way, the real value of a club’s assets is much higher, e.g. #LFC player values were £369m in the accounts, but the market value (per Transfermarkt) is £615m higher at £984m. Of course, that value can only be realised when a player is sold, but you get the point. 
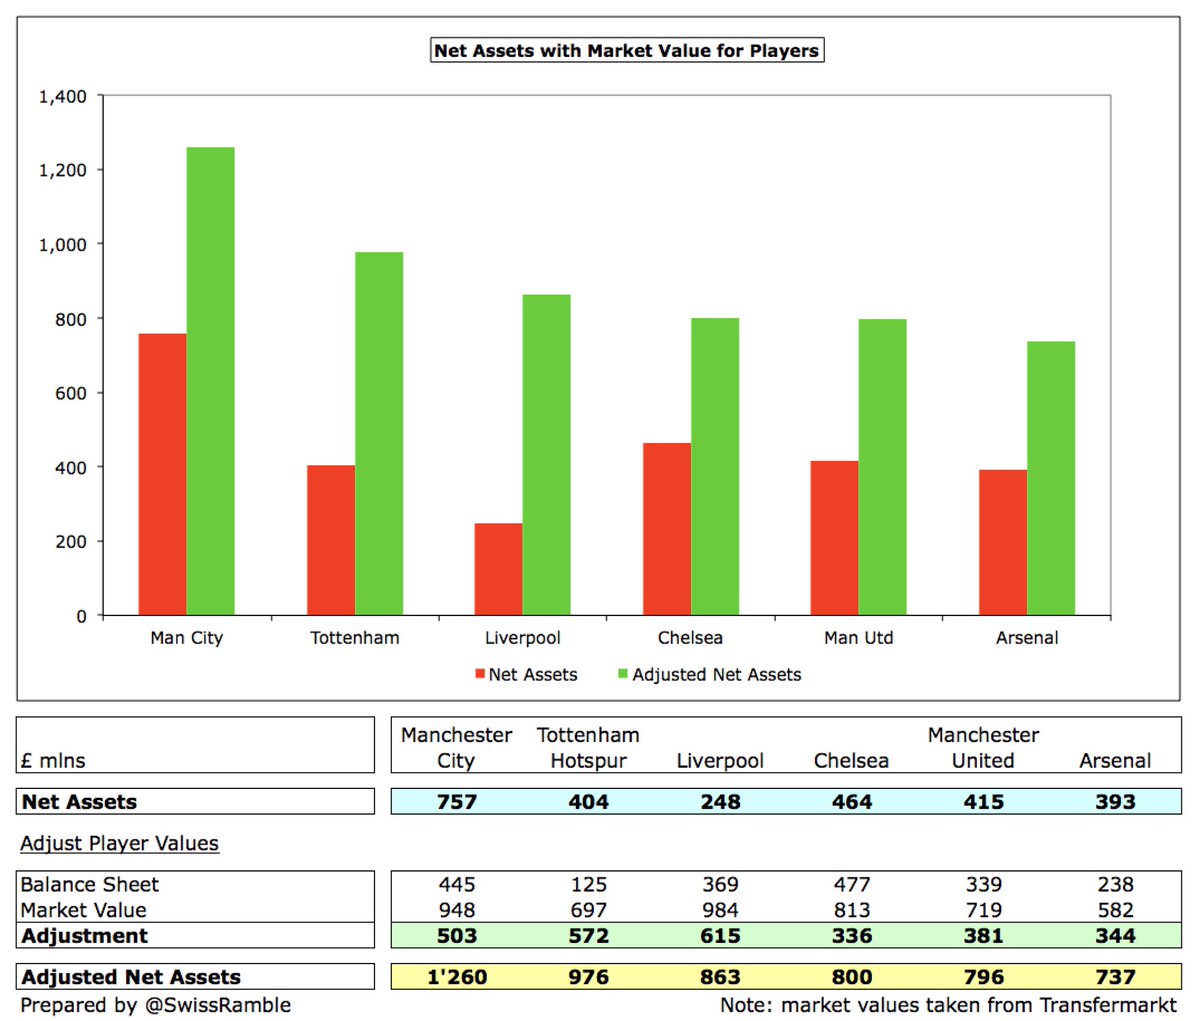
In addition, some of the other assets of a club, such as a loyal supporter base, reputation/brand, membership/access rights to lucrative competitions, are not included within balance sheet asset, since they are very difficult to value, despite them unquestionably having a value.
This is highlighted when a club is sold. Invariably, the purchaser pays a higher price than the value in the accounts and the difference is booked as an asset called goodwill, e.g. #MUFC balance sheet includes £421m goodwill related to the PLC acquisition of the club in 2005.
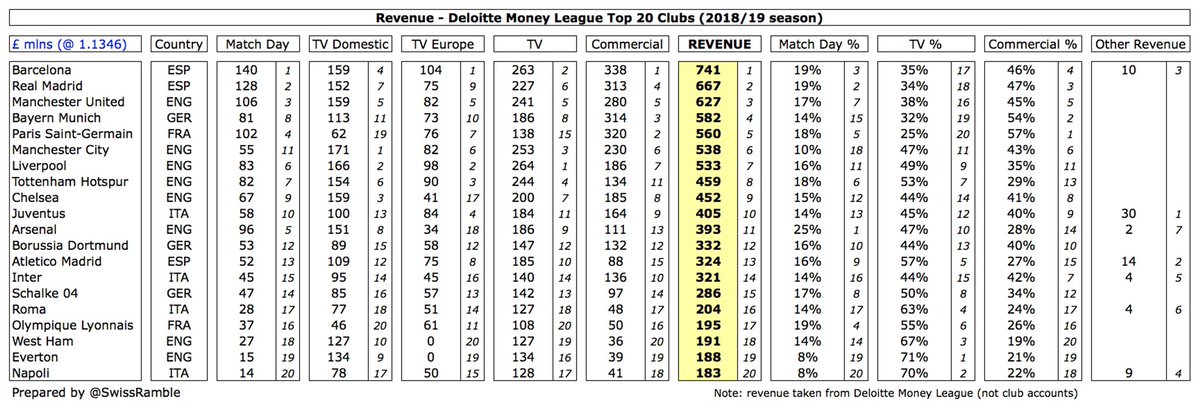
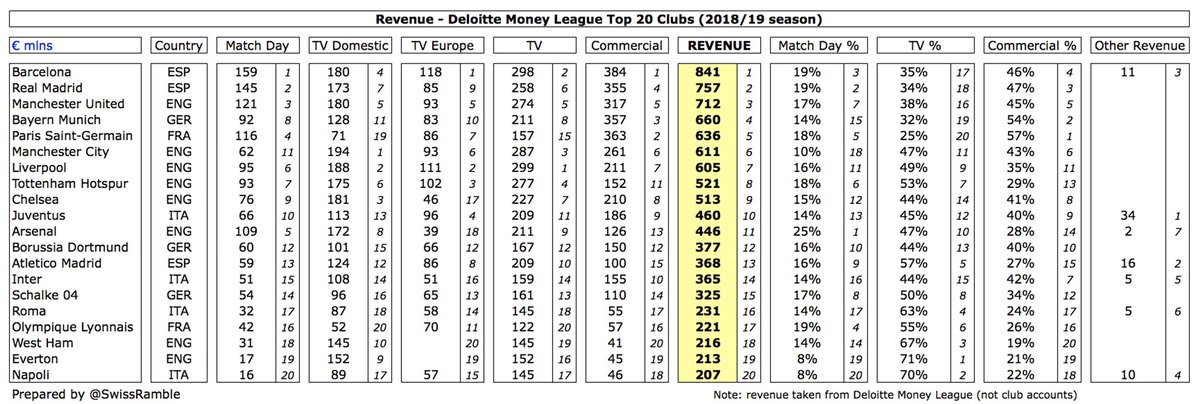
One way of looking at debt is to express it as a multiple of annual revenue. Using the UEFA definition of net debt, most of the Big Six have very low multiples: #CFC 0.1, #AFC 0.2 and #LFC 0.3 (and #MCFC have net funds). The highest multiples are #THFC 1.3 and #MUFC 0.6. 
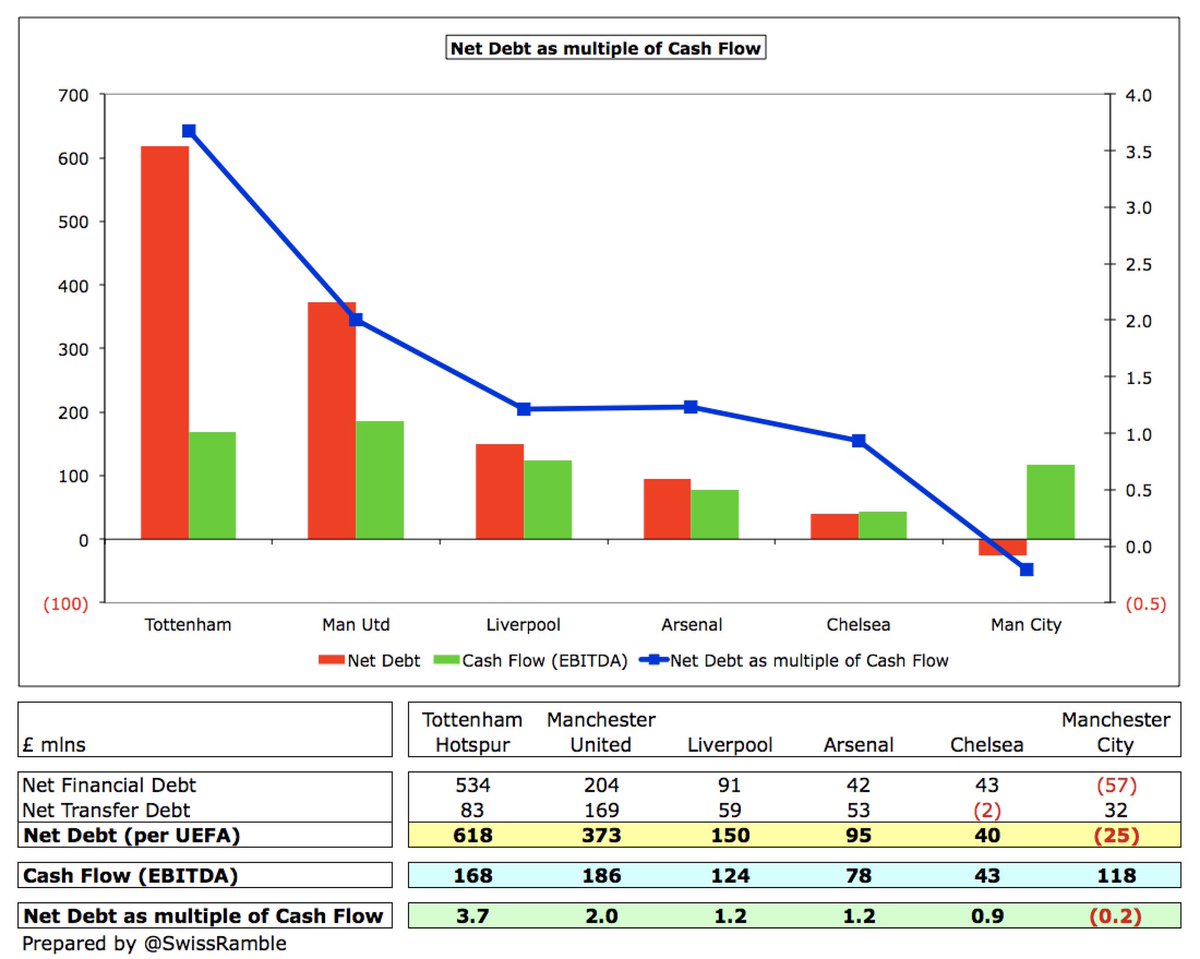
However, as the old saying goes, “revenue is for vanity, profit is for sanity, cash is king”, so a more useful ratio might be cash flow to debt. There are many ways of defining cash flow, but I have used EBITDA (Earnings Before Interest, Taxation, Depreciation and Amortisation).
On that basis, net debt is more than twice annual cash flow at #THFC 3.7 and #MUFC 2.0, while #LFC 1.2, #AFC 1.2 and #CFC 0.9 are more reasonable. Again, not an issue for #MCFC, who have net funds. 
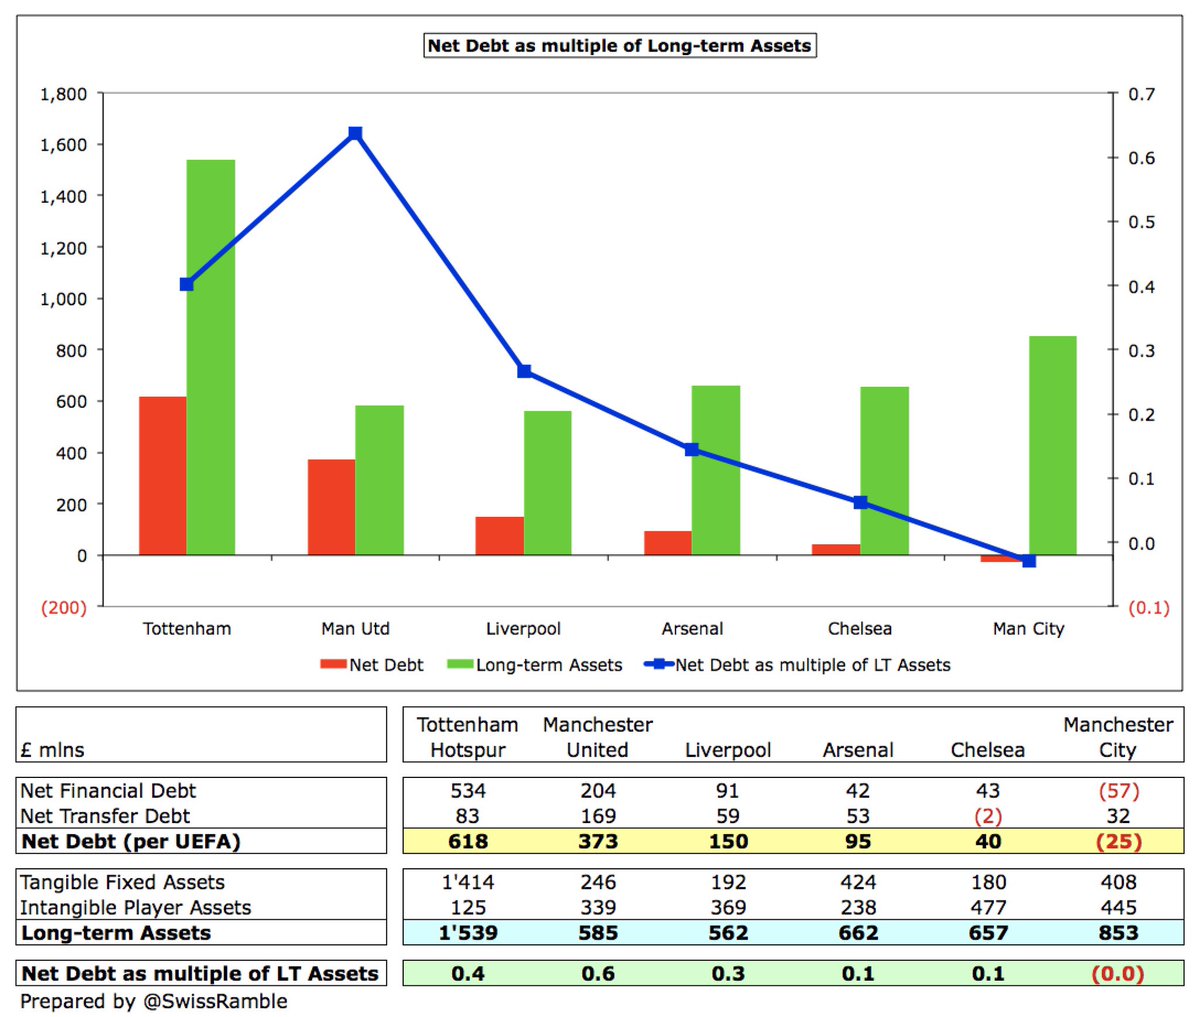
Another interesting ratio is debt to long-term assets, as these assets are often used as security for debt and funded by that debt. Here, a low multiple is good, so advantage #MCFC (net funds), #AFC 0.1 and #CFC 0.1. #THFC look a bit better here, due to value of the new stadium. 
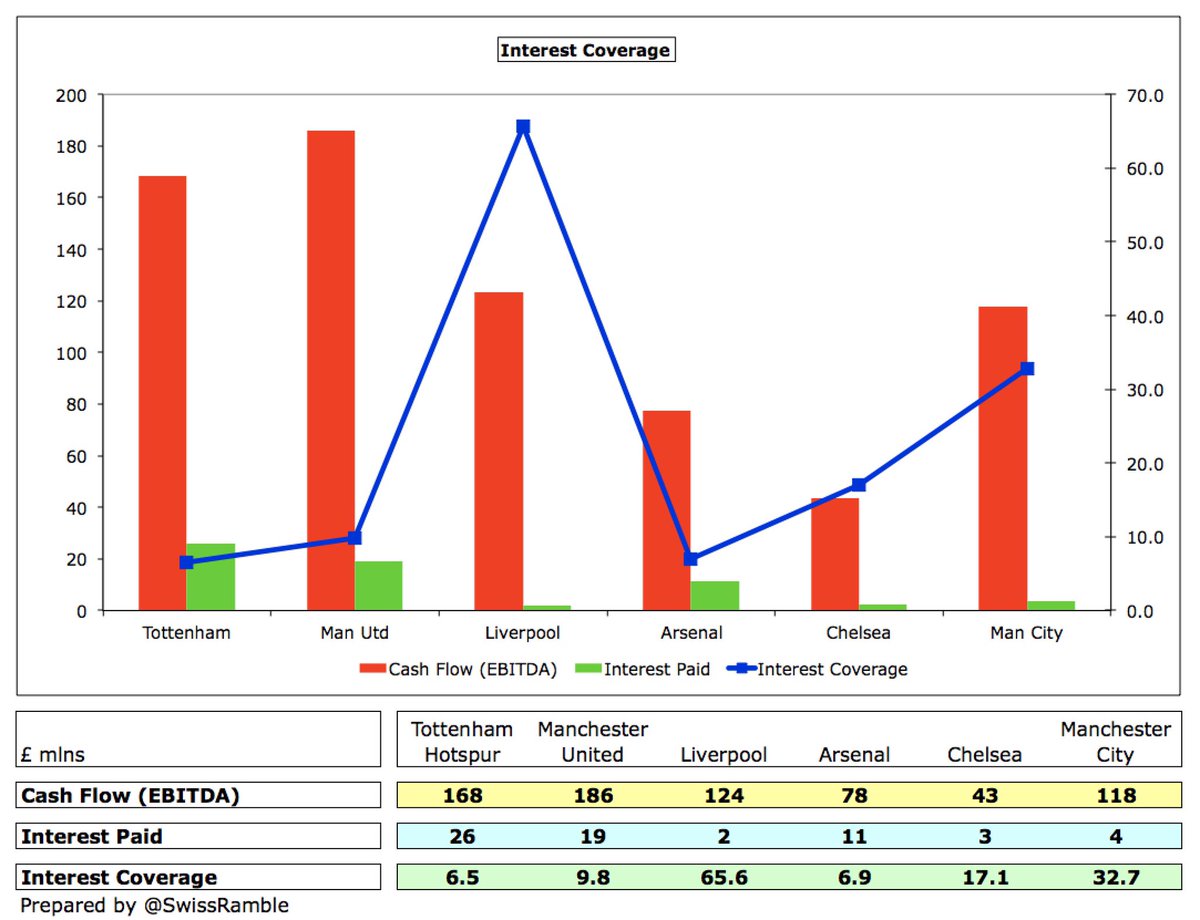
While it is important to be able to ultimately pay off debt, the ability to service interest expenses is absolutely crucial, as seen by interest coverage (cash flow/interest paid). The lowest (worst) ratios here are #THFC 6.5 and #AFC 6.9, but neither are particularly worrying. 
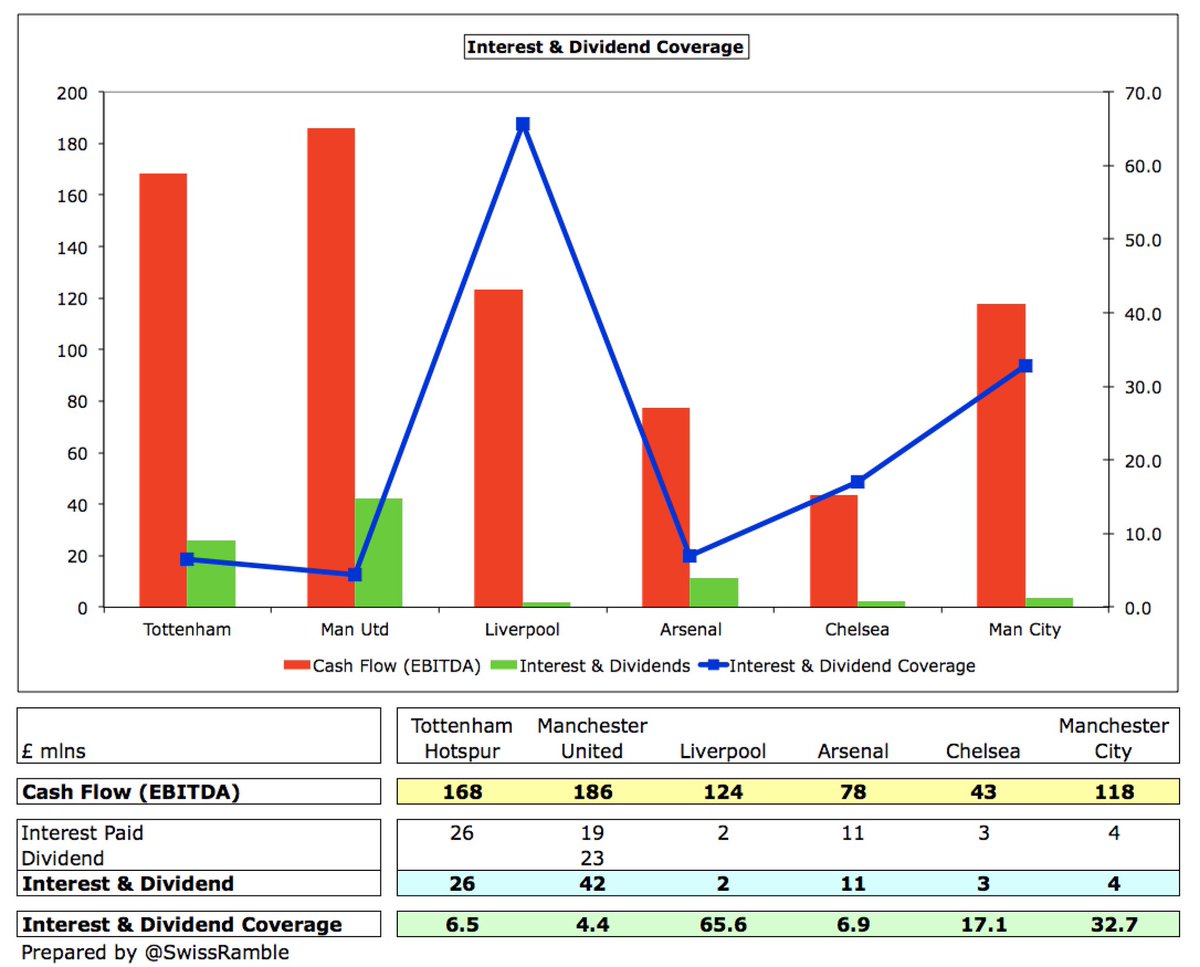
If we add dividends to interest, the ratio worsens at #MUFC to 4.4, as they have to make a total of £42m payments every year (£19m interest plus £23m dividends). Regardless of the club’s ability to cover this expense, the club’s fans would prefer this to be spent on the squad. 
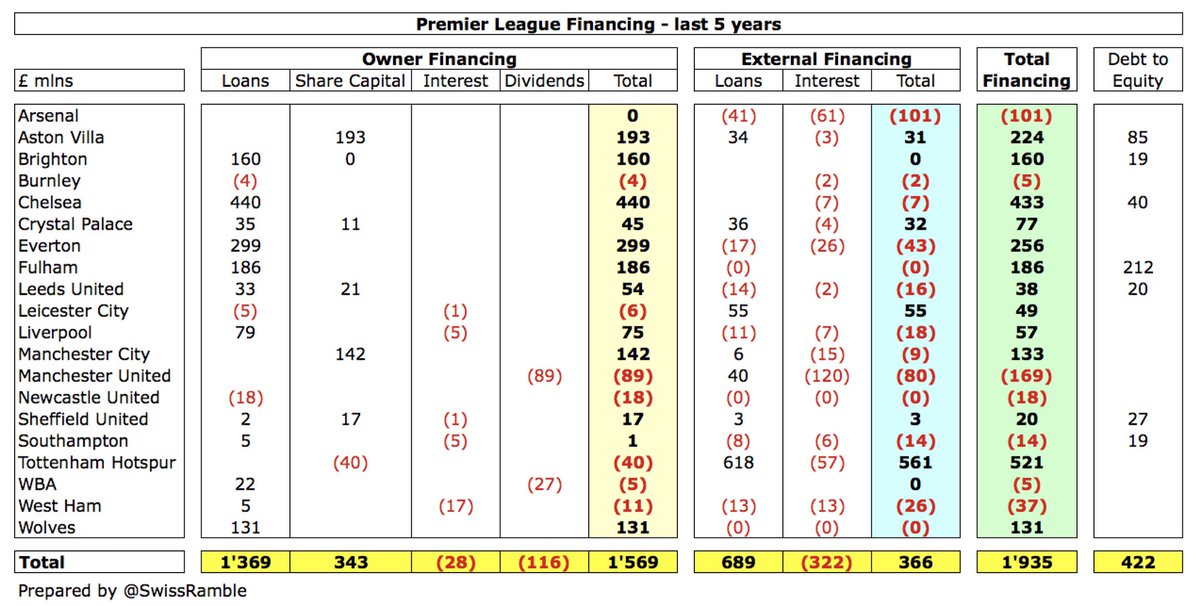
Of course, the debt situation will have worsened since these figures were published due to COVID, as clubs have had to take out additional loans, e.g. #THFC have borrowed £175m at 0.5% from the government, while #MUFC have drawn down £140m of their revolving credit facility.
In any case, the next time you read an article on how much a club owes, it’s not quite a case of “don’t believe what you read”, but you do need to understand what the analysis is actually referring to, because, as we have seen, debt can have many different definitions.
• • •
Missing some Tweet in this thread? You can try to
force a refresh

