#Canadians, political leaders in provinces with Wave 2 #COVID19 epidemics
You MUST act NOW.
#Manitoba and #Quebec are in crisis. #Alberta, #Ontario, #Saskatchewan will be there soon.
This is NOT overreaction. PLEASE read this thread. Please share it. PLEASE ACT.
1/
You MUST act NOW.
#Manitoba and #Quebec are in crisis. #Alberta, #Ontario, #Saskatchewan will be there soon.
This is NOT overreaction. PLEASE read this thread. Please share it. PLEASE ACT.
1/
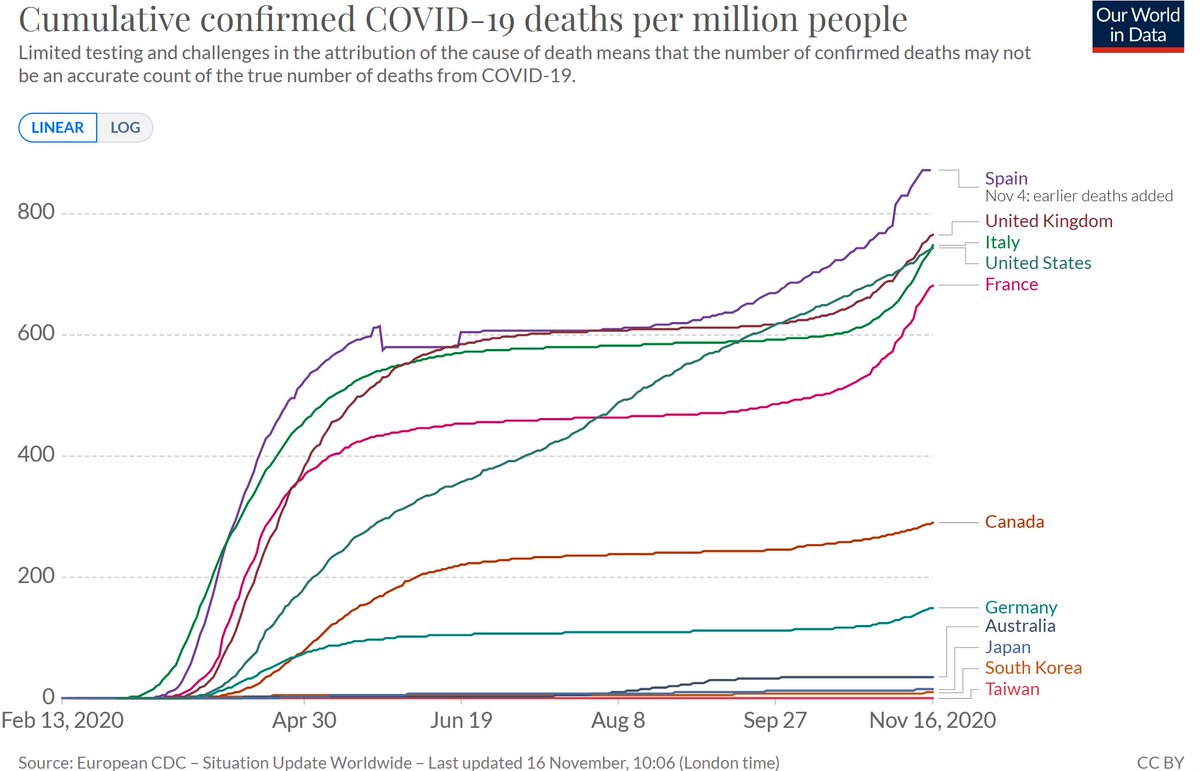
I've been watching per capita DEATHS in #Canada & high income peer countries with pop >20M
Peers: 🇹🇼🇦🇺🇰🇷🇯🇵🇩🇪🇮🇹🇬🇧🇺🇸🇪🇸🇫🇷
Why?
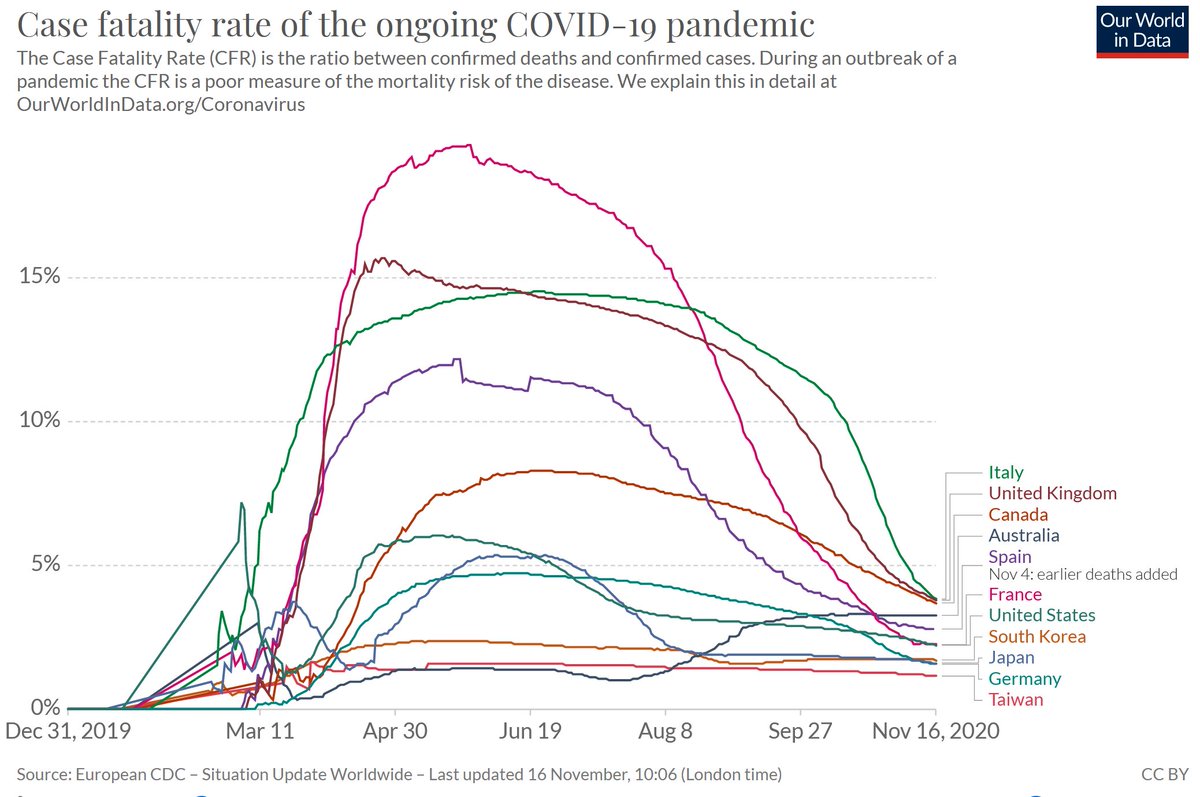
Because #Canadian #COVID19 case fatality rate (% of confirmed cases who die) has remained stubbornly high.
It's the 3rd highest, after 🇮🇹🇺🇸.
Peers: 🇹🇼🇦🇺🇰🇷🇯🇵🇩🇪🇮🇹🇬🇧🇺🇸🇪🇸🇫🇷
Why?
Because #Canadian #COVID19 case fatality rate (% of confirmed cases who die) has remained stubbornly high.
It's the 3rd highest, after 🇮🇹🇺🇸.
We will soon reach the highest case fatality rate among our peer countries & we've barely started Wave 2.
Look at this graph. Watch it every day. #Canada is NOT doing ok
When we get #COVID19 more of us die than in Spain, France, the USA.
Please, please see this and act.
Look at this graph. Watch it every day. #Canada is NOT doing ok
When we get #COVID19 more of us die than in Spain, France, the USA.
Please, please see this and act.
#Canada is at the start of Wave 2 of our #COVID19 epidemic. It's actually only just getting going now.
People typically take 2-4 weeks to die after they are diagnosed.
We should see a big increase in cases, then a big increase in deaths 2-4 wk later.
But Canada look different
People typically take 2-4 weeks to die after they are diagnosed.
We should see a big increase in cases, then a big increase in deaths 2-4 wk later.
But Canada look different
correction. third highest after Italy, UK (not USA)--the American #COVID19 case fatality rate is MUCH better than ours in Canada
In #Canada, our case fatality rate is increasing 5% each week, and this increase has been speeding up every day since November 1.
Most importantly, our #COVID19 deaths are increasing faster than our cases in every province except BC. This is absolutely not normal.
Most importantly, our #COVID19 deaths are increasing faster than our cases in every province except BC. This is absolutely not normal.
Please read the posts with all the graphs in the thread below.
I post these every day now to try to show people & politicians why we need to wake up. They're pinned to my profile.
Please contact your political leaders NOW. Please don't wait for them to make the right decision.
I post these every day now to try to show people & politicians why we need to wake up. They're pinned to my profile.
Please contact your political leaders NOW. Please don't wait for them to make the right decision.
Before I get into the data part of the thread, I want to make one last point.
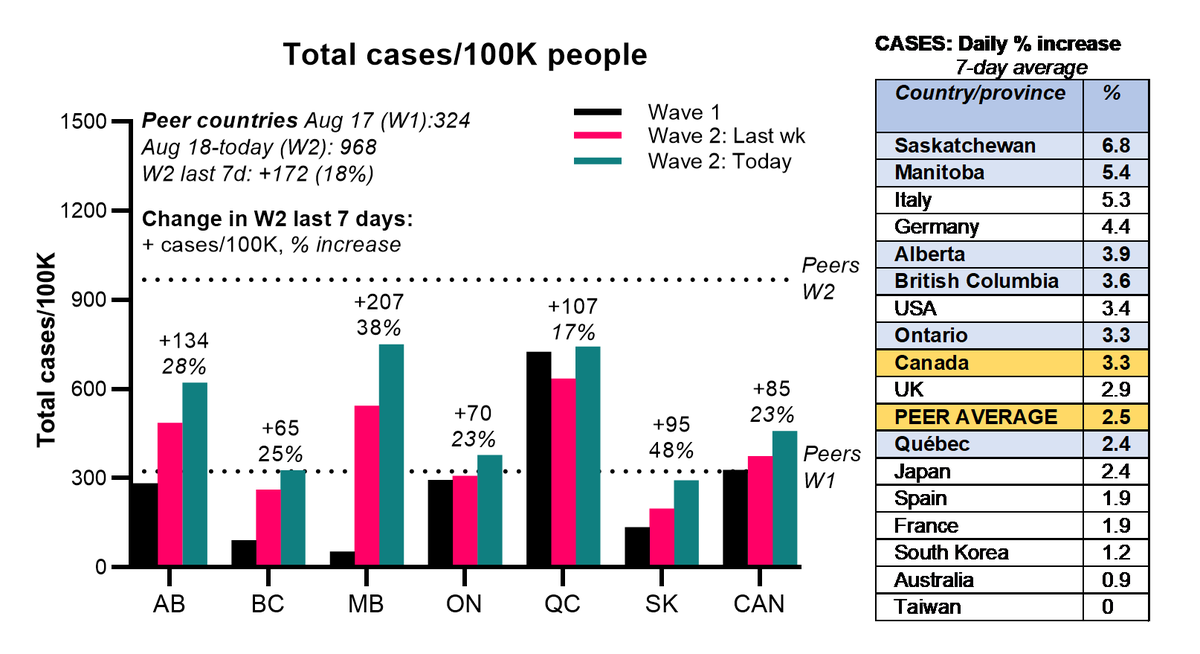
On Friday, @SteiniBrown presented results of the #COVID19 modelling table in Ontario. It was frightening. He said if Ontario's cases continue to grow at 3% daily, we'll look like France in a month.
On Friday, @SteiniBrown presented results of the #COVID19 modelling table in Ontario. It was frightening. He said if Ontario's cases continue to grow at 3% daily, we'll look like France in a month.
This is what deaths in France look like right now.
Daily growth rate as of last night (7 day avg):
Saskatchewan: 7%
Manitoba: 5%
Alberta, BC: 4%
Ontario: 3%
Daily growth rate as of last night (7 day avg):
Saskatchewan: 7%
Manitoba: 5%
Alberta, BC: 4%
Ontario: 3%
ok. here's my regular daily thread. Please, please act.
Nov 16
#COVID19 cases, deaths, case fatality rates
•#Canada, provinces
•Country peers (high income, pop >20M)
•Longterm care, retirement homes
•Weekly, daily % changes (7-day avg)
Thread
Data: @covid_canada @NoLore @RyersonNIA @CIHI_ICIS @OurWorldInData
/1
#COVID19 cases, deaths, case fatality rates
•#Canada, provinces
•Country peers (high income, pop >20M)
•Longterm care, retirement homes
•Weekly, daily % changes (7-day avg)
Thread
Data: @covid_canada @NoLore @RyersonNIA @CIHI_ICIS @OurWorldInData
/1


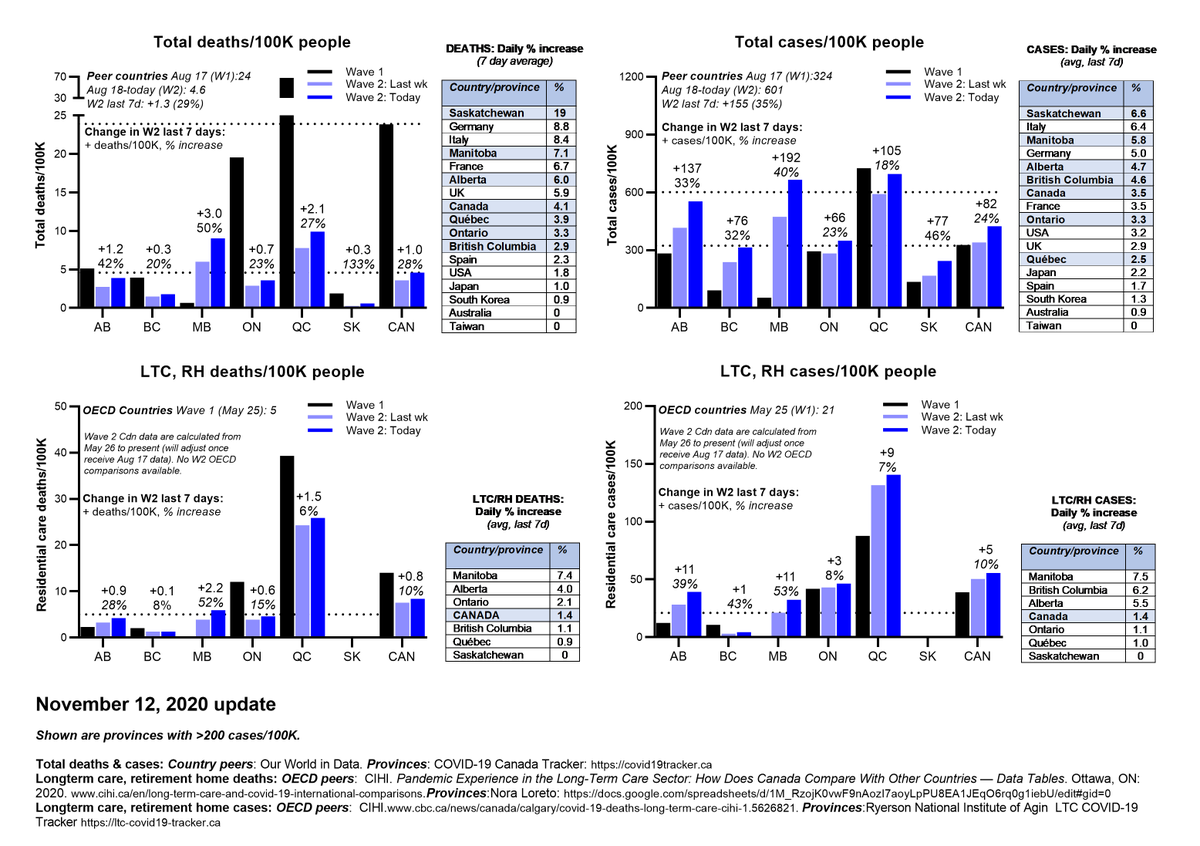
#COVID19 #CANADA Take-home 1
Wave 2 started later in Canada than peer countries BUT
•Deaths ↑ faster than peers (27% wkly)
•Cases ↑ 23% wkly
•Case fatality rate (CFR) ↑ 5.0% wkly
Worst death numbers, in order
•#Manitoba, #Quebec, #Alberta, #Ontario
Wave 2 started later in Canada than peer countries BUT
•Deaths ↑ faster than peers (27% wkly)
•Cases ↑ 23% wkly
•Case fatality rate (CFR) ↑ 5.0% wkly
Worst death numbers, in order
•#Manitoba, #Quebec, #Alberta, #Ontario
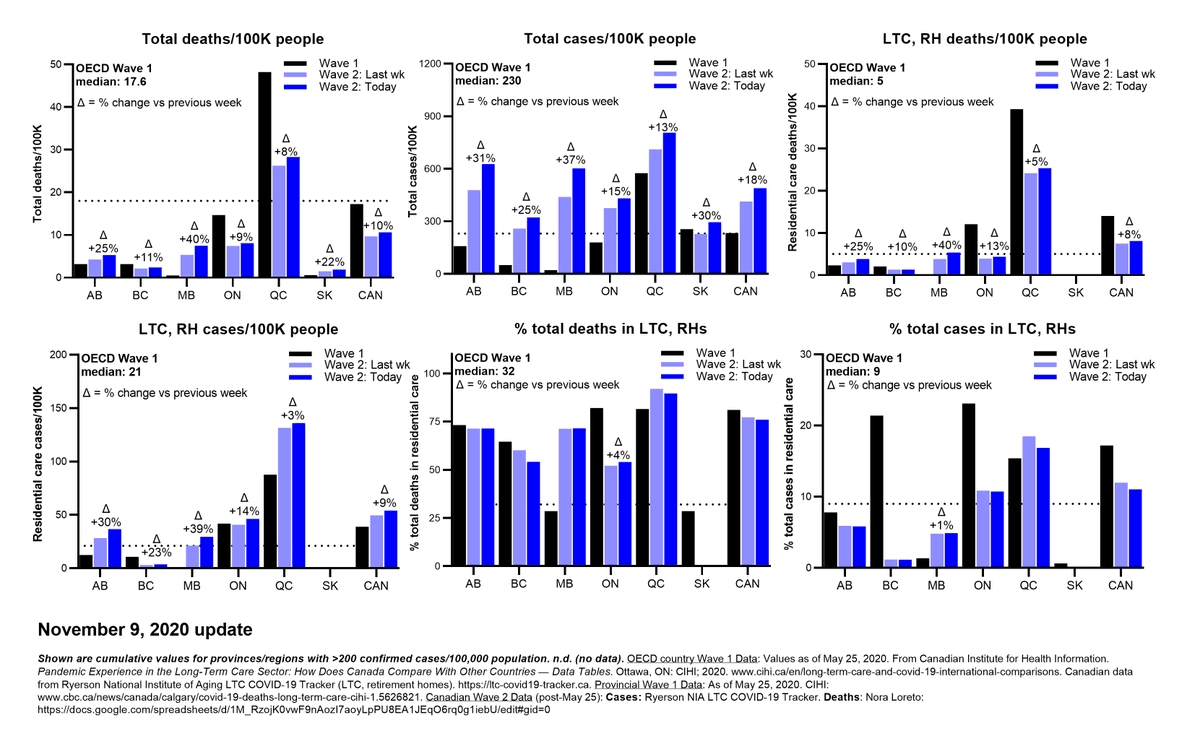
#COVID19 #CANADA Take-home 2
LONGTERM CARE/RETIREMENT HOMES
•Deaths ↑ 11% wkly
•Cases ↑ 10% wkly
Worst death numbers, in order
•#Quebec, #Manitoba, #Ontario, #Alberta
LONGTERM CARE/RETIREMENT HOMES
•Deaths ↑ 11% wkly
•Cases ↑ 10% wkly
Worst death numbers, in order
•#Quebec, #Manitoba, #Ontario, #Alberta
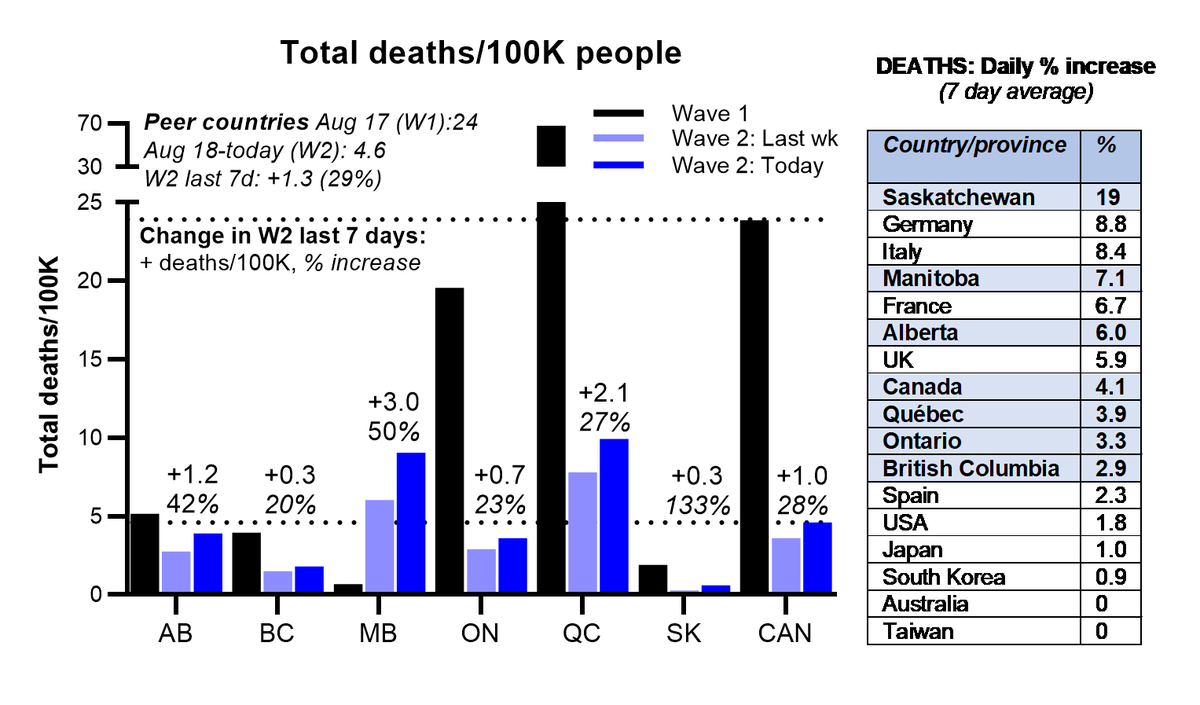
Take-home 3: Countries
#COVID19 DEATHS/100K (+% wkly growth), worst to best
🇪🇸26+19
🇺🇸23+13
🇫🇷21+42
🇮🇹15+64
🇬🇧15+38
#Quebec 11+26
#Manitoba 11+58
PEER AVG 10+26
🇨🇦5+28
🇩🇪4+58
#Alberta 4+32
#Ontario 4+24
#BritishColumbia 2+20
🇦🇺2+0
#Saskatchewan 1+50
🇯🇵1+11
🇰🇷<1+9
🇹🇼0+0
#COVID19 DEATHS/100K (+% wkly growth), worst to best
🇪🇸26+19
🇺🇸23+13
🇫🇷21+42
🇮🇹15+64
🇬🇧15+38
#Quebec 11+26
#Manitoba 11+58
PEER AVG 10+26
🇨🇦5+28
🇩🇪4+58
#Alberta 4+32
#Ontario 4+24
#BritishColumbia 2+20
🇦🇺2+0
#Saskatchewan 1+50
🇯🇵1+11
🇰🇷<1+9
🇹🇼0+0
have to pause for a meeting. will be back in 30 min to continue
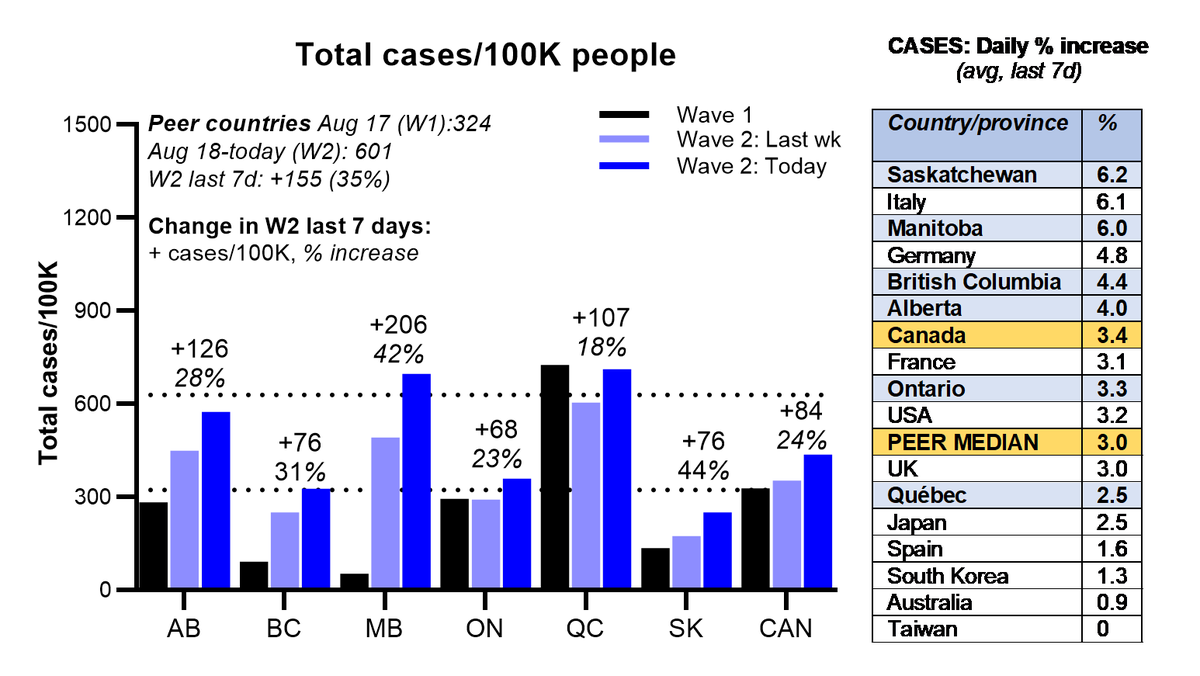
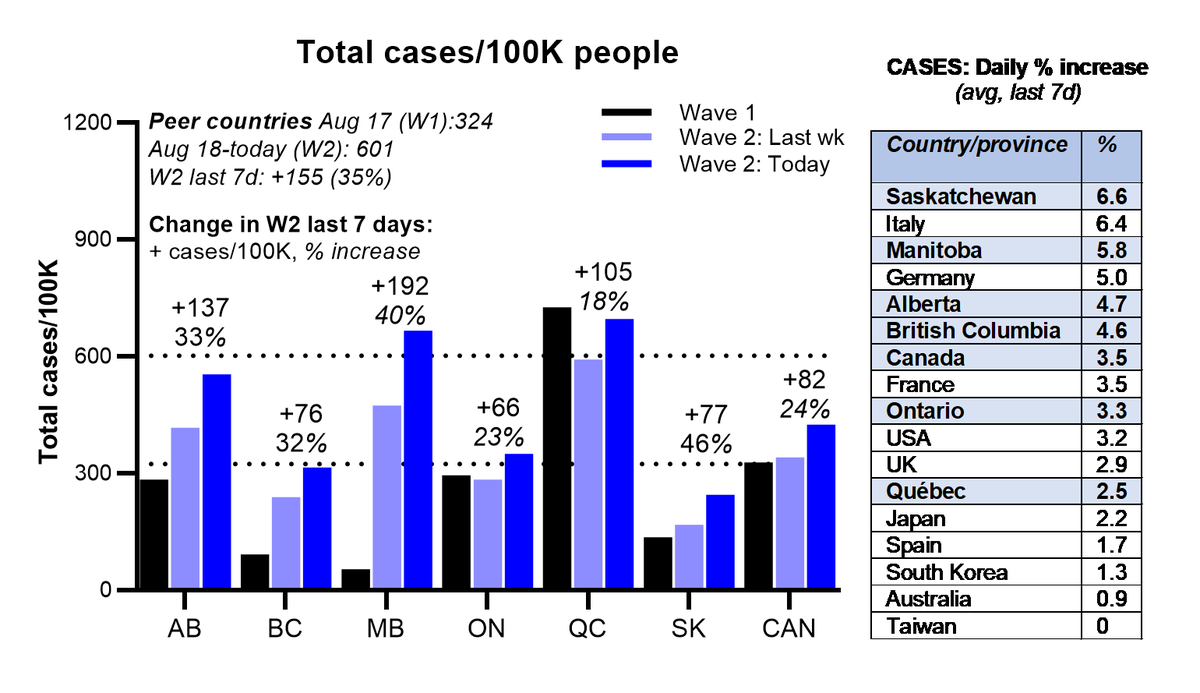
Take-home 4: Countries
#COVID19 CASES/100K (+% wkly growth), worst to best
🇫🇷2660+14
🇪🇸2352+13
🇺🇸1663+24
🇬🇧1511+20
🇮🇹1473+37
PEER AVG 990+18
MB 751+38
QC 743+17
🇩🇪677+31
AB 621+28
🇨🇦459+23
ON 378+23
BC 327+25
SK 293+48
🇯🇵49+17
🇰🇷26+8
🇦🇺18+6
🇹🇼1+0
#COVID19 CASES/100K (+% wkly growth), worst to best
🇫🇷2660+14
🇪🇸2352+13
🇺🇸1663+24
🇬🇧1511+20
🇮🇹1473+37
PEER AVG 990+18
MB 751+38
QC 743+17
🇩🇪677+31
AB 621+28
🇨🇦459+23
ON 378+23
BC 327+25
SK 293+48
🇯🇵49+17
🇰🇷26+8
🇦🇺18+6
🇹🇼1+0
Sorry. I'm rushing. Here are the graphs to go with the per capita deaths and cases/100K, together with the daily % increases in both.

Take-home 5: Countries
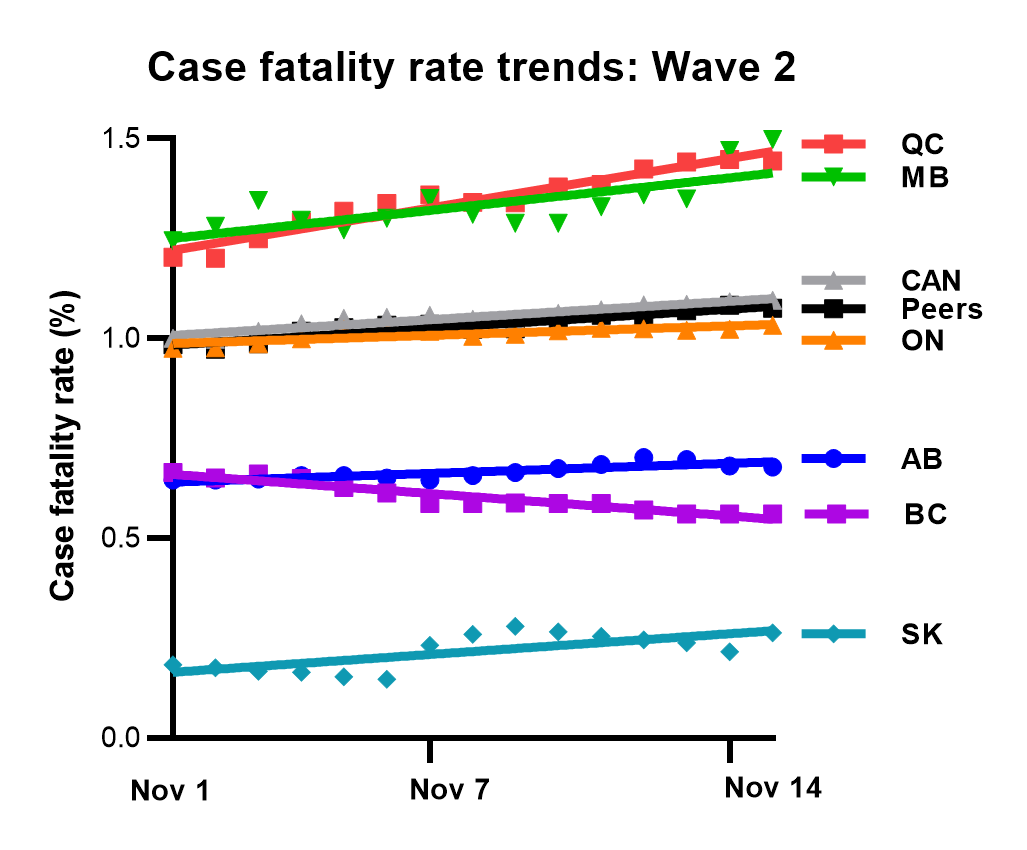
#COVID19 CFR (+% wkly growth), worst to best
#Manitoba 1.5+14
#Quebec 1.4+8
🇰🇷1.4+<1
🇺🇸1.4+<1
🇯🇵1.3+<1
PEER AVG 1.1+7
#CANADA 1.1+5
🇪🇸1.1+5
🇮🇹1.0+19
🇬🇧1.0+15
#Ontario 1.0+3
🇫🇷0.8+25
#Alberta 0.7+3
🇩🇪0.6+21
#BritishColumbia 0.6+<1
#Saskatchewan 0.3+2
#COVID19 CFR (+% wkly growth), worst to best
#Manitoba 1.5+14
#Quebec 1.4+8
🇰🇷1.4+<1
🇺🇸1.4+<1
🇯🇵1.3+<1
PEER AVG 1.1+7
#CANADA 1.1+5
🇪🇸1.1+5
🇮🇹1.0+19
🇬🇧1.0+15
#Ontario 1.0+3
🇫🇷0.8+25
#Alberta 0.7+3
🇩🇪0.6+21
#BritishColumbia 0.6+<1
#Saskatchewan 0.3+2

Change in CFR over last 2 weeks in affected Canadian provinces plus avg change in CFR for our peer countries

Take-home 6: #COVID19 case fatality rates (CFR)
CFR already ↑ in #Canada, everywhere except BC
We shouldn’t see this ↑ so soon in Wave 2, when cases should ↑ faster than deaths
Wave 2 likely spreading quickly to more vulnerable people, including LTC/RHs
CFR already ↑ in #Canada, everywhere except BC
We shouldn’t see this ↑ so soon in Wave 2, when cases should ↑ faster than deaths
Wave 2 likely spreading quickly to more vulnerable people, including LTC/RHs
Take-home 7: Longterm care, retirement homes
#COVID19 DEATHS/100K (+% wkly growth), worst to best
QC 27+7
#Canada (Wave 1): 14
Canada (Wave 2): 9+11
MB 7+62
ON 5+17
AB 5+25
OECD countries (Wave 1): 5
BC 1+8
SK 0+0
Note: LTC/RH Wave 2 data start May 26, not Aug 18.
#COVID19 DEATHS/100K (+% wkly growth), worst to best
QC 27+7
#Canada (Wave 1): 14
Canada (Wave 2): 9+11
MB 7+62
ON 5+17
AB 5+25
OECD countries (Wave 1): 5
BC 1+8
SK 0+0
Note: LTC/RH Wave 2 data start May 26, not Aug 18.

Take-home 8: Longterm care, retirement homes
#COVID19 CASES/100K (+% wkly growth), worst to best
QC 144+6
Canada (Wave 2): 58+10
ON 49+14
AB 42+15
MB 41+39
#Canada (Wave 1): 14
BC 5+31
OECD countries (Wave 1): 5
SK <1+0
Note: for LTC/RH Wave 2 starts May 26
#COVID19 CASES/100K (+% wkly growth), worst to best
QC 144+6
Canada (Wave 2): 58+10
ON 49+14
AB 42+15
MB 41+39
#Canada (Wave 1): 14
BC 5+31
OECD countries (Wave 1): 5
SK <1+0
Note: for LTC/RH Wave 2 starts May 26

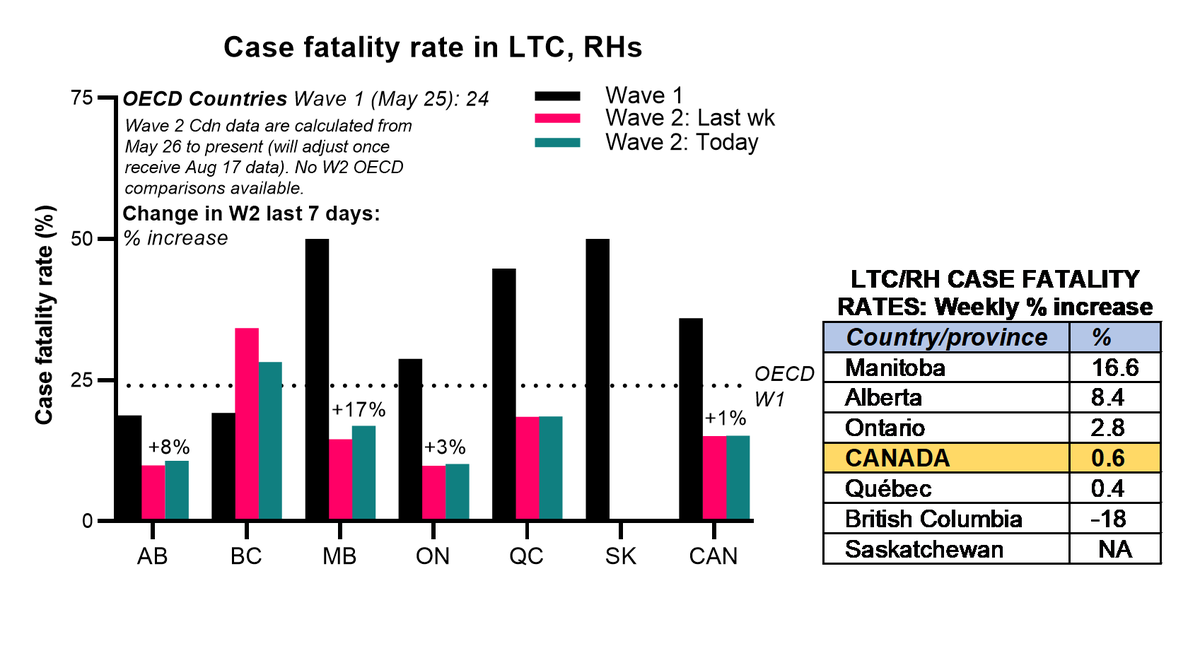
Take-home 9: Longterm care, retirement homes
#COVID19 CFR (+% wkly growth), worst to best
BC 28+<1
QC 19+<1
MB 17+17
Canada (Wave 2): 15+<1
#Canada (Wave 1): 14
AB 11+8
ON 10+3
OECD countries (Wave 1): 5
SK 0+<1
Note: for LTC/RH Wave 2 starts May 26
#COVID19 CFR (+% wkly growth), worst to best
BC 28+<1
QC 19+<1
MB 17+17
Canada (Wave 2): 15+<1
#Canada (Wave 1): 14
AB 11+8
ON 10+3
OECD countries (Wave 1): 5
SK 0+<1
Note: for LTC/RH Wave 2 starts May 26
Take-home 10: What #Canadians must do NOW
•Stay home except for essential activities
•Socialize only with ppl under same roof
•Mask indoors (except at home)
•Mask outdoors within 2m of others
•Follow LOCAL public health guidance
•Install #COVID19 Alert app
•Stay home except for essential activities
•Socialize only with ppl under same roof
•Mask indoors (except at home)
•Mask outdoors within 2m of others
•Follow LOCAL public health guidance
•Install #COVID19 Alert app
List of #Canadian #COVID19 LTC/RH deaths fr @NoLore
docs.google.com/spreadsheets/d…
Cdn LTC/RH cases, deaths @RyersonNIA Longterm Care COVID-19 Tracker
ltc-covid19-tracker.ca
Contact municipal, provincial, territorial and national leaders to advocate for the most vulnerable.
/fin
docs.google.com/spreadsheets/d…
Cdn LTC/RH cases, deaths @RyersonNIA Longterm Care COVID-19 Tracker
ltc-covid19-tracker.ca
Contact municipal, provincial, territorial and national leaders to advocate for the most vulnerable.
/fin
I have to get back to my regular work, but will check back in tonight.
Here are ppl who post daily about deaths in LTC/RHs. Pls consider amplifying their posts.
@NathanStall @DrSamirSinha @Sue_Innovates @IacovosMichael @Billius27 @picardonhealth
Plus twitter.com/i/lists/132265…
Here are ppl who post daily about deaths in LTC/RHs. Pls consider amplifying their posts.
@NathanStall @DrSamirSinha @Sue_Innovates @IacovosMichael @Billius27 @picardonhealth
Plus twitter.com/i/lists/132265…
I'm trying to add more names to this list, but can't keep up and am spending too much time on these data to amplify others. Please tag me about anyone who needs to be on this list, ESPECIALLY in Manitoba, Quebec, Alberta, Saskatchewan.
Here is my public twitter list for people to follow about #COVID19 in #Quebec
twitter.com/i/lists/132785…
twitter.com/i/lists/132785…
Here's my public twitter list for people to follow about #COVID19 in #Manitoba. It's still incomplete and I'll be trying to finish it tonight.
In coming days I'll build lists for #Alberta #Saskatchewan #BritishColumbia.
twitter.com/i/lists/132673…
In coming days I'll build lists for #Alberta #Saskatchewan #BritishColumbia.
twitter.com/i/lists/132673…
• • •
Missing some Tweet in this thread? You can try to
force a refresh