Nov 13 update
#COVID19 cases, deaths
•#Canada, provinces
•Comparison to country peers (high income, pop >20M)
•Longterm care, retirement homes
•Weekly, daily % changes (7-day avg)
See thread
Data: @covid_canada @NoLore @RyersonNIA @CIHI_ICIS @OurWorldInData
/1
#COVID19 cases, deaths
•#Canada, provinces
•Comparison to country peers (high income, pop >20M)
•Longterm care, retirement homes
•Weekly, daily % changes (7-day avg)
See thread
Data: @covid_canada @NoLore @RyersonNIA @CIHI_ICIS @OurWorldInData
/1

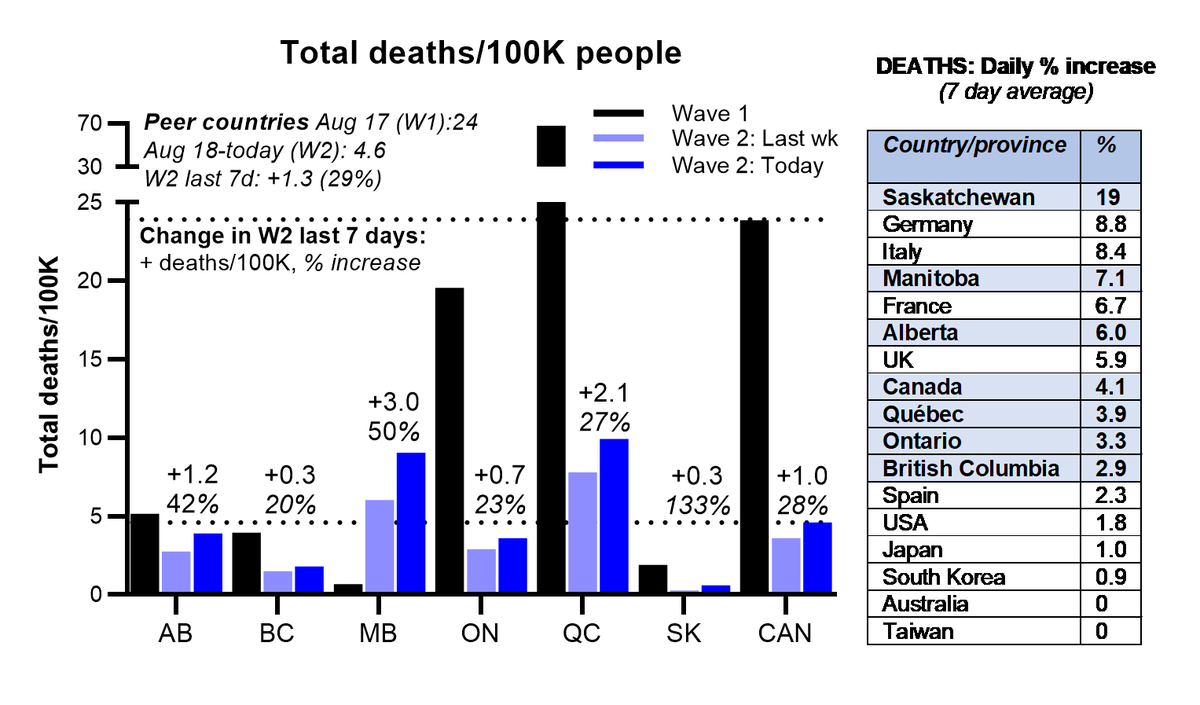
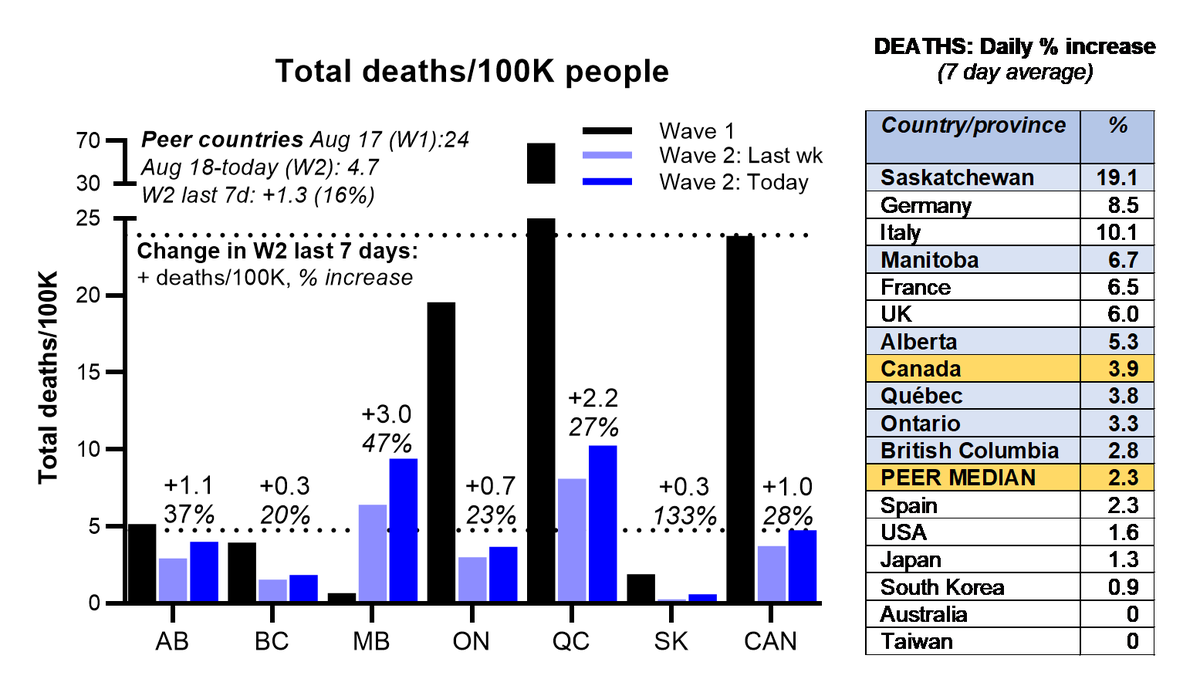
#COVID19 DEATHS/100K (+% daily growth rate)
🇪🇸25+2%
🇺🇸22+2%
🇫🇷19+7%
🇮🇹14+10%
🇬🇧14+6%
QC 10+4%
MB 9+7%
🇨🇦5+4%
🇩🇪4+9%
AB 4+5%
ON 4+3%
BC 2+3%
🇦🇺2+0%
SK 1+19%
🇯🇵1+1%
🇰🇷<1+1%
🇹🇼0+0%
/2
🇪🇸25+2%
🇺🇸22+2%
🇫🇷19+7%
🇮🇹14+10%
🇬🇧14+6%
QC 10+4%
MB 9+7%
🇨🇦5+4%
🇩🇪4+9%
AB 4+5%
ON 4+3%
BC 2+3%
🇦🇺2+0%
SK 1+19%
🇯🇵1+1%
🇰🇷<1+1%
🇹🇼0+0%
/2

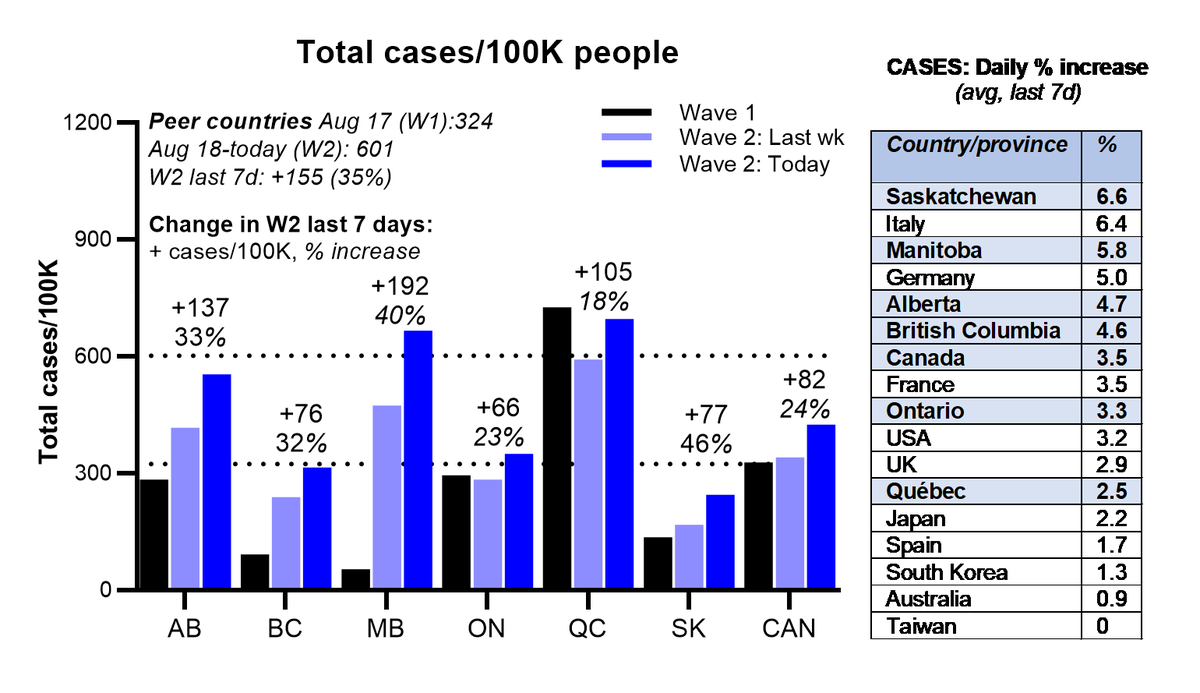
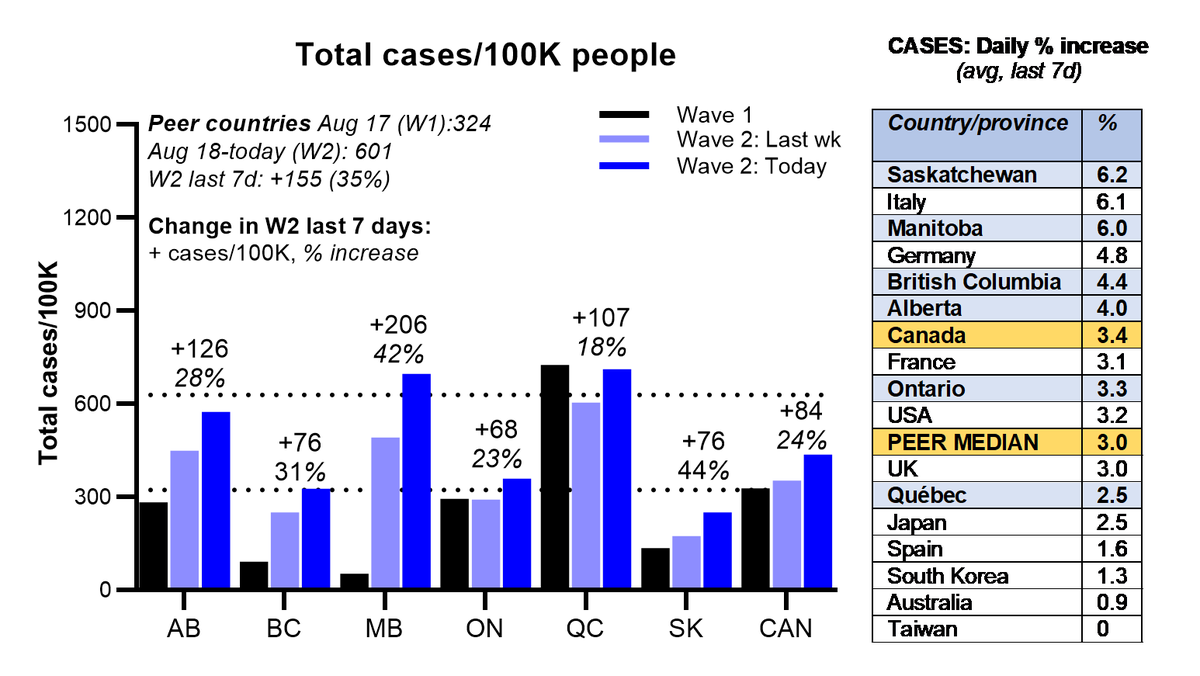
#COVID19 CASES/100K (+% daily growth rate)
🇫🇷2574+3%
🇪🇸2306+2%
🇺🇸1557+3%
🇬🇧1432+3%
🇮🇹1344+6%
QC 711+3%
MB 697+6%
🇩🇪629+5%
AB 575+4%
🇨🇦437+3%
ON 359+3%
BC 327+4%
SK 251+6%
🇯🇵47+3%
🇰🇷25+1%
🇦🇺17+1%
🇹🇼1+0%
/3
🇫🇷2574+3%
🇪🇸2306+2%
🇺🇸1557+3%
🇬🇧1432+3%
🇮🇹1344+6%
QC 711+3%
MB 697+6%
🇩🇪629+5%
AB 575+4%
🇨🇦437+3%
ON 359+3%
BC 327+4%
SK 251+6%
🇯🇵47+3%
🇰🇷25+1%
🇦🇺17+1%
🇹🇼1+0%
/3
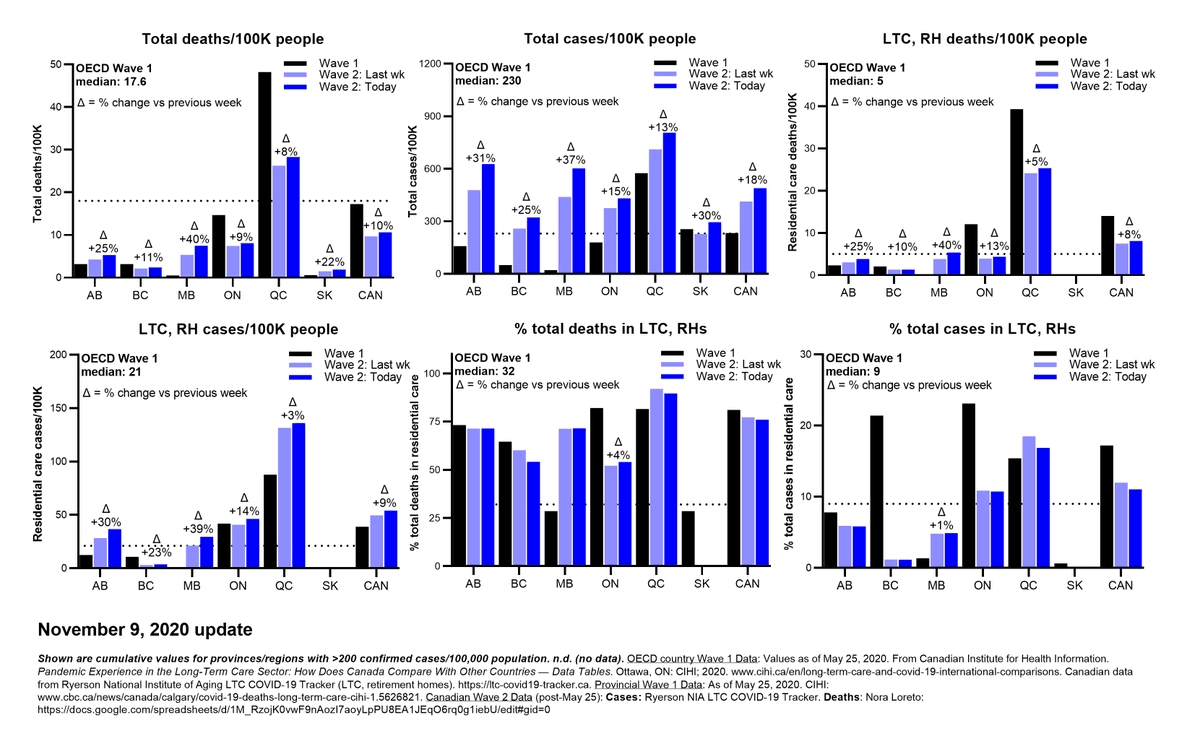
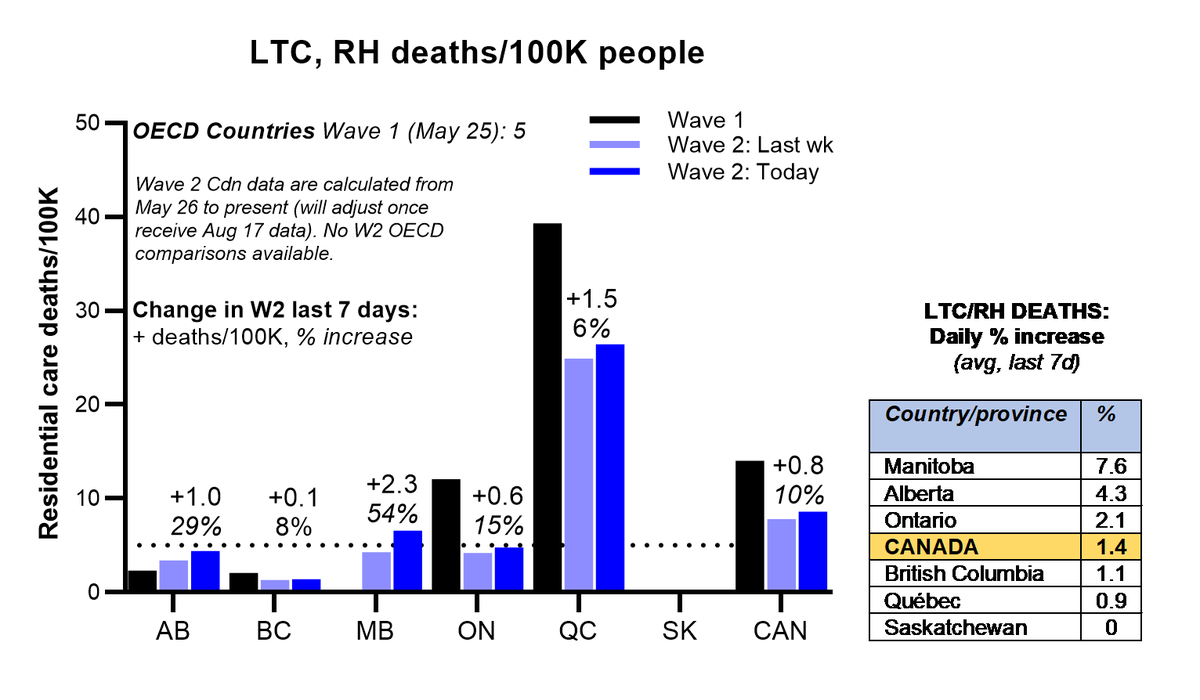
#COVID19 DEATHS/100K (+% daily growth rate): Longterm care, retirement homes
QC 26+1%
🇨🇦(Wave 1): 14
🇨🇦(Wave 2): 9+1%
MB 7+8%
OECD countries (Wave 1): 5
ON 5+2%
AB 4+4%
BC 1+1%
SK 0
Note: for LTC/RH data, Wave 2 starts May 26 (awaiting Aug 18 data to adjust)
/4
QC 26+1%
🇨🇦(Wave 1): 14
🇨🇦(Wave 2): 9+1%
MB 7+8%
OECD countries (Wave 1): 5
ON 5+2%
AB 4+4%
BC 1+1%
SK 0
Note: for LTC/RH data, Wave 2 starts May 26 (awaiting Aug 18 data to adjust)
/4

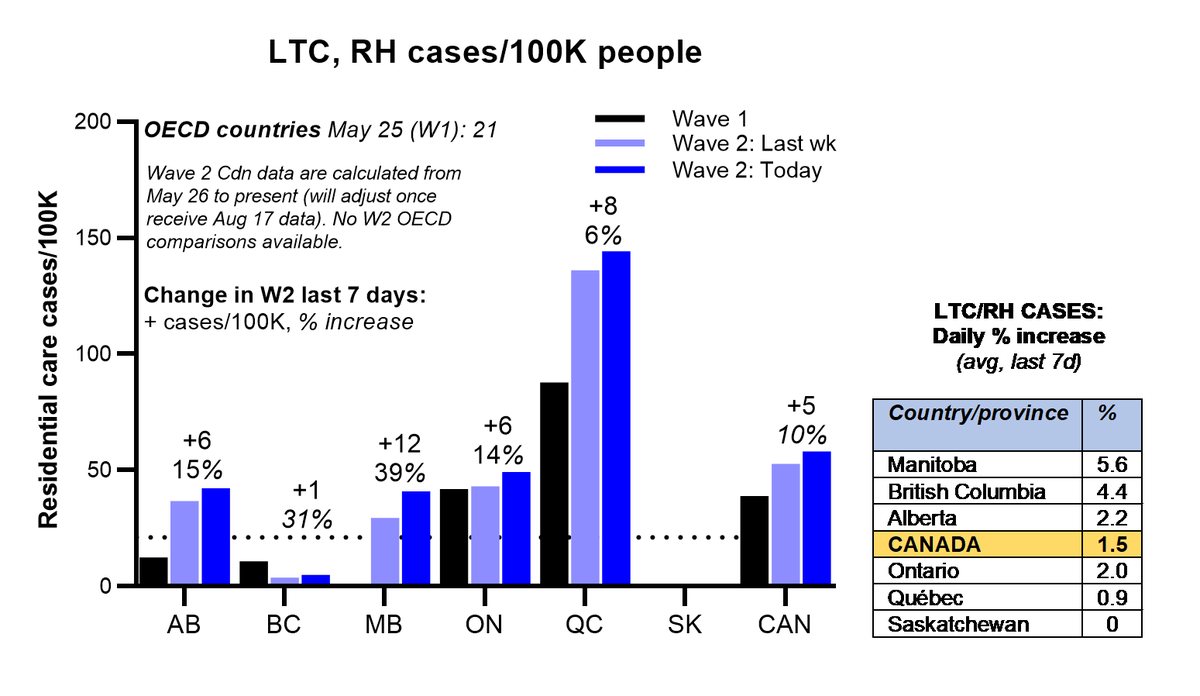
#COVID19 CASES/100K (+% daily growth rate): Longterm care, retirement homes
QC 144+1%
🇨🇦(Wave 2): 58+2
ON 49+2%
AB 42+2%
MB 41+6%
🇨🇦(Wave 1): 39
OECD countries (Wave 1): 21
BC 5+4%
SK <1+0%
Note: for LTC/RH data, Wave 2 starts May 26 (awaiting Aug 18 data to adjust)
/5
QC 144+1%
🇨🇦(Wave 2): 58+2
ON 49+2%
AB 42+2%
MB 41+6%
🇨🇦(Wave 1): 39
OECD countries (Wave 1): 21
BC 5+4%
SK <1+0%
Note: for LTC/RH data, Wave 2 starts May 26 (awaiting Aug 18 data to adjust)
/5
Comprehensive public list of #Canadian #COVID19 LTC/RH deaths from @NoLore
docs.google.com/spreadsheets/d…
🇨🇦LTC/RH cases % deaths @RyersonNIA LTC COVID-19 Tracker
ltc-covid19-tracker.ca
Pls tell municipal, provincial, territorial & national leaders that elder lives matter.
/6
docs.google.com/spreadsheets/d…
🇨🇦LTC/RH cases % deaths @RyersonNIA LTC COVID-19 Tracker
ltc-covid19-tracker.ca
Pls tell municipal, provincial, territorial & national leaders that elder lives matter.
/6
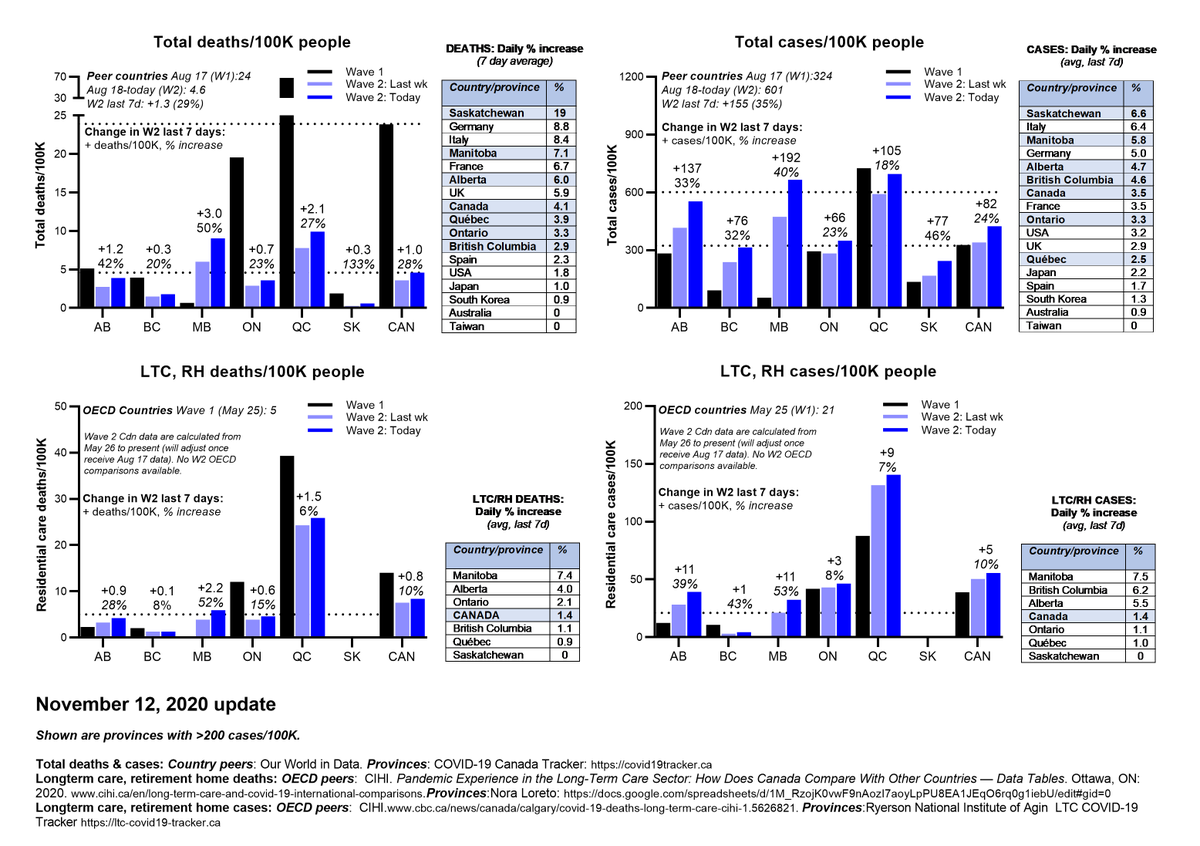
Key take-home message #1
Total #Canadian Wave 2 #COVID19 DEATHS in the last 7 days have increased by:
133% SK
47% MB
37% AB
28% #Canada
27% QC
23% ON
20% BC
Please follow all public health measures and leave home only for work, school and essential activities.
/7
Total #Canadian Wave 2 #COVID19 DEATHS in the last 7 days have increased by:
133% SK
47% MB
37% AB
28% #Canada
27% QC
23% ON
20% BC
Please follow all public health measures and leave home only for work, school and essential activities.
/7

Key take-home message #2
Total #Canadian Wave 2 #COVID19 DEATHS in the last 7 days in LONGTERM CARE AND RETIREMENT HOMES have increased by:
53% MB
30% AB
15% ON
10% #Canada
8% BC
6% QC
0% SK
Please protect the most vulnerable and leave home only for essential activities.
/8
Total #Canadian Wave 2 #COVID19 DEATHS in the last 7 days in LONGTERM CARE AND RETIREMENT HOMES have increased by:
53% MB
30% AB
15% ON
10% #Canada
8% BC
6% QC
0% SK
Please protect the most vulnerable and leave home only for essential activities.
/8

Key take-home message #3: QUÉBEC
#Canadian scientists, clinicians, experts, everyone
Québecois(es) need expert voices to promote better #COVID19 political decision making in #Quebec, in both English and French
Why?
Sub-thread…
/9 #COVID19Qc #qcpoli
#Canadian scientists, clinicians, experts, everyone
Québecois(es) need expert voices to promote better #COVID19 political decision making in #Quebec, in both English and French
Why?
Sub-thread…
/9 #COVID19Qc #qcpoli
Key take-home message #3a: #QUÉBEC #COVID19
Per capita DEATHS:
1.2X higher than Canadian avg
2.Nearly as high as Italy & UK, even though QC Wave 2 started 1 month later
3.Growing faster daily (4%!) than cases (3%!)
4.Increasing 27% each week (!)
/9a #COVID19Qc #qcpoli
Per capita DEATHS:
1.2X higher than Canadian avg
2.Nearly as high as Italy & UK, even though QC Wave 2 started 1 month later
3.Growing faster daily (4%!) than cases (3%!)
4.Increasing 27% each week (!)
/9a #COVID19Qc #qcpoli
Key take-home message #3b: #QUÉBEC #COVID19
Per capita CASES:
1.1.6X higher than Canadian avg
2.Growing 3% daily (!), 18% weekly (!)
At this growth rate QC will soon eclipse epidemics in European countries that have already locked down.
/9b #COVID19Qc #qcpoli
Per capita CASES:
1.1.6X higher than Canadian avg
2.Growing 3% daily (!), 18% weekly (!)
At this growth rate QC will soon eclipse epidemics in European countries that have already locked down.
/9b #COVID19Qc #qcpoli

Key take-home message #3c: #QUÉBEC #COVID19
Per capita DEATHS Longterm Care, Retirement Homes
1.3X higher than Cdn Wave 2 (W2) avg
2.5X higher in W2 than W1 avg in OECD countries
3.Already two-thirds of QC W1
4.Growing 1% daily, 6% weekly
/9c #COVID19Qc #qcpoli
Per capita DEATHS Longterm Care, Retirement Homes
1.3X higher than Cdn Wave 2 (W2) avg
2.5X higher in W2 than W1 avg in OECD countries
3.Already two-thirds of QC W1
4.Growing 1% daily, 6% weekly
/9c #COVID19Qc #qcpoli

Key take-home message #3d: #QUÉBEC #COVID19
Per capita CASES Longterm Care, Retirement Homes
1.2.5X higher than Cdn Wave 2 (W2) avg
2.Already 7X higher in W2 than W1 avg in OECD countries
3.1.6X higher than QC W1
4.Growing 1% daily, 6% weekly
/9d #COVID19Qc #qcpoli
Per capita CASES Longterm Care, Retirement Homes
1.2.5X higher than Cdn Wave 2 (W2) avg
2.Already 7X higher in W2 than W1 avg in OECD countries
3.1.6X higher than QC W1
4.Growing 1% daily, 6% weekly
/9d #COVID19Qc #qcpoli

Key take-home message #4: MANITOBA
#Canadian scientists, clinicians, experts, everyone
Manitobans need expert voices to promote better #COVID19 political decision making in #Manitoba
Why?
Sub-thread…
/10 #COVID19Mb #mbpoli
#Canadian scientists, clinicians, experts, everyone
Manitobans need expert voices to promote better #COVID19 political decision making in #Manitoba
Why?
Sub-thread…
/10 #COVID19Mb #mbpoli
Take-home message #4a: #MANITOBA #COVID19
Per capita DEATHS
1.2X higher than Cdn avg
2.Nearly high as Italy, UK, though MB Wave 2 started 1 month later
3.Growing faster daily (7%!) than cases (6%!): NOT GOOD
4.Increasing 47% each wk (!)
/10a #COVID19Mb #mbpoli
Per capita DEATHS
1.2X higher than Cdn avg
2.Nearly high as Italy, UK, though MB Wave 2 started 1 month later
3.Growing faster daily (7%!) than cases (6%!): NOT GOOD
4.Increasing 47% each wk (!)
/10a #COVID19Mb #mbpoli

Key take-home message #4b: #MANITOBA #COVID19
Per capita CASES
1.1.6X higher than Canadian avg
2.Growing 6% daily (!), 42% weekly (!)
At this growth rate MB will soon eclipse epidemics in European countries that have already locked down.
/10b #COVID19Mb #mbpoli
Per capita CASES
1.1.6X higher than Canadian avg
2.Growing 6% daily (!), 42% weekly (!)
At this growth rate MB will soon eclipse epidemics in European countries that have already locked down.
/10b #COVID19Mb #mbpoli

Key take-home message #4c: #MANITOBA #COVID19
Per capita DEATHS: Longterm Care, Retirement Homes
1.Already greater than Wave 1 avg in OECD countries
2.Growing 8% daily, 53% weekly (!!!!!)
3.Growing more than 5 X faster than Canadian Wave 2 avg
/10c #COVID19Mb #mbpoli
Per capita DEATHS: Longterm Care, Retirement Homes
1.Already greater than Wave 1 avg in OECD countries
2.Growing 8% daily, 53% weekly (!!!!!)
3.Growing more than 5 X faster than Canadian Wave 2 avg
/10c #COVID19Mb #mbpoli
Key take-home message #4d: #MANITOBA #COVID19
Per capita CASES: Longterm Care, Retirement Homes
1.Already 7X higher than as Wave 1 avg in OECD countries
2.Growing 6% daily, 39% weekly (!!!!!)
3.Growing 4X faster than Canadian Wave 2 avg
/10d #COVID19Mb #mbpoli
Per capita CASES: Longterm Care, Retirement Homes
1.Already 7X higher than as Wave 1 avg in OECD countries
2.Growing 6% daily, 39% weekly (!!!!!)
3.Growing 4X faster than Canadian Wave 2 avg
/10d #COVID19Mb #mbpoli

Key take-home message #5: ALBERTA
#Canadian scientists, clinicians, experts, everyone
Albertans need expert voices to promote better #COVID19 political decision making in #Alberta
Why?
Sub-thread…
/11 #COVID19AB #abpoli
#Canadian scientists, clinicians, experts, everyone
Albertans need expert voices to promote better #COVID19 political decision making in #Alberta
Why?
Sub-thread…
/11 #COVID19AB #abpoli
Key take-home message #5a: #ALBERTA #COVID19
Per capita DEATHS:
1.Higher than Germany, even though AB Wave 2 started 1 month later
2.Growing faster daily (5%!) than cases (4%!): NOT GOOD
3.Increasing 37% each week (!)
/11a #COVID19AB #abpoli
Per capita DEATHS:
1.Higher than Germany, even though AB Wave 2 started 1 month later
2.Growing faster daily (5%!) than cases (4%!): NOT GOOD
3.Increasing 37% each week (!)
/11a #COVID19AB #abpoli

Key take-home message #5b: #ALBERTA #COVID19
Per capita CASES:
1.1.6X higher than Canadian avg
2.Growing 4% daily (!), 28% weekly (!)
At this growth rate AB will soon eclipse epidemics in European countries that have already locked down.
/11b #COVID19AB #abpoli
Per capita CASES:
1.1.6X higher than Canadian avg
2.Growing 4% daily (!), 28% weekly (!)
At this growth rate AB will soon eclipse epidemics in European countries that have already locked down.
/11b #COVID19AB #abpoli

Key take-home message #5c: #ALBERTA #COVID19
Per capita DEATHS: Longterm Care, Retirement Homes
1.Nearly at Wave 1 avg in OECD countries
2.Growing 4% daily, 30% weekly (!!!!!)
3.Growing 3X faster than Canadian Wave 2 avg
/11c #COVID19AB #abpoli
Per capita DEATHS: Longterm Care, Retirement Homes
1.Nearly at Wave 1 avg in OECD countries
2.Growing 4% daily, 30% weekly (!!!!!)
3.Growing 3X faster than Canadian Wave 2 avg
/11c #COVID19AB #abpoli

Key take-home message #5d: #ALBERTA #COVID19
Per capita CASES: Longterm Care, Retirement Homes
1.Already 2X higher than as Wave 1 avg in OECD countries
2.Growing 2% daily, 15% weekly (!)
3.Growing 1.5X faster than Canadian Wave 2 avg
/11d #COVID19AB #abpoli
Per capita CASES: Longterm Care, Retirement Homes
1.Already 2X higher than as Wave 1 avg in OECD countries
2.Growing 2% daily, 15% weekly (!)
3.Growing 1.5X faster than Canadian Wave 2 avg
/11d #COVID19AB #abpoli

Key take-home message #6: ONTARIO
#Canadian scientists, clinicians, experts, everyone
Ontarians need us to promote better #COVID19 political decision making in #Ontario
Why?
Sub-thread…
/12 #COVID19ON #onpoli
#Canadian scientists, clinicians, experts, everyone
Ontarians need us to promote better #COVID19 political decision making in #Ontario
Why?
Sub-thread…
/12 #COVID19ON #onpoli
Key take-home message #6a: #ONTARIO #COVID19
Per capita DEATHS:
1.Higher than Germany, even though ON Wave 2 started 1 month later
2.Growing daily as fast (3%!) as cases (3%!): NOT GOOD
3.Increasing 23% each week (!)
/12a #COVID19ON #onpoli
Per capita DEATHS:
1.Higher than Germany, even though ON Wave 2 started 1 month later
2.Growing daily as fast (3%!) as cases (3%!): NOT GOOD
3.Increasing 23% each week (!)
/12a #COVID19ON #onpoli

Key take-home message #6b: #ONTARIO #COVID19
Per capita CASES:
•Growing 3% daily (!), 23% weekly (!)
At this growth rate ON will soon eclipse epidemics in European countries that have already locked down.
/12b #COVID19ON #onpoli
Per capita CASES:
•Growing 3% daily (!), 23% weekly (!)
At this growth rate ON will soon eclipse epidemics in European countries that have already locked down.
/12b #COVID19ON #onpoli

Key take-home message #6c: #ONTARIO #COVID19
Per capita DEATHS: Longterm Care, Retirement Homes
1.Already same as Wave 1 avg in OECD countries
2.Growing 2% daily, 15% weekly (!!!!!)
3.Growing nearly 50% faster than Canadian Wave 2 avg
/12c #COVID19ON #onpoli
Per capita DEATHS: Longterm Care, Retirement Homes
1.Already same as Wave 1 avg in OECD countries
2.Growing 2% daily, 15% weekly (!!!!!)
3.Growing nearly 50% faster than Canadian Wave 2 avg
/12c #COVID19ON #onpoli

Key take-home message #6d: #ONTARIO #COVID19
Per capita CASES: Longterm Care, Retirement Homes
1.Already 2.5X higher than as Wave 1 avg in OECD countries
2.Growing 2% daily, 14% weekly (!)
3.Growing 50% faster than Canadian Wave 2 avg
/12d #COVID19ON #onpoli
Per capita CASES: Longterm Care, Retirement Homes
1.Already 2.5X higher than as Wave 1 avg in OECD countries
2.Growing 2% daily, 14% weekly (!)
3.Growing 50% faster than Canadian Wave 2 avg
/12d #COVID19ON #onpoli

Key take-home message #7: BRITISH COLUMBIA
#Canadian scientists, clinicians, experts, everyone
Please keep your eyes on #COVID19 in #BC, follow public health measures, and stay home except for essential activities.
Why?
Sub-thread…
/13 #COVID19BC #bcpoli
#Canadian scientists, clinicians, experts, everyone
Please keep your eyes on #COVID19 in #BC, follow public health measures, and stay home except for essential activities.
Why?
Sub-thread…
/13 #COVID19BC #bcpoli
Key take-home message #7a: #BC #COVID19
•Per capita DEATHS: Increasing 3% daily, 20% weekly (!)
•Per capita CASES: Increasing 4% daily, 31% weekly (!). This is at least 30% faster than Canada, France, Spain, UK & USA
/13a #COVID19BC #bcpoli
•Per capita DEATHS: Increasing 3% daily, 20% weekly (!)
•Per capita CASES: Increasing 4% daily, 31% weekly (!). This is at least 30% faster than Canada, France, Spain, UK & USA
/13a #COVID19BC #bcpoli


Key take-home message #7b: #BC #COVID19
Longterm Care, Retirement Homes
1.Per capita DEATHS: Increasing 1% daily, 8% weekly
2.Per capita CASES: Increasing 4% daily, 31% weekly (!). This is 3X faster than the Canadian avg.
/13b #COVID19BC #bcpoli
Longterm Care, Retirement Homes
1.Per capita DEATHS: Increasing 1% daily, 8% weekly
2.Per capita CASES: Increasing 4% daily, 31% weekly (!). This is 3X faster than the Canadian avg.
/13b #COVID19BC #bcpoli


Key take-home message #8: SASKATCHEWAN
#Canadian scientists, clinicians, experts, everyone
Please keep your eyes on #COVID19 in #Saskatchewan, follow public health measures, and stay home except for essential activities.
Why?
Sub-thread…
/14 #COVID19SK #skpoli
#Canadian scientists, clinicians, experts, everyone
Please keep your eyes on #COVID19 in #Saskatchewan, follow public health measures, and stay home except for essential activities.
Why?
Sub-thread…
/14 #COVID19SK #skpoli
Key take-home messages: #Saskatchewan #COVID19
•Per capita CASES: Increasing 6% daily, 44% weekly (!). This is as fast as the epidemic growth rate in Italy, and at least 2X faster than Canada, France, UK and USA.
/14a #COVID19SK #skpoli
•Per capita CASES: Increasing 6% daily, 44% weekly (!). This is as fast as the epidemic growth rate in Italy, and at least 2X faster than Canada, France, UK and USA.
/14a #COVID19SK #skpoli

I will start tagging people in the morning. Heading to bed!
Stay home except for essential activities, stay safe, protect the vulnerable and those who depend on our actions to stay safe.
And never forget the looming catastrophe of exponential growth.
Stay home except for essential activities, stay safe, protect the vulnerable and those who depend on our actions to stay safe.
And never forget the looming catastrophe of exponential growth.
• • •
Missing some Tweet in this thread? You can try to
force a refresh