Any excess mortality experts out there?
I'm looking the cumulative excess mortality tracker table on @OurWorldInData
ourworldindata.org/grapher/excess…
As of July 26, which is last date we have excess mortality data for Canada, I see Canada has 3rd highest % excess mortality among peers.
I'm looking the cumulative excess mortality tracker table on @OurWorldInData
ourworldindata.org/grapher/excess…
As of July 26, which is last date we have excess mortality data for Canada, I see Canada has 3rd highest % excess mortality among peers.
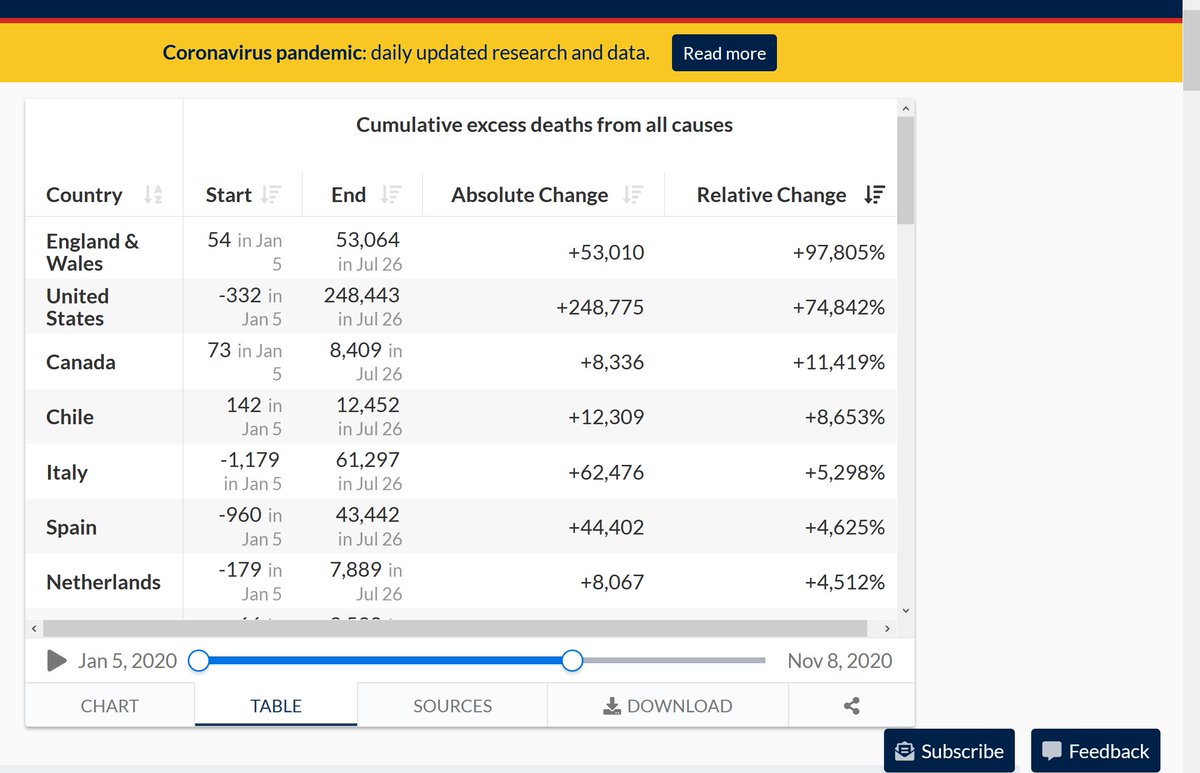
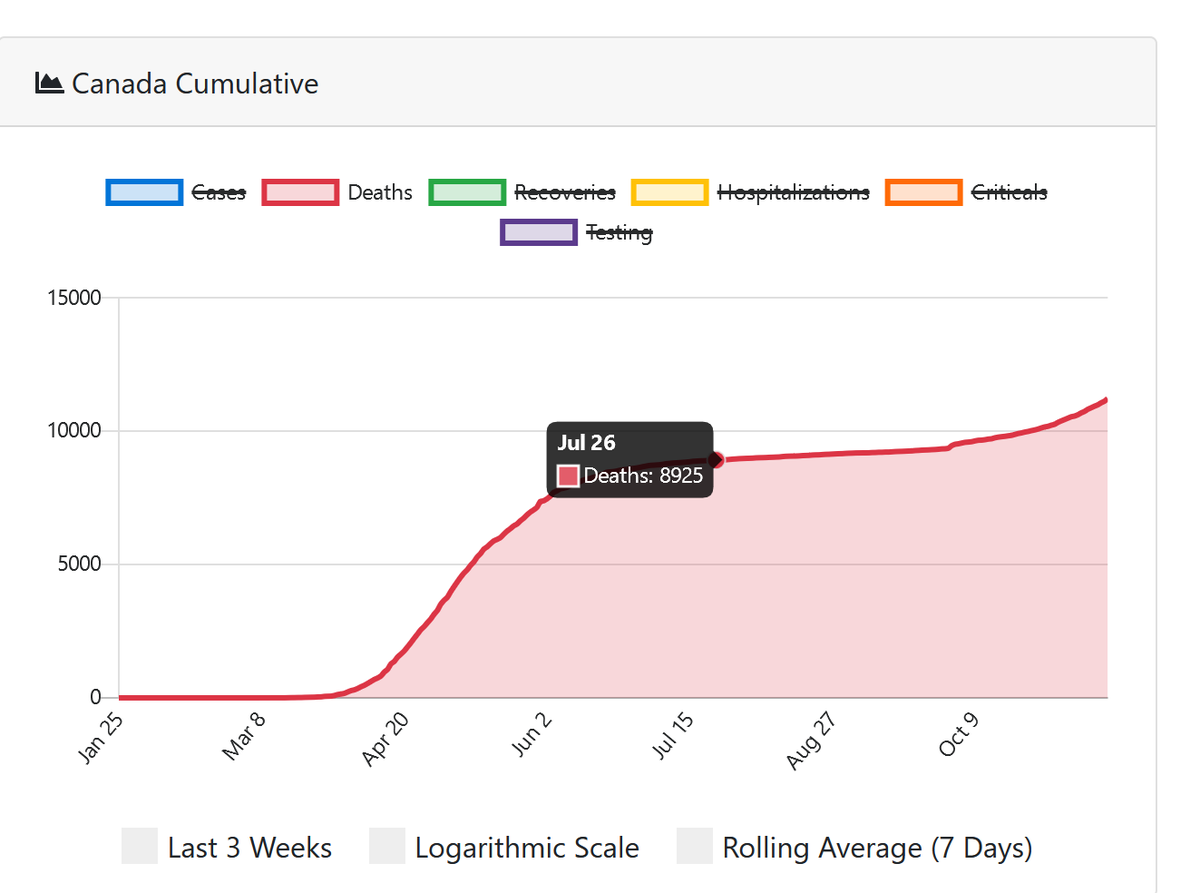
The absolute number of excess deaths as of July 26 matches cumulative total #COVID19 deaths in #Canada reported by @covid_canada, so I suspect this means we're doing a good job of counting our COVID deaths, and that only a relatively small % of them would have died without COVID.
Other countries, such as USA, seem to be greatly under-reporting, since as of July 26, they had a cumulative excess mortality of nearly 250,000 deaths but are only reporting that number of COVID-19 deaths as of this week.
Ppl can see the whole list at the link above (move slider to July 26 to compare same dates as last available data for Cda).
But to me, this means #Canada has actually been extraordinarily hard hit by #COVID19. This would make sense given our high case fatality rate.
But to me, this means #Canada has actually been extraordinarily hard hit by #COVID19. This would make sense given our high case fatality rate.
List of cumulative % excess mortality by country on Jul 26, from worst to best:
🇬🇧(England, Wales): +97,805%
🇺🇸+74,842%
🇨🇦+11,419%
🇮🇹+5,298%
🇪🇸+4,625%
🇫🇷+3,225%
🇰🇷+1,985%
🇩🇪+113%
There's no excess mortality data for the other high income countries w/ pop >20M I usually track.
🇬🇧(England, Wales): +97,805%
🇺🇸+74,842%
🇨🇦+11,419%
🇮🇹+5,298%
🇪🇸+4,625%
🇫🇷+3,225%
🇰🇷+1,985%
🇩🇪+113%
There's no excess mortality data for the other high income countries w/ pop >20M I usually track.
I think it's pretty clear that #Canada is doing a good job of "counting the dead" for #COVID19, and reporting them.
But.....we either have an incredibly high true case fatality rate compared to other countries (i.e. we're inherently more likely to die of COVID--doubtful), or....
But.....we either have an incredibly high true case fatality rate compared to other countries (i.e. we're inherently more likely to die of COVID--doubtful), or....
....we are missing an absolute ton of #COVID19 cases, and our epidemic has been much, much worse than we know and/or than we've been accustomed to thinking.
Here's the age breakdown of the excess mortality. I'm comparing to Germany in this graph, because generally they kept excess mortality very low during this period.

So, our excess mortality has almost exclusively been in people older than 65. It's high in the 85+ group, many of whom would be in nursing homes, but also in other groups that are less typically living in care homes. @LauraCRosella & colleagues saw this in Ontario cremation data.
Our excess deaths in older people are NOT just in longterm care settings, although these are the ones that may have been most visible due to media coverage etc.
OK. So let's do some thinking about case fatality rates and detected cases. Just back of the envelope estimates.
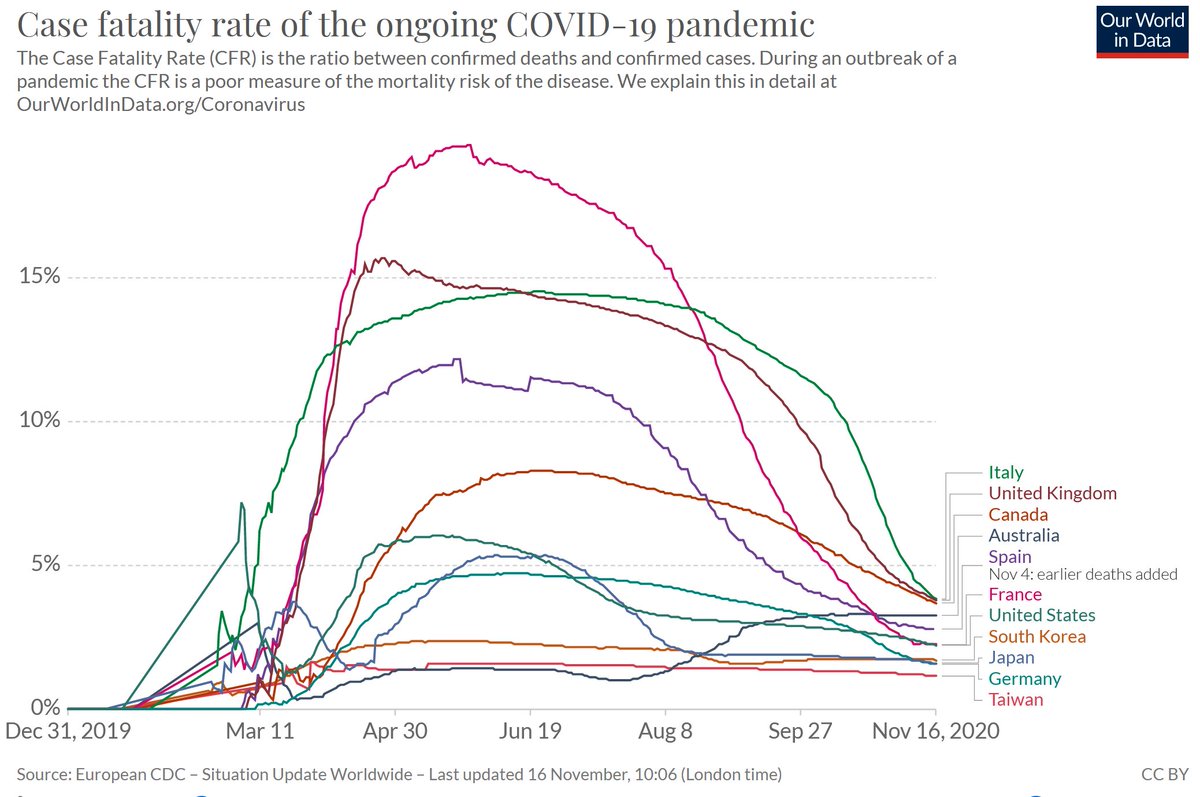
The world COVID-19 CFR to date is 2.4%. Canada is 3.6% (50% higher, 3rd only to Italy, UK, BTW).
The actual CFR is probably closer to 0.5-1%, according to experts.
The world COVID-19 CFR to date is 2.4%. Canada is 3.6% (50% higher, 3rd only to Italy, UK, BTW).
The actual CFR is probably closer to 0.5-1%, according to experts.
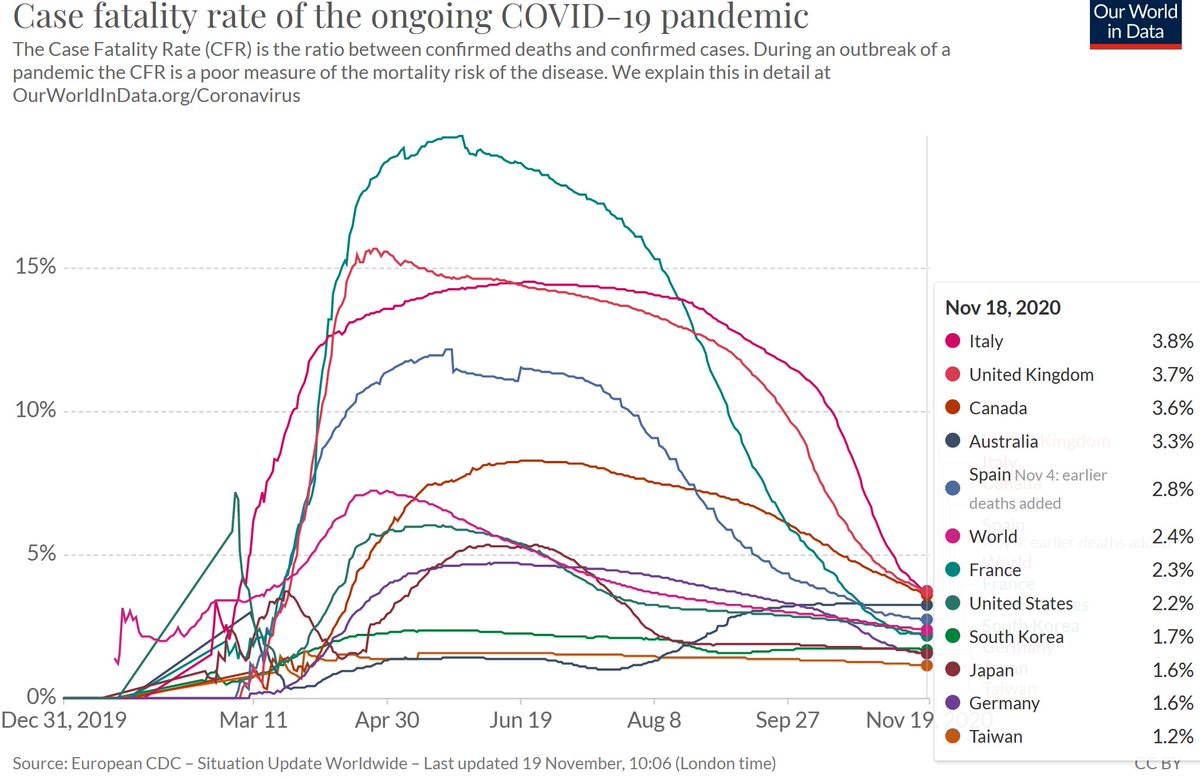
This difference suggests that the size of the worldwide pandemic is likely 2.5-5 times larger than we know (very likely). Or the experts have greatly underestimated the true CFR (much, much less likely).
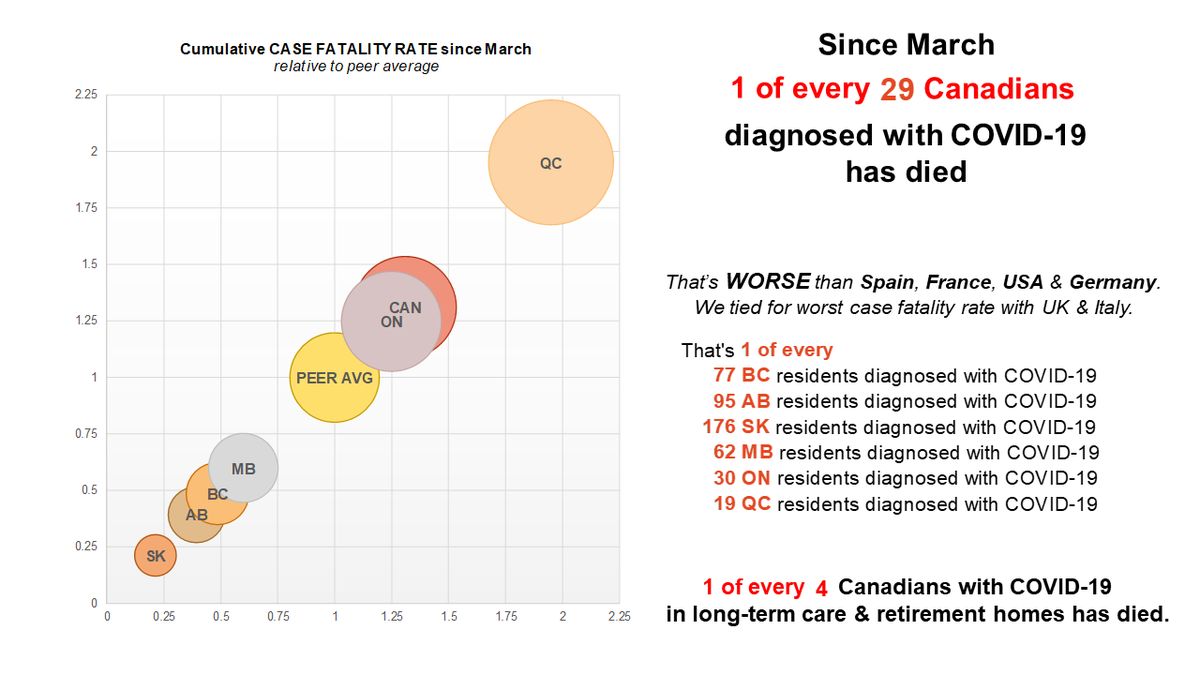
For those wanting to get a different sense of what this means, 1 in every 42 ppl diagnosed with #COVID19 worldwide dies. In #Canada it's 1 in every 28 diagnosed people who die.
Not good odds if you're Canadian.
Not good odds if you're Canadian.
ok. let's try to break this down a bit and see if we're more likely to die than other people in the world (disturbing if true), or if we've REALLY underestimated the scale of the epidemic in Canada.
Let's work with some data from Ontario.
As of the end of July, seroprevalence data from @PublicHealthON estimate that ~1.1 % of Ontarians have been infected.
publichealthontario.ca/-/media/docume…
As of the end of July, seroprevalence data from @PublicHealthON estimate that ~1.1 % of Ontarians have been infected.
publichealthontario.ca/-/media/docume…
ON 2019 pop was 14.57M. So about 160K ppl have been infected.
As of Jul 30, ON had 2809 reported #COVID19 deaths. Let's assume all deaths were reported.
2809 deaths/160K cases = a case fatality rate of 1.1%, which is in line w/ expert estimates of true CFR.
As of Jul 30, ON had 2809 reported #COVID19 deaths. Let's assume all deaths were reported.
2809 deaths/160K cases = a case fatality rate of 1.1%, which is in line w/ expert estimates of true CFR.
The more I think about all of this, the more convinced I am that we're MASSIVELY under-detecting the size of the epidemic in Canada, likely due to our testing strategies.
This is not good right now, when we badly need situational awareness to make public health decisions.
This is not good right now, when we badly need situational awareness to make public health decisions.
I've made a calculation error, as helpfully pointed out. The Ontario CFR is 1.76%, based on seroprevalence data, which is probably double expert estimates.
Let's assume that CFR is actually 1% in Ontario. If this is the case, then by July 30, we'd actually had ~290K cases.
Let's assume that CFR is actually 1% in Ontario. If this is the case, then by July 30, we'd actually had ~290K cases.
This would put us at 1928 cumulative cases/100K ppl as of end of July, one of largest per capita epidemics in world (although of course other countries have under-captured their cases too). This actually isn't surprising considering that we have a continent-wide border w/ USA.
Across Canada, with 8925 deaths by July 30, we likely had had nearly 1 million cases across Canada, or 2380/100K people, which is extraordinarily high. Again, not surprising considering our shared border and our extreme under-testing of asymptomatic/less at-risk cases.
sorry....trying to use as little jargon as possible for everyone. I'm talking about CFR, which is % of diagnosed cases that die. But when I refer to true percentage of infected people who die (which experts estimate is ~ 0.5-1%), I should be calling it the Infection Fatality Rate
Simplification in this case caused more confusion. Also, I'm doing this in b/wn/during meetings etc so I'm not always as focused as I should be!
So, if the real IFR is 0.5-1%, up to July 30th-ish, we can guess how many cases we missed by dividing CFR on that date (4.4%) by 0.5 or 1. We missed somewhere b/wn 44-88% of cases till then, probably closer to 88%.
Anyone following--I'm so sorry I haven't finished this thread yet. I shouldn't have started it when I didn't have time. Still a few more hours of other work, but I'll come back to it then.
I'll finally get to my major point, which is why I think Canada might have to aim for #COVIDzero not to actually achieve zero cases but because we likely have a much bigger epidemic than we think, so will have to aim for much lower case numbers than we think seem reasonable.
anyway--hopefully I'll be more clear later. I've been thinking a lot about #COVIDzero recently & about whether it's achievable on our current timeline. But last night I started thinking we may have no other option if we want to avoid one of highest excess mortality rates in world
I'm back. OK, so let's say that the infection fatality rate is 1%, and there were 8925 deaths reported by July 26. This was roughly about 892,500 cases, but these likely would have been contracted 1 month before b/c death takes avg 2 wks and death reporting can take 2 wks.
On June 26, 105K cases were reported but we can crudely estimate that 893K actually occurred. So, we were missing about 90% of cases across the country. On June 26 we'd cumulatively run 25 tests for every confirmed case, and were missing 90%.

So, how much testing are we doing now compared to then. Well, it turns out we're now running as few tests per confirmed case as we were back in March-April when things were really bad. This is really worrying.

Even though there has been lots of talk that we're testing more and catching more cases now, which means we'll have fewer deaths, I actually don't think this is true. I think we're likely still missing 90% of cases. It's just that for most of Sep-Oct they were in younger ppl.
OK, so why have I been meandering around the point all day (apart from being tired & a little distracted!)?
If we're still missing 90% of cases, how many are actually occurring today, and what does this mean for controlling the epidemic?
If we're still missing 90% of cases, how many are actually occurring today, and what does this mean for controlling the epidemic?
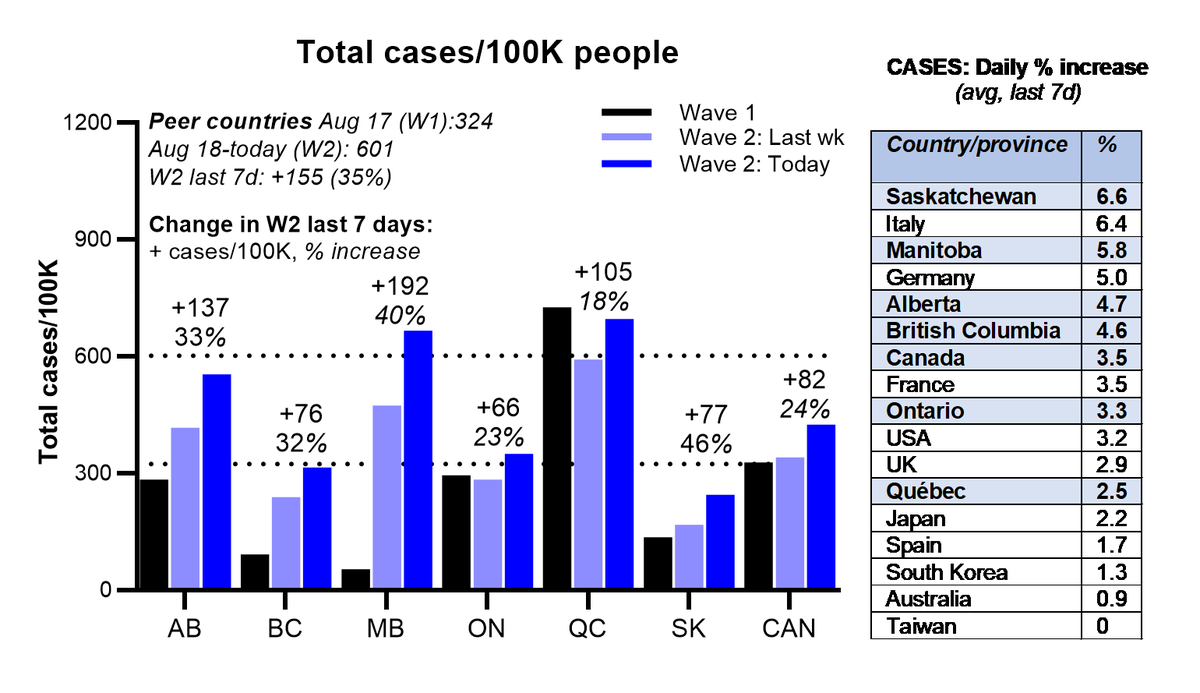
As of today, in the last wk there have been 88 new cases reported for every 100K people across Canada. It's ~150 in AB, 200 in MB. Multiply that by 10 to account for under-reporting, and that's 880 new cases/week across Canada, 1500 in AB, 2000 in MB.
If these *really* rough estimates are correct (& I don't know yet if they will be, b/c I'm talking my way through them now), then if we go back 4 wks & estimate the number of new cases that actually occurred that wk, then multiply by 1% we should get number of new deaths this wk.
The week starting Oct 15 there were 45 new cases/100K people. Multiply by 10 gives you 450 new cases/100K in that wk. Multiply by 1% IFR, and in the week ending this week, we should have seen about 4.5 new deaths/100K people. Remember that cases then were in younger ppl.
We've had 477 new deaths in the last wk, divided by 37.59M pop & we get 1.3 new deaths/100K this week, or about 3X less than expected based on a 1% IFR. However, 4 wks ago, the majority of cases were diagnosed in people under 40. This week, 25% of cases are now in ppl over 60.
Going forward, based on how much we under-detect cases and as there's increasingly more spread into older populations, I would guess that the new deaths we can expect in a month will be roughly 10% of the cases diagnosed today--probably closer to 7.5%, which was our CFR by May 26
Hopefully fewer people will die because we have in fact improved treatment, but I'm not completely sure we're actually detected a higher % of cases than we were in spring, certainly not now.
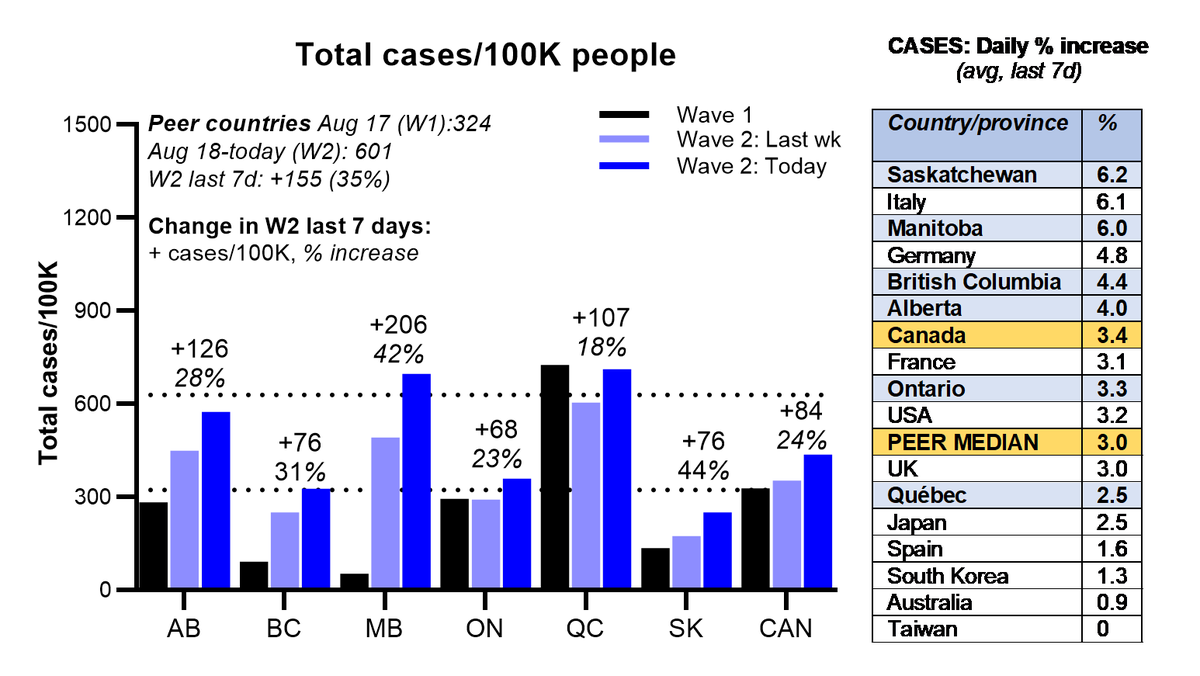
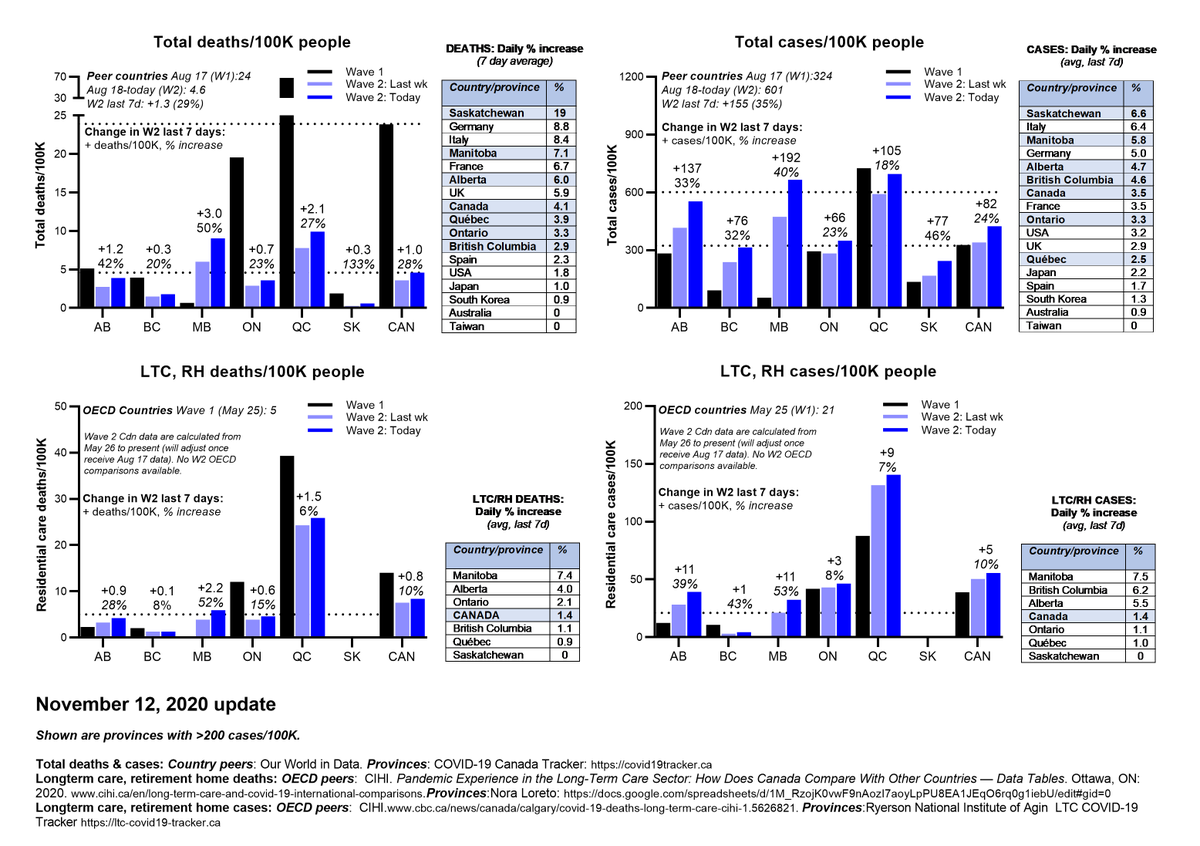
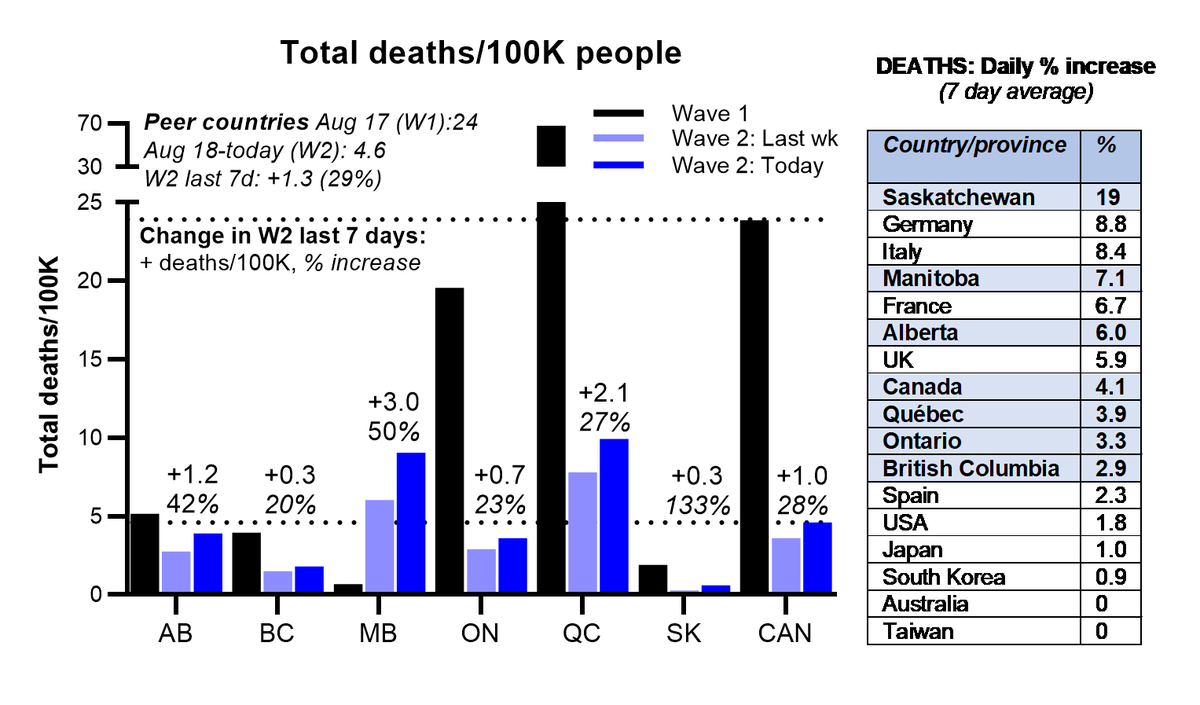
I really hope I'm wrong, but I'm not seeing hope in the fact that our total wave 2 deaths increased by 27%, but our cases increased by 21%, or roughly one third more slowly than deaths. Yes, restrictions may be curbing transmission, but I see no sign of that in the curve here:
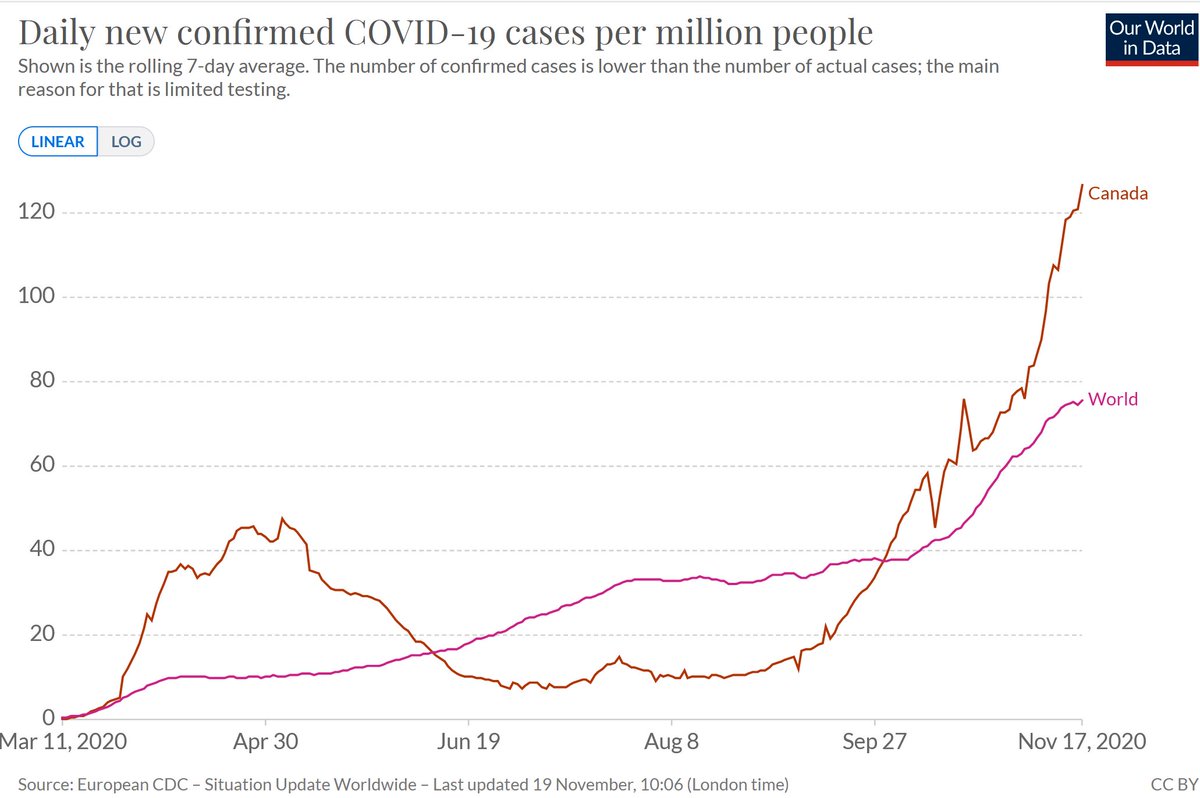
For good measure, here is the plot of our daily new per capita deaths compared to the rest of the world. There are so many caveats with this comparison, but we should all be thinking long and hard about this before defaulting to the assumption that we're probably doing ok.

So, to finally return to #COVIDZero. No, I don't think it's politically feasible before the summer. Or based on what our true case numbers likely are and holding the longest undefended border with a neighbour to the south that is in serious COVID19 trouble.
But, I do think that aiming to reach less than 25 new weekly cases/100K people per week is essential, and since we're likely detecting only 10% of cases, that means we should really aim for 2.5/100K new cases/week. Even reaching that goal would be very hard in some places.
The case fatality rates in Manitoba and Quebec are more than 50% higher than the CFRs in our peer high income countries--higher than the USA, Italy, Spain, UK. These provinces are likely massively under-detecting cases.


even to go from 88 new cases/100K/wk in Canada to 2.5 new cases/100K/wk will be very hard. The lowest we every really got in Canada this summer was about 5-10/100K/wk, and we started out at a peak of about 35 new/100K/wk--half of where we are now.
This would suggest it could take us four times as long, with pretty severe restrictions, to make it to even 2.5 new cases/100K/wk. But I don't know what the alternative is.
Returning to the excess mortality data I started w/ this morning, #Canada is 3rd worst among countries reporting these data, w/ gold & silver medals going to England/Wales & our neighbour to the south.
Our excess mortality is 10X higher than Germany.
Our excess mortality is 10X higher than Germany.
https://twitter.com/MoriartyLab/status/1329445723935567872?s=20
I really do think our epidemic has been 7.5-10X bigger than we think, and probably still is considering that we're currently doing the same number of tests/case that we were doing in March-April.
There are so many nuances I have ignored or oversimplified in these arguments. These are the back of the envelope of back of the envelope estimates. But there's still something clearly wrong with our numbers and assumptions about the size of the epidemic in Canada.
I'm really hoping that someone with far greater expertise than me can point some way that I'm really, really far off in these guesstimates. In any case, what can we do, except fight to get provinces to do the right thing, and hope.
Thanks for your patience! Not until the last year did I ever think I'd be working my way through my thoughts publicly, where all the potential mistakes are there for all to see. But....we need to have this conversation in Canada, and I'm happy to be the useful idiot who starts.
correction: our total Wave 2 deaths increased by 27% in the last week, while total Wave 2 cases increased by 21%
• • •
Missing some Tweet in this thread? You can try to
force a refresh