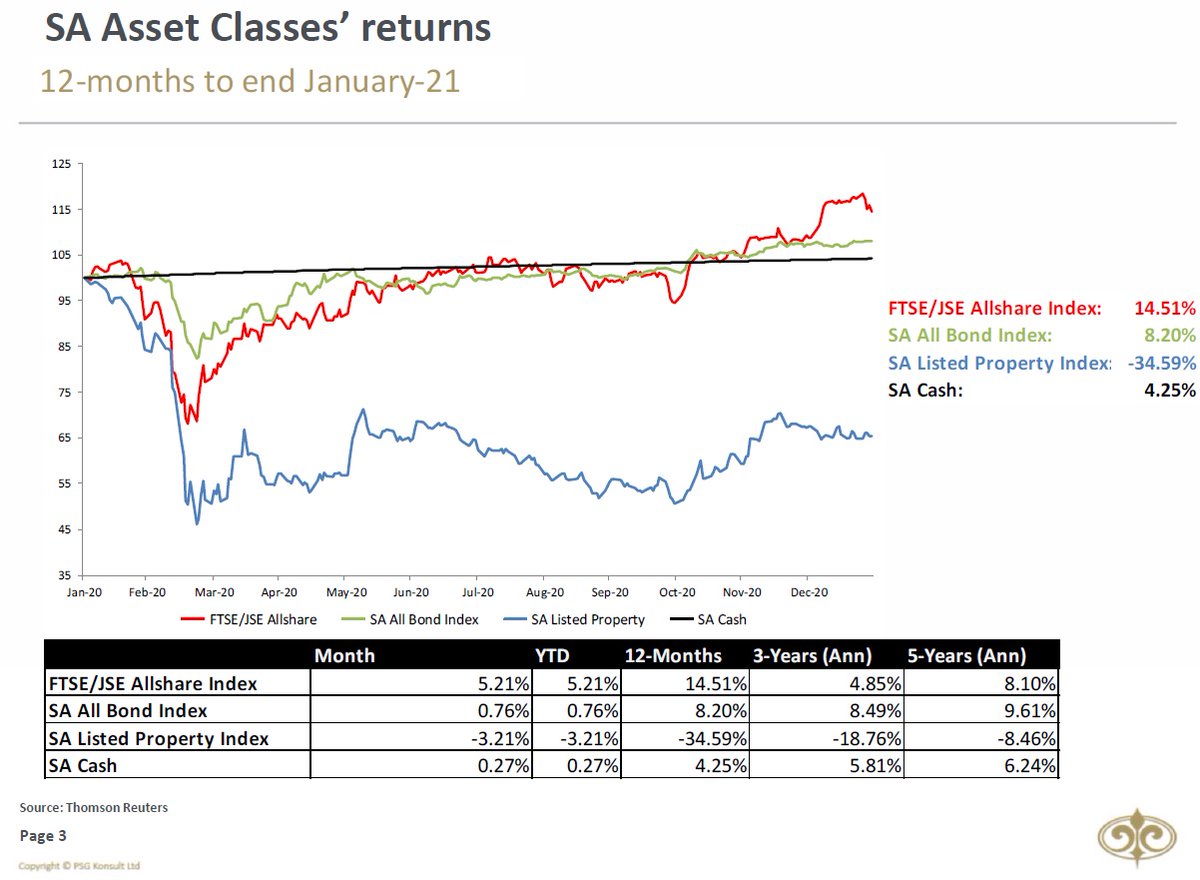
UPDATE ON MARKETS: What an eventful start to 2021. Between short-squeezes and hedge funds blowing up, volatility was definitely on the forefront during January. FTSE/JSE All Share (JSE) improved by 5.21% during January, bringing the 12-month returns to 14.51%. 
2/12
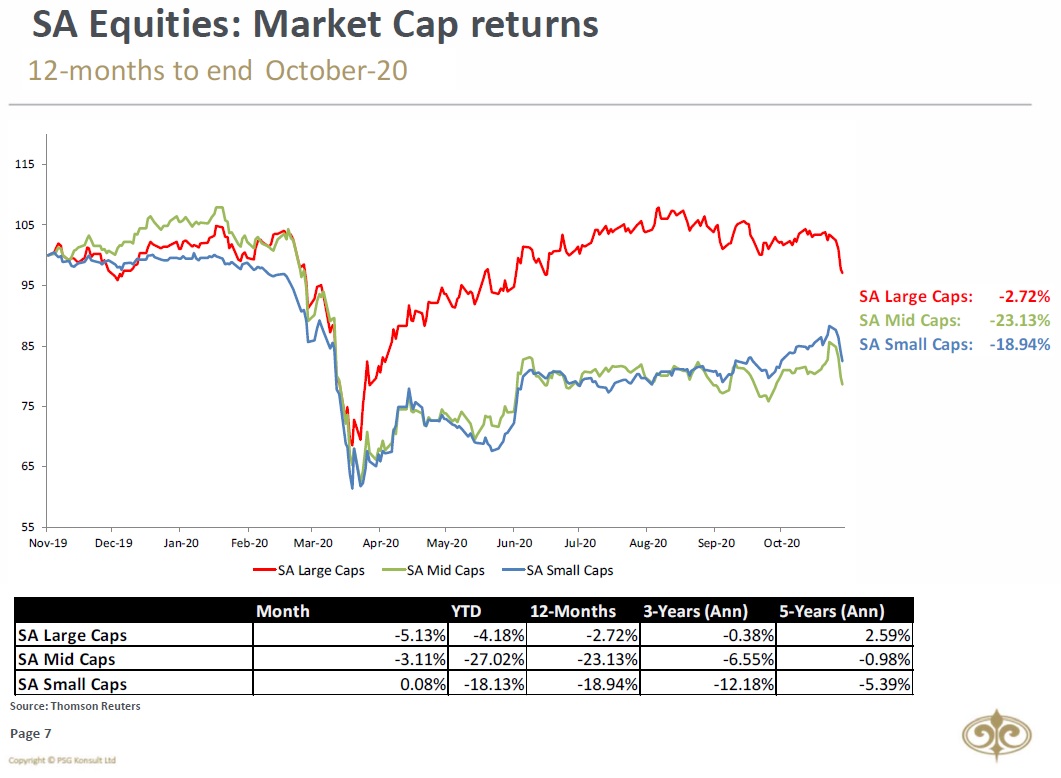
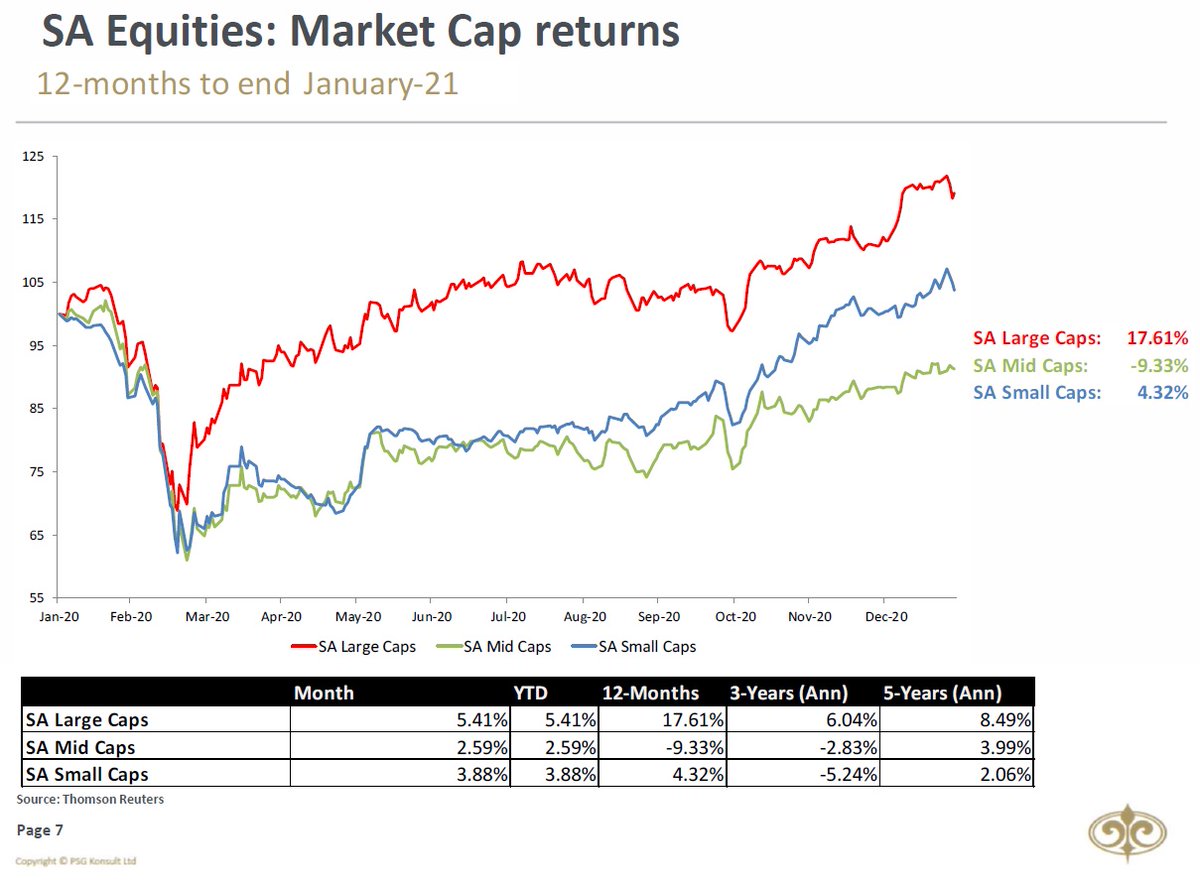
South African Large Caps dominated during January, growing by 5.41%. Mid Caps and Small Caps grew by 2.59% and 3.88%, respectively.
South African Large Caps dominated during January, growing by 5.41%. Mid Caps and Small Caps grew by 2.59% and 3.88%, respectively.
3/12
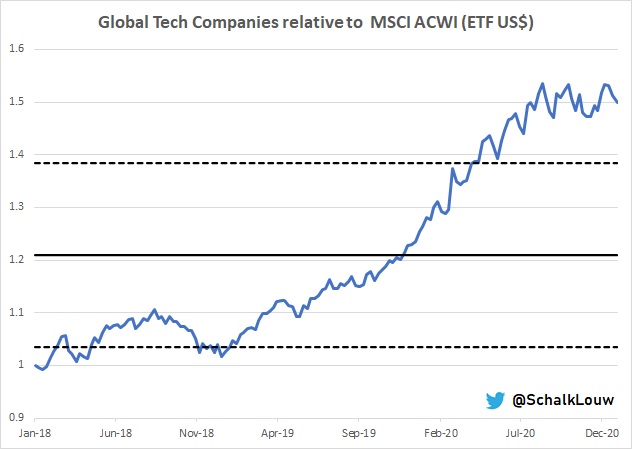
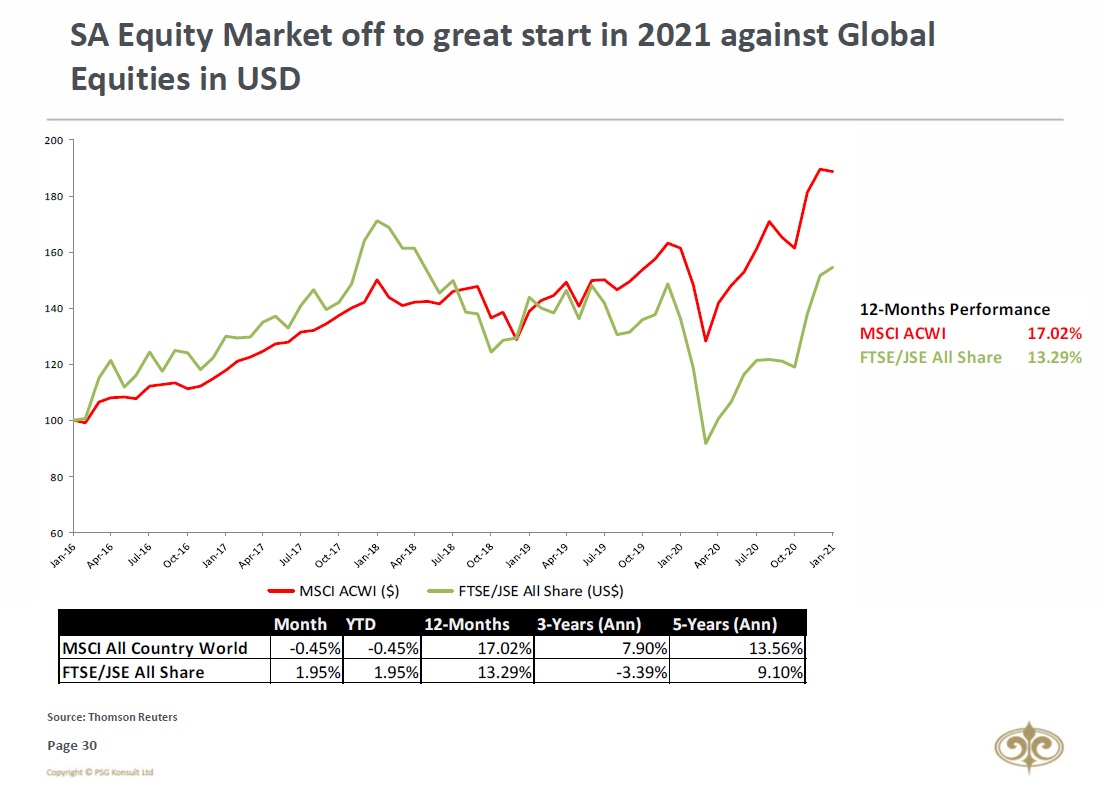
The FTSE/ JSE All Share (+1.95%) enjoyed a better month than the MSCI All Country World Index (-0.45%) again in USD terms. The 12-month performance for the JSE in USD-terms is now only lagging behind the MSCI ACWI´s performance by 3.7%.
The FTSE/ JSE All Share (+1.95%) enjoyed a better month than the MSCI All Country World Index (-0.45%) again in USD terms. The 12-month performance for the JSE in USD-terms is now only lagging behind the MSCI ACWI´s performance by 3.7%.
4/12
The #FearandGreed #SouthAfrica #Index moved into GREED territory during January. For those followers who'd like to get more information on the Fear & Greed South African Index, can click here: oldoak.co.za/wp/index.php/2…
The #FearandGreed #SouthAfrica #Index moved into GREED territory during January. For those followers who'd like to get more information on the Fear & Greed South African Index, can click here: oldoak.co.za/wp/index.php/2…

5/12
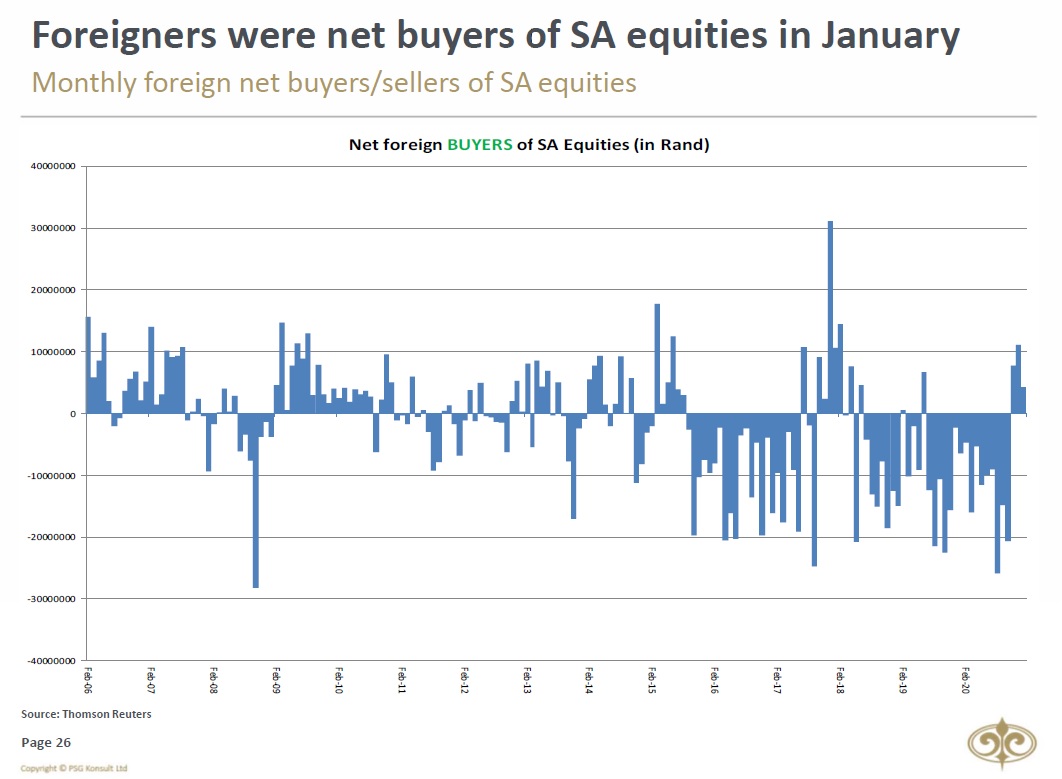
Foreigners were net buyers of both SA Equities and Bonds during January. This makes foreigners buyers of SA Equities and Bonds for 3 months in a row now.
Foreigners were net buyers of both SA Equities and Bonds during January. This makes foreigners buyers of SA Equities and Bonds for 3 months in a row now.
6/12
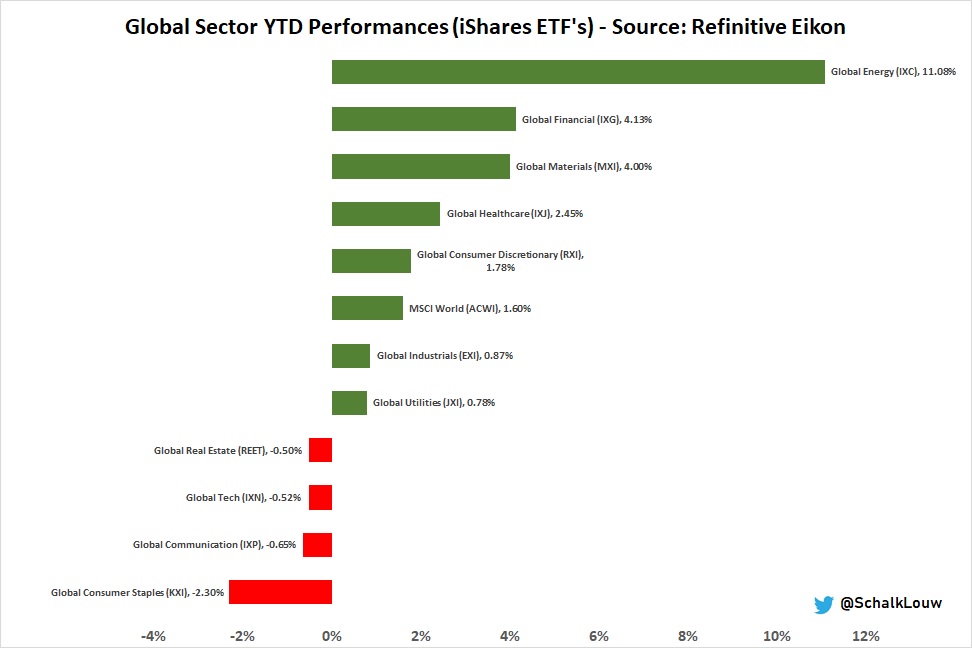
From a sectoral point of view, January saw the Industrials and Resource sectors improve by 8.48% and 4.86%. More on Financials in my next tweet (7/12)
From a sectoral point of view, January saw the Industrials and Resource sectors improve by 8.48% and 4.86%. More on Financials in my next tweet (7/12)

7/12
It was definitely the #Naspers & #Prosus show during January. SA Banks had a horrible month, making it by far the biggest losers on the JSE. This contributed to the Financial sector losing 3.08% of its value during January.
It was definitely the #Naspers & #Prosus show during January. SA Banks had a horrible month, making it by far the biggest losers on the JSE. This contributed to the Financial sector losing 3.08% of its value during January.

8/12
The Rand lost 3.1% of its value against the USD. This was in line with most BRICS currency movements, however. In actual fact, the Rand now moved into the best performing BRICS currency position over a 5-year period.
The Rand lost 3.1% of its value against the USD. This was in line with most BRICS currency movements, however. In actual fact, the Rand now moved into the best performing BRICS currency position over a 5-year period.

9/12
Commodities were mixed during January. Brent Oil recovered further with a massive jump (+7.82%) during the month. Copper improved by 1.46%, while Platinum was marginally stronger. Gold and Palladium retracted over the same period, however.
Commodities were mixed during January. Brent Oil recovered further with a massive jump (+7.82%) during the month. Copper improved by 1.46%, while Platinum was marginally stronger. Gold and Palladium retracted over the same period, however.

10/12
The SA General Equity Unit Trust Sector was up by 3.38% during January. SA Multi-Asset High Equity & Low Equity Sectors grew by 2.8% & 1.1%, respectively, for the month.
The SA General Equity Unit Trust Sector was up by 3.38% during January. SA Multi-Asset High Equity & Low Equity Sectors grew by 2.8% & 1.1%, respectively, for the month.

11/12
The US M2 Money Supply YoY growth rate reached a new all-time high AGAIN for the eighth time in 2020, during December.
The US M2 Money Supply YoY growth rate reached a new all-time high AGAIN for the eighth time in 2020, during December.

12/12 & Final
The US Dollar Index is trading below its downward-sloping 200-day Moving Average, and 50-day Moving Average.
The US Dollar Index is trading below its downward-sloping 200-day Moving Average, and 50-day Moving Average.

Unroll @threadreaderapp
• • •
Missing some Tweet in this thread? You can try to
force a refresh