#Fed Put & Financial Conditions Index (#FCI):
#Powell: “…would be concerned by…persistent tightening in financial conditions…”
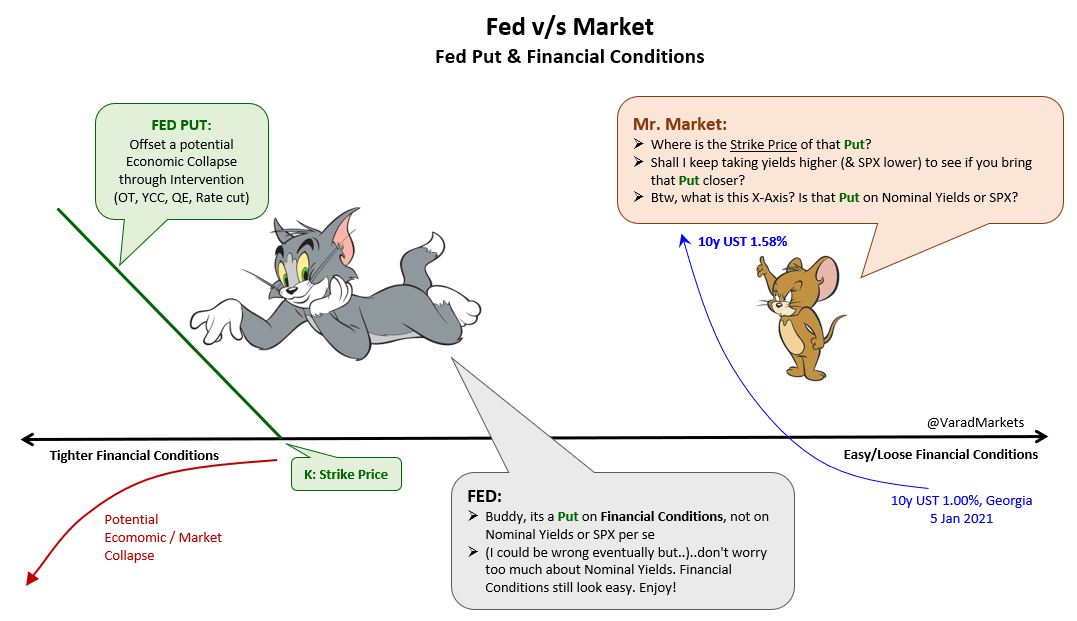
🚩Just-for-fun graphic: Fed Put - Market’s search for Put’s Strike Price = Fed’s intervention threshold
🚩#DiveIn: FCI & Macro
1/12
#Powell: “…would be concerned by…persistent tightening in financial conditions…”
🚩Just-for-fun graphic: Fed Put - Market’s search for Put’s Strike Price = Fed’s intervention threshold
🚩#DiveIn: FCI & Macro
1/12
So why learn about FCI?
#1 Fed tracks FCI
#2 FCI affects GDP/Output
Traditional Keynesian => s/t Interest Rates affect GDP
Goldman’s Hatzius/Stehn argue (2018 paper) Interest Rates first affect FCI (empirically mild relationship) & FCI then strongly affects GDP (Graphic)
2/12
#1 Fed tracks FCI
#2 FCI affects GDP/Output
Traditional Keynesian => s/t Interest Rates affect GDP
Goldman’s Hatzius/Stehn argue (2018 paper) Interest Rates first affect FCI (empirically mild relationship) & FCI then strongly affects GDP (Graphic)
2/12

Financial Conditions Index (FCI)?
▶️One # to capture state of conditions in financial/banking system
▶️weighted average of indicators of interest rates, exchange rate, credit spreads & equity valuations
▶️each indicator expressed relative to its avrg & scaled by its stdev
3/12
▶️One # to capture state of conditions in financial/banking system
▶️weighted average of indicators of interest rates, exchange rate, credit spreads & equity valuations
▶️each indicator expressed relative to its avrg & scaled by its stdev
3/12
FCI affects GDP components:
Y = C + I + G + NX
• Disposable Income & Wealth determine => Consumption C
• Corporate borrowing cost => Non-Residential Investment I
• Interest/Mortgage Rates => Residential I
• Real Effective FX => Net Trade NX
Chart: BBG FCI vs GDP
4/12
Y = C + I + G + NX
• Disposable Income & Wealth determine => Consumption C
• Corporate borrowing cost => Non-Residential Investment I
• Interest/Mortgage Rates => Residential I
• Real Effective FX => Net Trade NX
Chart: BBG FCI vs GDP
4/12

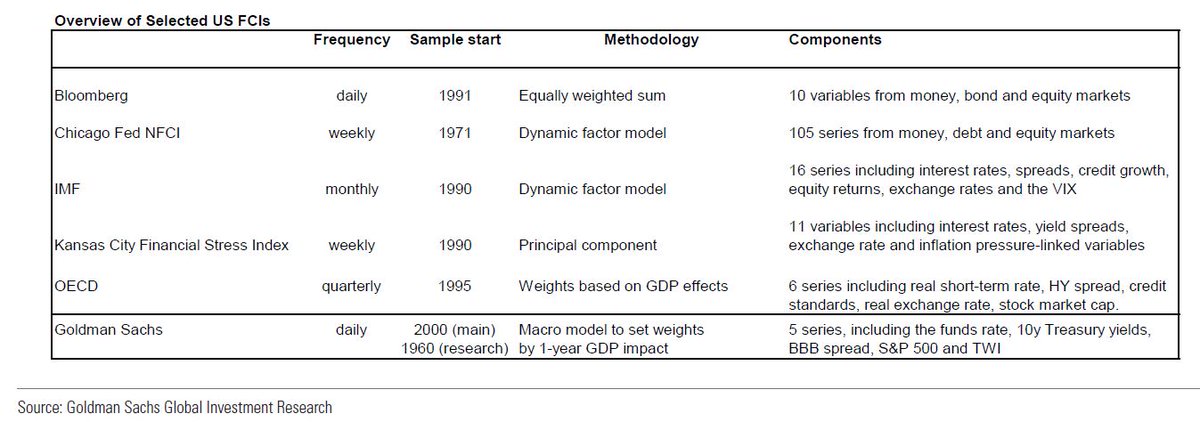
Overview of 3 off ~12 FCI out there:
🔴 Chicago Fed’s National FCI (NFCI):
- rigorous with 105 indicators
- measures conditions in markets & also banking system
- weights from PCA => relative importance in explaining index's historical fluctuations
@chigrl @HayekAndKeynes
5/12
🔴 Chicago Fed’s National FCI (NFCI):
- rigorous with 105 indicators
- measures conditions in markets & also banking system
- weights from PCA => relative importance in explaining index's historical fluctuations
@chigrl @HayekAndKeynes
5/12

NFCI Indicator Classification:
🚩#Risk indicators capture volatility & funding risk in financial sector
🚩#Credit measures household & nonfinancial business credit conditions
🚩#Leverage measures debt relative to equity
Chart: NFCI history
@bondstrategist @LONGCONVEXITY
6/12
🚩#Risk indicators capture volatility & funding risk in financial sector
🚩#Credit measures household & nonfinancial business credit conditions
🚩#Leverage measures debt relative to equity
Chart: NFCI history
@bondstrategist @LONGCONVEXITY
6/12

NFCI:
+ve => tighter-than-average financial conditions (FC)
-ve => looser-than-average FC
Zero => U.S. financial system operating at historical avrg levels of risk, credit & leverage
Table: NFIC Indicators from various segments
@sunchartist @DiMartinoBooth @TenYearNote
7/12
+ve => tighter-than-average financial conditions (FC)
-ve => looser-than-average FC
Zero => U.S. financial system operating at historical avrg levels of risk, credit & leverage
Table: NFIC Indicators from various segments
@sunchartist @DiMartinoBooth @TenYearNote
7/12


🔴Goldman FCI
- 5 Indicators across s/t, l/t interest rate, corporate spread, equity price & FX TWI
- 85% weight on 10yr UST yield & iBoxx Dom NF BBB 15y Sprd
- weights from effect of each Indicator's shock on real GDP over four quarters, ceteris paribus
8/12
- 5 Indicators across s/t, l/t interest rate, corporate spread, equity price & FX TWI
- 85% weight on 10yr UST yield & iBoxx Dom NF BBB 15y Sprd
- weights from effect of each Indicator's shock on real GDP over four quarters, ceteris paribus
8/12

🔴Bloomberg FCI
- Uses 10 Indicators from Money, Bond & Equity markets
Few Observations:
▶️GS FCI => more volatile (less # of variables, major weight on US Yield & Corp spread) but updated daily
▶️NFCI more stable but updated only weekly
9/12
- Uses 10 Indicators from Money, Bond & Equity markets
Few Observations:
▶️GS FCI => more volatile (less # of variables, major weight on US Yield & Corp spread) but updated daily
▶️NFCI more stable but updated only weekly
9/12

▶️NFCI has no weight on absolute level of any Equity Index
▶️But NFCI does account for:
- S&P VIX
- S&P Market Cap/GDP
- S&P F&O Open Interest
- S&P Financial/SPX Index Ratio relative to its MA
Chart: the three FCIs
10/12
▶️But NFCI does account for:
- S&P VIX
- S&P Market Cap/GDP
- S&P F&O Open Interest
- S&P Financial/SPX Index Ratio relative to its MA
Chart: the three FCIs
10/12

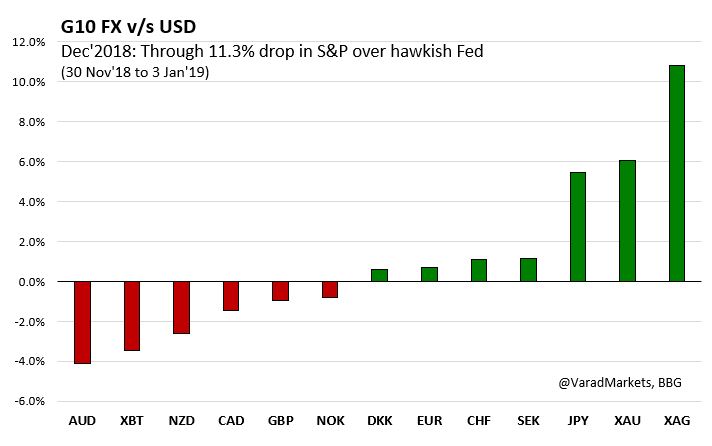
Side-note: Recent Yields vs Equities:
🚩10y UST back to pre-pandemic (Jan’20) lvl 1.60%; SPX still 13.5% above pre-pandemic peak (3386)
🚩~100 bp bond sell off (0.51%=>1.58%) since Aug’20; SPX +17.5% (from 3305) on reflation/growth
Chart: SPX vs UST
@saxena_puru
11/12
🚩10y UST back to pre-pandemic (Jan’20) lvl 1.60%; SPX still 13.5% above pre-pandemic peak (3386)
🚩~100 bp bond sell off (0.51%=>1.58%) since Aug’20; SPX +17.5% (from 3305) on reflation/growth
Chart: SPX vs UST
@saxena_puru
11/12

🚩Faster 60bp bond sell off since Georgia, 10y crossed 1%; SPX still 3% above pre-Georgia (3726)
One consequent view: need deeper equity correction (significantly tighter FCI) for Fed to become uneasy with higher rates
Btw, what's the Strike Price of Fed Put?
Thoughts?
One consequent view: need deeper equity correction (significantly tighter FCI) for Fed to become uneasy with higher rates
Btw, what's the Strike Price of Fed Put?
Thoughts?
• • •
Missing some Tweet in this thread? You can try to
force a refresh