
Today's rainfall/weather update for the #NorthAfrica #HornOfAfrica and #MiddleEast follows.
The short version is that the peak of the rainy season may have passed, but there are signs of another Indian Monsoon surge coming in 10-12 days in long range forecasts.
The short version is that the peak of the rainy season may have passed, but there are signs of another Indian Monsoon surge coming in 10-12 days in long range forecasts.
Here is the long-range GFS model PWAT forecast for the Indian Monsoon. Towards the end it strengthens and we see high levels of moisture heading for the #HornOfAfrica.
Here is a big picture view of the greater region including all the areas that this weekly bulletin will cover.
A review of the past week showed that Sahel-Sahara rainfall has continued, as has rainfall in northern Sudan. The northerly rain is however not particularly heavy.
A review of the past week showed that Sahel-Sahara rainfall has continued, as has rainfall in northern Sudan. The northerly rain is however not particularly heavy.
Water flows originating in the Arabian Sea and West Africa/East Atlantic #NA Coast continue to significantly impact Europe's weather causing serious flooding in many areas.
Today's 10-Day Rainfall forecasts for North Africa from August 8th through August 17th.
GFS, CMC and KMA models.
GFS, CMC and KMA models.


48-hour #NorthAfrica rainfall forecasts (today and tomorrow from the same 3 models).


This is a favourite forecast plot, it shows precipitable water vapour anomaly vs the 1981-2010 climate data set over the next five days.
It shows us there is still signs of an airborne water anomaly over the Sahara, albeit not one quite as large as we saw in July.
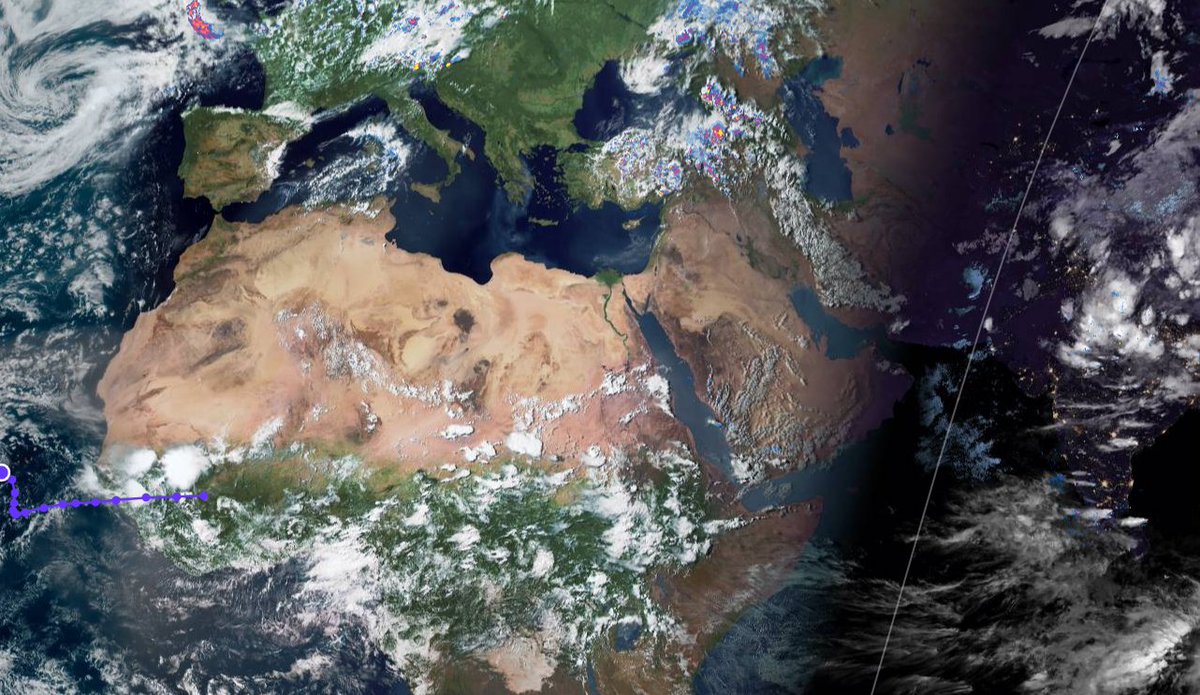
Water is transiting in both directions over the the Sahara in huge volumes. Rainfall tends to be higher at night based on these satellite images.
Meanwhile the high levels of water transit east-west have finally brought about conditions for the Atlantic Hurricane season to commence. For most of this summer there has been very little storm formation activity in the usual tropical zone because it has been unusually dry.
Finally for #NorthAfrica we have the long-range 16-day (GFS) and 12-day (KMA) forecasts both of which continue to show significant rain in arid parts of the Sahara in Mali.


These satellite pictures are from a couple of days ago. The first shows the #GERD lake which other higher-resolution satellite photography released today has reached 600ms above-sea-level, higher than the dam face itself, suggesting very high flow levels over the cascade.


Today's August 8th 10-day rainfall forecasts for #Ethiopia (+1 12-day from KMA) and the #HornOfAfrica: #Somalia, #Somaliland, east #SouthSudan, south-east parts of Sudan, #Djbouti and #Eritrea.
Heavy rain is forecast for all significant Nile basins incl. #Abbay & #Tekeze.
Heavy rain is forecast for all significant Nile basins incl. #Abbay & #Tekeze.


48 Hour forecasts (today and tomorrow) from the same three models.
Rainfall intensity appears to have dropped 30-40% from late July peaks when 25mm (1 inch) of rain was consistently falling each day across most of the highlands.
Rainfall intensity appears to have dropped 30-40% from late July peaks when 25mm (1 inch) of rain was consistently falling each day across most of the highlands.


However if the 2nd major Indian monsoon pulse forecast in the GFS model (2nd tweet at the top) develops, then rainfall could return to peak levels towards the end of August.
This graph shows is Nile flow usually peaks in early September, but there can be significant variance between years in the flow contribution from different catchments. This year all catchments appear to be receiving a lot of rain.

This year as those following these bulletins will know there has been rain most days in Western Saudi Arabia since mid April. This does not appear to have stopped or slowed significantly over the last fortnight.
Here we see the same area 1 year apart, Aug 2020 vs Aug 2021.
Here we see the same area 1 year apart, Aug 2020 vs Aug 2021.


And here are similar comparisons for
TOP: Western Sahel (Mali & Mauritania), and
BOTTOM: Central Sahel (Niger and Chad).
The differences are not spectacular yet, and most obvious in Saudi. I will return to look at these later.
TOP: Western Sahel (Mali & Mauritania), and
BOTTOM: Central Sahel (Niger and Chad).
The differences are not spectacular yet, and most obvious in Saudi. I will return to look at these later.


The final forecast segment addresses the #MiddleEast.
August 8th 10-Day accumulated rain forecasts for the #MiddleEast from the GFS, CMC, KMA & ACG weather models.
#ArabianStorms
#KSA #Yemen #Oman #Jordan #Sudan #Iran #Syria #GERD #Sudan #DesertRain #UAE
الله أعلم
August 8th 10-Day accumulated rain forecasts for the #MiddleEast from the GFS, CMC, KMA & ACG weather models.
#ArabianStorms
#KSA #Yemen #Oman #Jordan #Sudan #Iran #Syria #GERD #Sudan #DesertRain #UAE
الله أعلم


@Arab_Storms has been continuing his coverage of flooding around the world of which there has been a great deal. Here are three tweets from his recent postings. Firstly one of Sudan flooding.
https://twitter.com/Arab_Storms/status/1424416172766863362?s=20
Jazan in South West Saudi Arabia has had the most consistent rain including some spectacular storms including this one yesterday..
https://twitter.com/Arab_Storms/status/1424033622982631424?s=20
And Oman waterfalls continue to deliver spectacular cell-phone footage extremely reliably.
https://twitter.com/Arab_Storms/status/1424015678500220931?s=20
48 Hour August 8th (today and tomorrow), accumulated rain forecasts for the #MiddleEast from the GFS, CMC, KMA and ACG weather models.
#ArabianStorms
#KSA #Yemen #Oman #Jordan #Sudan #Iran #Syria #GERD #Sudan #DesertRain
الله أعلم
#ArabianStorms
#KSA #Yemen #Oman #Jordan #Sudan #Iran #Syria #GERD #Sudan #DesertRain
الله أعلم


And finally we have today's long-range #MiddleEast August 8th rainfall forecasts.
The 16-day GFS & GEFS models, the 12 day KMA and the 15 day EPS (Euro ensemble) model forecasts.
الله أعلم
The 16-day GFS & GEFS models, the 12 day KMA and the 15 day EPS (Euro ensemble) model forecasts.
الله أعلم


We now move to a big picture view. North Western Hemisphere zero hour simulation data (i.e. now).
1. Precipitable water PWAT anomaly
2. PWAT (potential rain + energy)
3. MLSP (Mean Sea Level Pressure)
4. 250Hpa (jet stream winds approx 11-15 kms high)
1. Precipitable water PWAT anomaly
2. PWAT (potential rain + energy)
3. MLSP (Mean Sea Level Pressure)
4. 250Hpa (jet stream winds approx 11-15 kms high)


These 4 weather parameters are useful to look at in visualizations to develop understanding if what is happening with our weather.
The Jet-Stream (250Hpa) winds move the water, PWAT shows us where it is and MLSP shows us the pressure contours (analogous to peaks and valleys).
The Jet-Stream (250Hpa) winds move the water, PWAT shows us where it is and MLSP shows us the pressure contours (analogous to peaks and valleys).
Each of these forecasts is 16 days long & this model is superb at the large scale dynamics. Notably in the plot above you see that none of the Atlantic Cyclone candidate systems are expected to develop. If so then this August will be historically quiet.
This is my favourite map as it brings it all together. Also water has mass and momentum, so this is effectively a map showing atmospheric energy.The battering of Europe is relentless. Also, note the water moving south over the Sahara and the #HOA monsoon burst at the end.
This parameter is the hardest to read and get your head around but is extremely significant in what is happening. Thunder storms send water up into the mid atmosphere 10-18kms above us - and these winds carry that water large distances, and can cause freak rain events.
And to complete this bulletin, here is a bit of a recap of the last week in satellite animations. This shows Monday-Tuesday (2-3).
And here we see the same day and night over North Africa, again, 2-3 August.
Here we see the Indian and East African Monsoons on the 4th and 5th of August.
And the corresponding North Africa/Sahara animation for the 4th-5th August.
And finally the 6th to the 7th August, again beginning with the Indian and East African monsoons.
And its North Africa/Sahara 6th-7th August counterpart.
Which gets us up to date.
This is the new format that I plan to use going foward for weekly rain updates until the end of the big rainy season. The rain is actually rather important in relation to the peace issue, as it is not really practical to fight in the rainy season.
This is the new format that I plan to use going foward for weekly rain updates until the end of the big rainy season. The rain is actually rather important in relation to the peace issue, as it is not really practical to fight in the rainy season.
• • •
Missing some Tweet in this thread? You can try to
force a refresh


