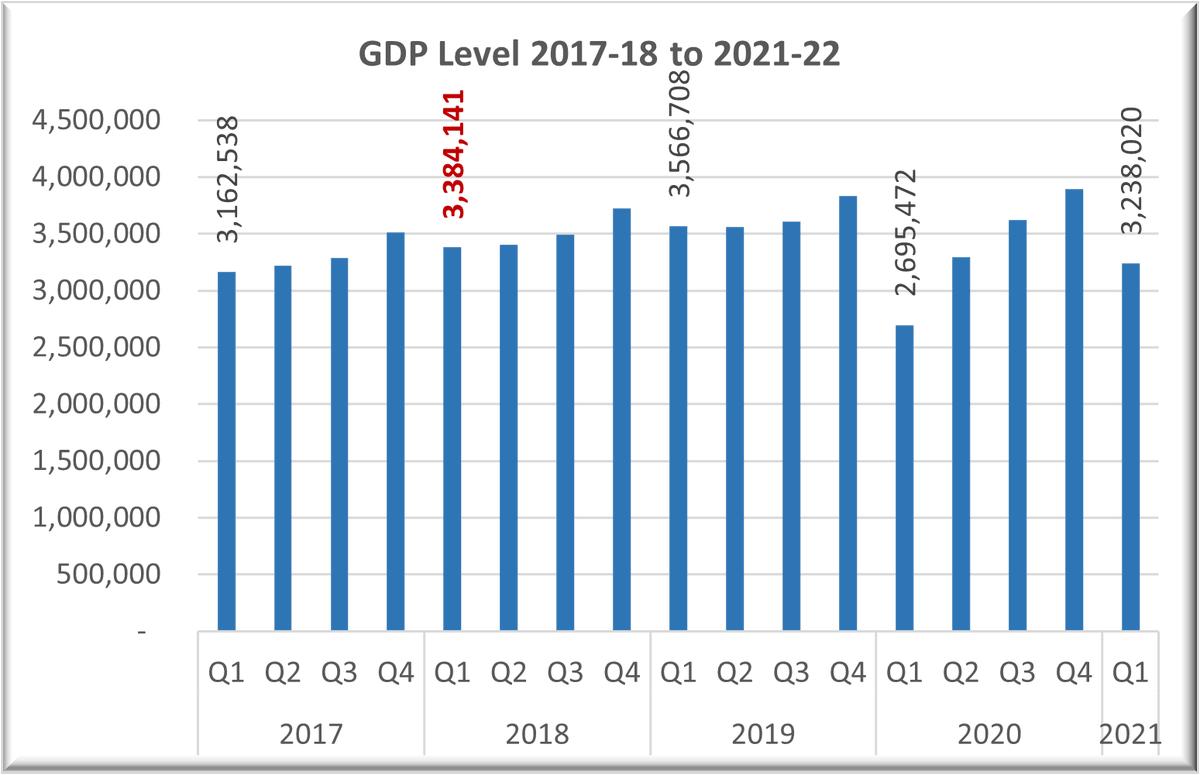
My #MentalModel for assessing India's Market Size
Inspired to share in view of discussion on Ford's exit.
livemint.com/auto-news/the-…
@andymukherjee70 @SahilKapoor @ramakumarr @CafeEconomics @sritara @rishikesha
1. India is low middle-income country with large inequality: Chart
Inspired to share in view of discussion on Ford's exit.
livemint.com/auto-news/the-…
@andymukherjee70 @SahilKapoor @ramakumarr @CafeEconomics @sritara @rishikesha
1. India is low middle-income country with large inequality: Chart

2. Urban India generates 70-75% of GDP. business-standard.com/article/news-c….
3. If I create population-income groups, I get to know that Top 1% of earners have developed country per capita.
4. Middle India's Per Capita is < USD 1,500 or ~100K pa - HH income of < 500K pa
3. If I create population-income groups, I get to know that Top 1% of earners have developed country per capita.
4. Middle India's Per Capita is < USD 1,500 or ~100K pa - HH income of < 500K pa

5. Bottom half earns < USD 500 per annum.
6. Cost of living in India metros (Mumbai, NCR, Bangalore) is close to upper-income countries, adjusted for purchasing power.
6. Cost of living in India metros (Mumbai, NCR, Bangalore) is close to upper-income countries, adjusted for purchasing power.
7. If I am required to compare India with USA and China, I use the same distribution charts that I find very informative to assess the nature of consumption the world's largest economies will have. Both have robust middle-income families. 


@threadreaderapp unroll
8. If we assume top 10% of earners are definite car customers, we have about (33.5 million households - 134.1/4). Some HHs will buy > one car, of course.
9. India has sold 28.2 million cars during last 10 years, with Suzuki and Hyundai selling ~2/3rd of these cars.
9. India has sold 28.2 million cars during last 10 years, with Suzuki and Hyundai selling ~2/3rd of these cars.
10. A follow Q is: If this is the conventional market, how big would the EV market be? and
What would take to build the EV Market?
What would take to build the EV Market?
Hi Aunindyo, here we go. Please do let me know, if I have missed something.
Distribution of Income info is based on estimates by World Inequality Database (wid.world) located at the Paris School of Economics.
@AunindyoC
Distribution of Income info is based on estimates by World Inequality Database (wid.world) located at the Paris School of Economics.
@AunindyoC
Specifically, the distribution for India is based on Indian Human Development Survey by ICPSR-Interuniversity Consortium for Political and Social Research), Household Consumption Expenditure Survey by NSSO and the Income-Tax Tables.
Data for bottom 50% is based on distribution of consumption. Technical note about India estimates is at wid.world/document/india….
The detailed note on methodology is at wid.world/document/distr…
Survey and tax data is interpolated for missing years. Since the survey frequency for India is low, data requires frequent interpolation.
Survey and tax data is interpolated for missing years. Since the survey frequency for India is low, data requires frequent interpolation.
Data from 2014 to 2019 is based on growth-neutral extrapolation, as the latest survey data is for 2012-12.
India charts are available at wid.world/country/india/
India charts are available at wid.world/country/india/
I have used the data for Year 2019 from the Income Inequality Charts that provide information for Top 1%, Top 10%, Middle 40%, Bottom 50% and created new categories, as presented in the Table below. 

To arrive at the cohort specific income, I have used the Gross National Disposable Income at Current Prices from RBI’s Database of the Indian Economy (HBS_Table_No._01) at DBIE-RBI : DATABASE OF INDIAN ECONOMY. Population data too is from the same table.
The exchange rate too is from DBIE (HBS_Table_No._137). I have the average household size to be 4, just as an approximation, it will vary by income cohort for sure. Poorer households are likely to be larger.
During my earlier years, I have used the household consumption expenditure data for India as well as other large countries for studying the consumption patterns and arriving at rough working estimates of the market size.
Hope I have been helpful. I am happy to share some of the processed data if needed.
• • •
Missing some Tweet in this thread? You can try to
force a refresh


