How much has each country contributed to climate change through historical #emissions of #carbon dioxide, #methane and nitrous oxide?
Today, our new 'living' dataset for tracking national contributions to #warming is published in @ScientificData
buff.ly/3lILj8z
Today, our new 'living' dataset for tracking national contributions to #warming is published in @ScientificData
buff.ly/3lILj8z

@ScientificData We provide estimates of the #warming caused by historical #emissions of #CO2, #CH4 and #N2O by 226 countries, for every year since 1850.
National warming contributions are further split into #fossil or #land use, land use change and #forestry (LULUCF) sources.
National warming contributions are further split into #fossil or #land use, land use change and #forestry (LULUCF) sources.

@ScientificData The top contributors to #warming up to 2021, through #emissions of all three gases since 1850, were:
USA: 0.28°C / 17% of the warming caused by all global emissions
China: 0.20°C / 12%
Russia: 0.10°C / 6%
Brazil & India: 0.08°C / 5%
🇮🇩 , 🇩🇪 , 🇬🇧 , 🇯🇵 , 🇨🇦 : 0.03-0.05°C each
USA: 0.28°C / 17% of the warming caused by all global emissions
China: 0.20°C / 12%
Russia: 0.10°C / 6%
Brazil & India: 0.08°C / 5%
🇮🇩 , 🇩🇪 , 🇬🇧 , 🇯🇵 , 🇨🇦 : 0.03-0.05°C each

@ScientificData Of the three gases, global emissions of #CO2 have contributed most to warming (1.11°C, vs. 0.41°C for CH4 and 0.08°C for N2O)
But the importance of #CH4 and #N2O varies across countries with different national circumstances👇
But the importance of #CH4 and #N2O varies across countries with different national circumstances👇

@ScientificData Around half of the world's countries have contributed more to warming through emissions from #LULUCF than through #fossil emissions, e.g.:
Brazil: 79% of the total national contribution to warming relates to LULUCF
Indonesia: 70%
Argentina: 68%
Australia: 54%
Brazil: 79% of the total national contribution to warming relates to LULUCF
Indonesia: 70%
Argentina: 68%
Australia: 54%

@ScientificData The top contributors to warming through #LULUCF emissions alone were:
Brazil: 0.06°C / 11.3% of global LULUCF-induced warming
USA: 0.06°C / 10.8%
🇮🇩 🇮🇳 🇨🇳 : 0.04°C / 6-7% each
Russia: 0.03°C / 4.8%
🇨🇦 , 🇦🇺 , 🇦🇷 a little over 0.01°C each
Brazil: 0.06°C / 11.3% of global LULUCF-induced warming
USA: 0.06°C / 10.8%
🇮🇩 🇮🇳 🇨🇳 : 0.04°C / 6-7% each
Russia: 0.03°C / 4.8%
🇨🇦 , 🇦🇺 , 🇦🇷 a little over 0.01°C each

@ScientificData #CO2, #CH4 and #N2O are the three gases that feature in ~90% of Nationally Determined Contributions (NDCs) - climate action plans to cut emissions under the Paris Agreement.
Our dataset can be used to track change in national contributions in an era of climate policy, e.g. 👇
Our dataset can be used to track change in national contributions in an era of climate policy, e.g. 👇
@ScientificData Since the @UNFCCC formed at the Earth Summit in Rio de Janeiro in 1992, the contribution of the four industrialising “BASIC” countries to total warming rose from 16.6% to 23% in 2021
China: 7.2% ↗️ 12.3%
India: 4.2% ↗️ 4.8%
Indonesia: 2.8% ↗️ 3.4%
Brazil: 4.4% ↗️ 4.9%
China: 7.2% ↗️ 12.3%
India: 4.2% ↗️ 4.8%
Indonesia: 2.8% ↗️ 3.4%
Brazil: 4.4% ↗️ 4.9%

@ScientificData @UNFCCC Meanwhile, the contribution of the industrialised OECD countries fell from 46.6% to 39.8%
USA: 20.8% ↘️ 17.3%
Russia: 7.8% ↘️ 6.1%
EU27: 13.0% ↘️ 10.4%
👉 Since 1992, warming caused by rising emissions from industrialising nations has outpaced the early-industrialisers
USA: 20.8% ↘️ 17.3%
Russia: 7.8% ↘️ 6.1%
EU27: 13.0% ↘️ 10.4%
👉 Since 1992, warming caused by rising emissions from industrialising nations has outpaced the early-industrialisers

@ScientificData @UNFCCC Our dataset is 'living' because it will be updated at least annually at buff.ly/3KciU3Z
In future, we hope to see the #warming contributions by all countries level off, with no new additions to warming year-on-year once #NetZero is reached
In future, we hope to see the #warming contributions by all countries level off, with no new additions to warming year-on-year once #NetZero is reached
@ScientificData @UNFCCC The open-access paper is here: buff.ly/3lILj8z
Huge thanks to all the co-authors for their contributions to this exciting work. Including @Peters_Glen @robbie_andrew @JoGuetschow @PFriedling @clequere , and those not on Twitter
Huge thanks to all the co-authors for their contributions to this exciting work. Including @Peters_Glen @robbie_andrew @JoGuetschow @PFriedling @clequere , and those not on Twitter
@ScientificData @UNFCCC @Peters_Glen @robbie_andrew @JoGuetschow @PFriedling @clequere Thanks to @HorizonEU for funding the @V_ERIFY_H2020 and to @NERCscience for generously funding my ongoing research on the C cycle and climate change with the @gcarbonproject
FAO: @TyndallCentre @ClimateUEA_ @ueaenv @UEAResearch
FAO: @TyndallCentre @ClimateUEA_ @ueaenv @UEAResearch
@ScientificData @UNFCCC @Peters_Glen @robbie_andrew @JoGuetschow @PFriedling @clequere @HorizonEU @V_ERIFY_H2020 @NERCscience @gcarbonproject @TyndallCentre @ClimateUEA_ @ueaenv @UEAResearch Methods in brief
(1) CO2 emissions data from @gcarbonproject @robbie_andrew
(2) CH4 & N2O emissions data from @PIK_Climate PRIMAP @JoGuetschow . CO2-equivalent emissions calculated using central @IPCC_CH values of global warming potential (100 year horizon). GWP* for CH4.
(1) CO2 emissions data from @gcarbonproject @robbie_andrew
(2) CH4 & N2O emissions data from @PIK_Climate PRIMAP @JoGuetschow . CO2-equivalent emissions calculated using central @IPCC_CH values of global warming potential (100 year horizon). GWP* for CH4.

@ScientificData @UNFCCC @Peters_Glen @robbie_andrew @JoGuetschow @PFriedling @clequere @HorizonEU @V_ERIFY_H2020 @NERCscience @gcarbonproject @TyndallCentre @ClimateUEA_ @ueaenv @UEAResearch @PIK_Climate @IPCC_CH (3) Then, we calculated the warming caused by all CO2-equivalent emissions using the @IPCC_CH central estimates of the warming per unit CO2 -- 0.45 °C per trillion tonnes of CO2.
See the paper for full details.
See the paper for full details.

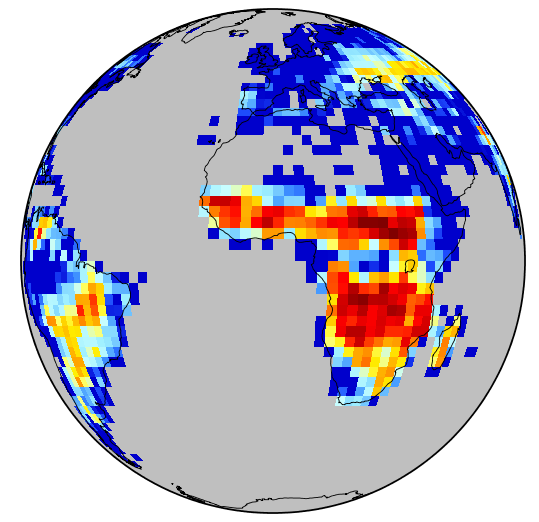
Agh, sorry, wrong map ... here's the right one:

• • •
Missing some Tweet in this thread? You can try to
force a refresh