1. CPI #Inflation increased by 0.12% in May, surprising consensus expectations of 0.1%. This print contributed to a sequential deceleration in the quarterly trend relative to the yearly trend.
2. Above we show the monthly evolution of the data relative to its 12-monthly trend and consensus expectations.
3. At the subcomponent level, the primary drivers of this print were #Motor fuel (-0.2%), #Energy Services (-0.05%), Transportation Commodities Less Motor Fuel (0.11%), #Shelter (0.19%), & #Transportation Services (0.05%). Below, we show the top 10 drivers of the monthly change:
4. Over the last year, Food at Home (0.5%), #Food Away from Home (0.4%), #Motor fuel (-0.71%), #Shelter (2.77%), & #Transportation Services (0.61%). have been the primary drivers of the 4.13% CPI #inflation. We show this below:
5. Alongside these big-picture drivers, we think it is important to note that we are seeing deflation in a few areas of the economy now. The industries currently seeing deflation are Fuel Oil, Motor fuel, Education & Communication Commodities, and Alcoholic Beverages.
6. We think it is important to note that excluding #food and energy, i.e., core CPI, was up 0.40% this month— implying a 4.9% annualized rate for core inflation. This data is far removed from the #Fed’s objective.
7. We've already highlighted what the implications of this move have meant for Treasuries.
8. Overall, we reiterate that inflationary dynamics continue to create a challenging dynamic for Treasuries, and the disinflationary pricing that supported 60/40 portfolio in H1 2023 is likely to dissipate in H2 2023 as markets come to terms with potential #inflation entrenchment
• • •
Missing some Tweet in this thread? You can try to
force a refresh
1. CPI Inflation increased by 0.12% in May, surprising consensus expectations of 0.1%. This print contributed to a sequential deceleration in the quarterly trend relative to the yearly trend.
2. However, we think it is important to note that excluding food and energy, i.e., core CPI, was up 0.40% this month— implying a 4.9% annualized rate for core inflation. This data is far removed from the Fed’s objective.
3. As such, #bond markets have moved to re-#discount expectations, moving away from aggressive expectations of easing, consistent with our views outlined in our Month In Macro note. We show this below:
1. #CPI data came out largely in line with our expectations. Our expectations were for a print of 0.17%, while the print came in at 0.10%. Below, we show the composition of our estimates relative to the realized print:
2. Our pre-view note mentioned two factors we would be watching out for. First, we were looking to see whether #motor vehicle inflation remains persistent.
3. Given the industry dynamics we monitor, there was a potential for new cars to see deflation as manufacturing productions alleviate some degree of supply shortages. Nonetheless, #used car inflation likely showed significant potential to re-accelerate this month.
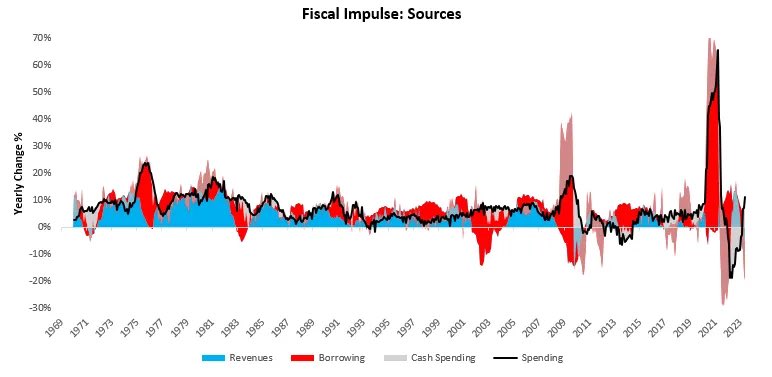
1/ Fiscal spending has been a support to GDP as shown below. We are likely approaching the peak of this fiscal impulse. With increased borrowing, somewhat offset by expected increase in cash balance, fiscal spending is likely to be less supportive of GDP:
2/ Fiscal spending can come from one of three places. Existing cash, new borrowing, or revenues. So far, cash spending has dominated:
1. Recently we examined the latest data on US #government spending, i..e, US #fiscal impulse. Monthly spending data from the government contains significant #volatility; therefore, we apply a smoothing process to extract spending trends in government data.
2. Above, we show our estimates of the monthly changes in US government spending. We decompose this spending into its sources, i.e., government revenues, borrowing, and cash balances.
3. Our latest estimates for government spending in May saw spending rise by 1%, primarily driven by decreases in government cash balances.
Missed out anything from a week full of #Macro & #Markets? Don't worry - we got you covered.
Below we share all the updates & opinions threads from last week. Make sure to follow @prometheusmacro for much more.
1. We started the week by sharing updates on the latest #construction data. Overall, we noted that residential construction spending improved recently, that also flowed into our GDP Nowcast and real GDP estimate.
1. Nominal #GDP slowed through April, with real GDP contracting by -0.47% and #inflation rising by 0.23%. #Nominal GDP has grown approximately 4.7% from one year prior, continuing the downtrend beginning in February 2022.
2. During this time, #equity markets have posed significant strength (though lopsided), while #treasury markets have weakened in unison.
3. Looking forward, these sequential improvements have adjusted our #real growth outlook, with a #contraction in yearly real GDP growth more likely in H1 2024 than in Q4 2023. Our #inflation outlook remains one of resilient inflation.