1/ This is the Gym Theory of Markets. It is a diagram to help identify and explain the groups that act on price in markets (especially BTC). Imagine this as an actual gym, with a line down the middle and 2 doors (both on the sell/cash side of the gym). Imagine the dots are people 
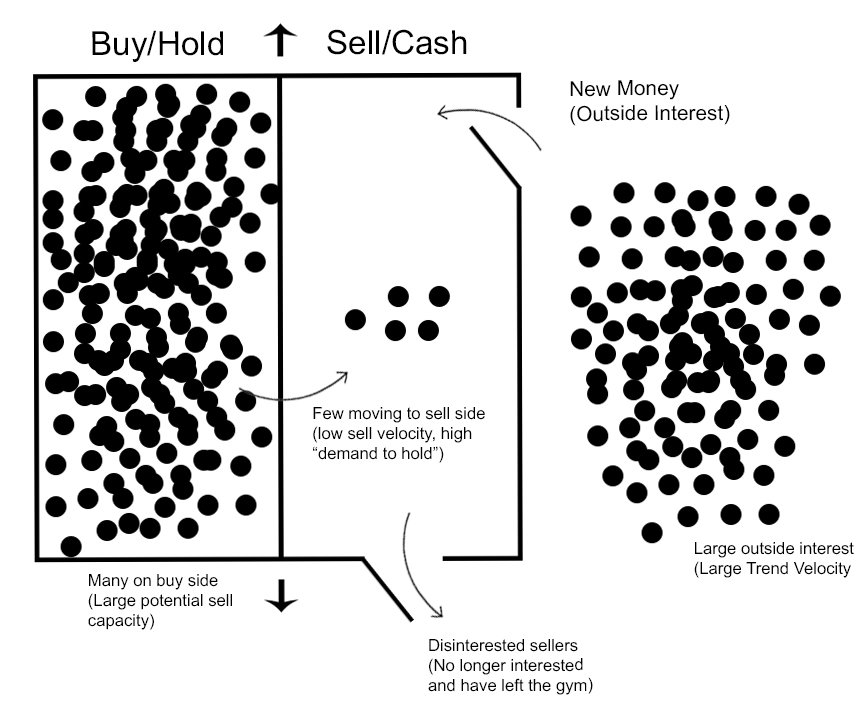
2/ People enter the gym first by being in cash (entering through the door and sitting on the sell/cash side). When they move to the buy side, price increases. When those on the buy/hold side move to the sell side, price decreases.
3/ How fast they come through the door and go to the buy side defines the long-term trend of the asset. I would argue Bitcoin has one of the greatest trend velocities in all assets, maybe in history. As well, the buyers have one of the highest "demand to hold" and don't sell.
4/ When a dip happens, a small amount of short-term traders (low "demand to hold") move to the sell side. But if you could visual this group you'd be able to see it's very small. Getting scared during these events is unwise, because trend velocity and TDH is extreme.
5/ BCH doesn't have much trend velocity, it just has a few deep pocketed players moving from BTC to BCH (Ver, Jihan, Falkvinge, Wright, etc), it also doesn't have a high TDH. This is why it's behaviour will be extremely volatile. People will get burned and leave the gym.
6/ Actual trend velocity those interested in the utility from payments is low, it's not a big need in developed society. This is why payment oriented cryptos don't have parabolic trends. They have pump and dump behavior. The interest outside the gym just isn't there.
7/ In summary, BTC has likely the highest trend velocity and potential velocity as almost all of society is a potential buyer (especially w/ low interest rate environment and its negative returns/profits when inflation adjusted). With HODL it means almost vertical price pressure
8/ This theory can be used as context for technical analysis. It helps clarify quality of trends, volume reversals, whipsaws, etc. You just imagine what the people are doing, and match technical patterns to their behaviour. Also, TDH = "Total Demand to Hold" that wasn't clear.