I’ve peer reviewed A LOT of meta-analyses over the past few years. While I’ve noticed that the overall quality of meta-analyses are improving, many that I review suffer from the same issues. Here’s a thread listing the most common problems and how to avoid them
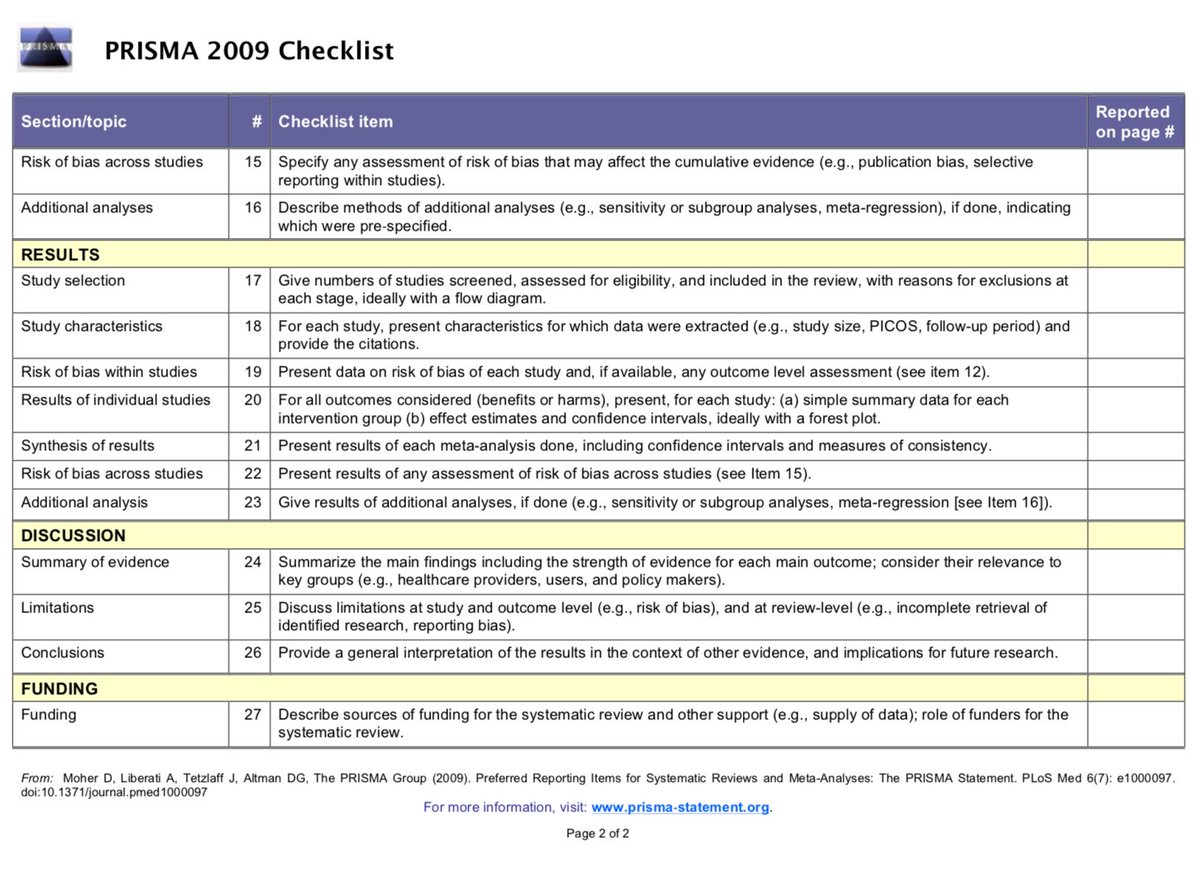
#1 Not using PRISMA reporting guidelines (or stating that PRISMA guidelines were followed, but not *actually* following them).
prisma-statement.org/Default.aspx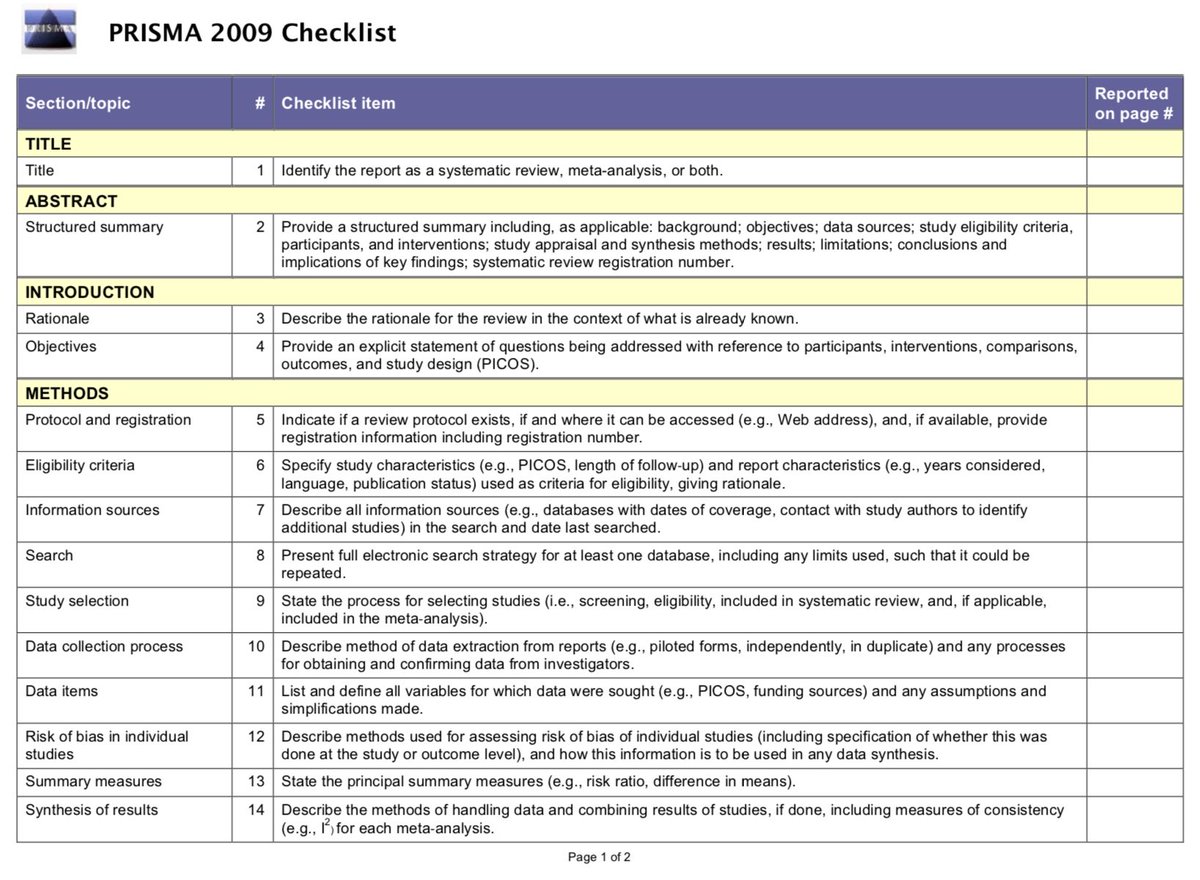
prisma-statement.org/Default.aspx
These guidelines provide a framework for the transparent reporting of meta-analysis, which can help the reader assess the strengths/weaknesses of a meta-analysis.
A checklist item that is rarely completed is #5: (protocol and registration). Notice the flexibility in the language, that you need to state *if* a review protocol exists, and where it can be accessed, and, if available, provide registration information.
In other words, you don’t have to pre-registered to adhere to PRISMA, but if you haven’t posted a protocol/registration you need to state this.
Obviously, meta-analyses should be pre-registered. There are HUNDREDS of potential decisions when it comes to inclusion/exclusion criteria, statistical analysis, and which moderators to include. I see a lot of meta-analyses that seem to hover around p = 0.04.
All it takes is a small tweak of inclusion/exclusion criteria to knock out a study which tips a p value to fall under 0.05…
Pre-registration guards against both conscious and unconscious biases. Another option is reporting a meta-analysis using a registered report format. Here’s a list of journals that offer this docs.google.com/spreadsheets/d…
If you’re unfamiliar with the registered report format, have a listen to the latest @hertzpodcast episode with @chrisdc77, where Chris outlines the benefits of registered reports (here’s a preview) soundcloud.com/everything-her…
PROSPERO can be used to register biomedical outcomes, but you can also post a protocol on @OSFramework or @thePeerJ preprints. Check out the PRISMA-P guidelines for reporting a protocol prisma-statement.org/Extensions/Pro…
Remember, it’s ok to deviate from your original plan. In fact, I’d be surprised if you didn’t deviate as there are many things you can’t anticipate until you perform the meta-analysis. Just report which parts of the analysis deviated and why - the key is transparency
#2 Confusing publication bias with small study bias.
Asymmetry in funnel plots should not be used to make conclusions on the risk of publication bias. Check out what Peters and colleagues have to say on this ncbi.nlm.nih.gov/pubmed/18538991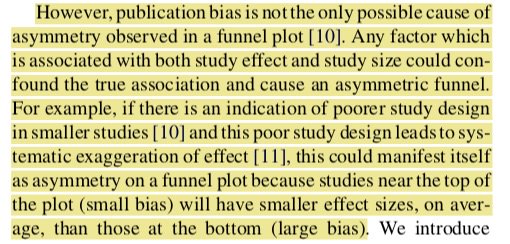
Asymmetry in funnel plots should not be used to make conclusions on the risk of publication bias. Check out what Peters and colleagues have to say on this ncbi.nlm.nih.gov/pubmed/18538991
To illustrate, let’s have a look at this contour-enhanced funnel plot. This is a variation of a typical funnel plot, which is centered on 0, with the light grey region capturing p values between .1 and .05, and the dark grey region capturing p values between .05 and .01 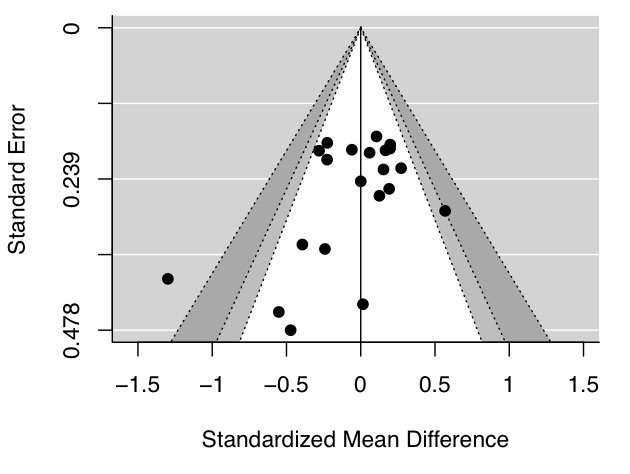
There’s some asymmetry in this plot. But notice that there are no studies in the left hand significance contours and that “missing studies” (pink dots) probably lie within the white “non-significant” white region. This suggests that there are other sources of asymmetry 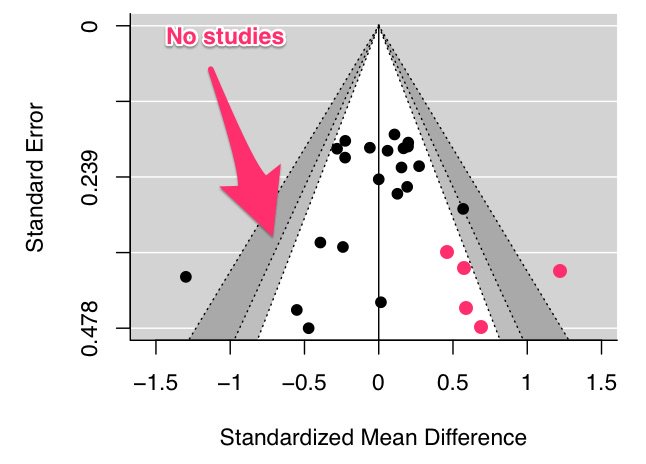
#3 Using the trim and fill procedure to make inferences
Ah, this old chestnut. This method adjusts a meta-analysis by imputing “missing” studies to increase plot symmetry. Here’s the method in action, with the white studies added in the right panel to balance out the plot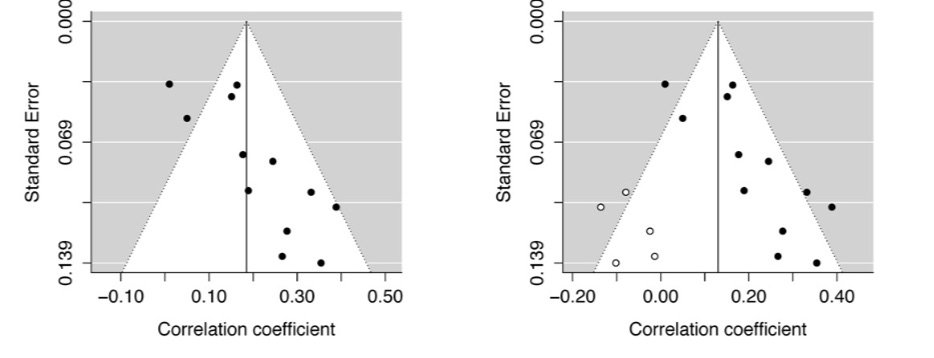
Ah, this old chestnut. This method adjusts a meta-analysis by imputing “missing” studies to increase plot symmetry. Here’s the method in action, with the white studies added in the right panel to balance out the plot
A meta-analysis with imputed studies should not be used to form conclusions – these are not real studies and should only be used as a sensitivity analysis to assess the potential impact of these HYPOTHETICAL studies on the summary effect size.
#4 Not accounting for effect size dependencies
Two effect sizes extracted from the same study are statistically dependent, which can lead to inaccuracies in summary effect size calculation.
Two effect sizes extracted from the same study are statistically dependent, which can lead to inaccuracies in summary effect size calculation.
If effect size covariance is known this can be included in models to adjust for dependency. However, without access to original datasets, the covariance between effect size estimates of included studies is rarely available, as covariances are seldom reported.
Open data would solve this, but that’s another discussion… You can try and guess covariance, but this can be a shot in the dark. One alternative is to use cluster-robust variance estimators. Check out @jepusto's “clubSandwich" #Rstats package github.com/jepusto/clubSa…
#5 Not using transparent analysis
Unlike primary research, meta-analyses can be reproduced in many cases as summary effects sizes, and a corresponding measure of variance, are typically reported in a table.
Unlike primary research, meta-analyses can be reproduced in many cases as summary effects sizes, and a corresponding measure of variance, are typically reported in a table.
However, the researcher is required to manually extract all these values and typically make a few guesses as to how the meta-analysis was performed (e.g., which estimator was used for residual heterogeneity - this often isn’t reported)
As the majority of meta-analysis use publicaly available data, there are no privacy concerns for reporting data. Thus, data should included with the paper or posted online on @OSFramework, or somewhere similar
Despite their website using stock photos from the 90s, Comprehensive Meta-Analysis (CMA) is a good point-and-click package (if you can shell out $495 PER YEAR for the pro version). However, researchers almost never provide enough information to reproduce CMA analyses 
Performing your meta-analysis in #Rstats means that you can easily share the script. Check out @wviechtb's EXCELLENT metafor package metafor-project.org/doku.php/metaf… If you have don’t know how to use #Rstats, it’s worth it just for metafor alone.
If you want to perform a reproducible point-and-click meta-analysis, you can use @kylehamilton’s MAJOR meta-analysis module in JAMOVA, and then export the syntax github.com/kylehamilton/M…
I learnt metafor by working through all the analysis examples on the metafor website and reading tons of metafor posts on stackexchage and the R Special Interest Group for Meta-Analysis mailing list stat.ethz.ch/mailman/listin…
#6 Concluding that effects differ when one effect is significant (P < 0.05) but the other is not (P > 0.05).
This often happens when comparing two summary effect sizes. You need to make a formal comparison rather then just relying on p-values.
This often happens when comparing two summary effect sizes. You need to make a formal comparison rather then just relying on p-values.
Small quibble #1: Not adjusting forest plot axes.
If these aren’t adjusted properly, then some confidence intervals can be chopped off, which can inadvertently (or not) ‘hide’ outliers.
If these aren’t adjusted properly, then some confidence intervals can be chopped off, which can inadvertently (or not) ‘hide’ outliers.
Small quibble #2: Not assessing and/or addressing outliers.
As far as I know there’s no gold standard test for outliers in meta-analysis (but check out the outlier function in metafor). But check out your forest plot for anything out of the ordinary.
As far as I know there’s no gold standard test for outliers in meta-analysis (but check out the outlier function in metafor). But check out your forest plot for anything out of the ordinary.
First, is there a typo? Have you mixed up SE and SD when extracting data? Once confirming that the effect is “real”, perform a leave one out sensitivity analysis to demonstrate your outcome doesn’t rely on one outlier
Ok, I better stop now. My wife, who is due to give birth any day now, is waiting for breakfast AND I haven’t taken the dog out to pee for awhile. Let me know other common problems that I’ve missed.
A few people have been asking if there’s a way to save this thread or to cite it. @scotmorrsn was nice enough to make it into a ‘moment’ twitter.com/i/moments/9602… I also mention a few of these ideas in this paper frontiersin.org/articles/10.33…