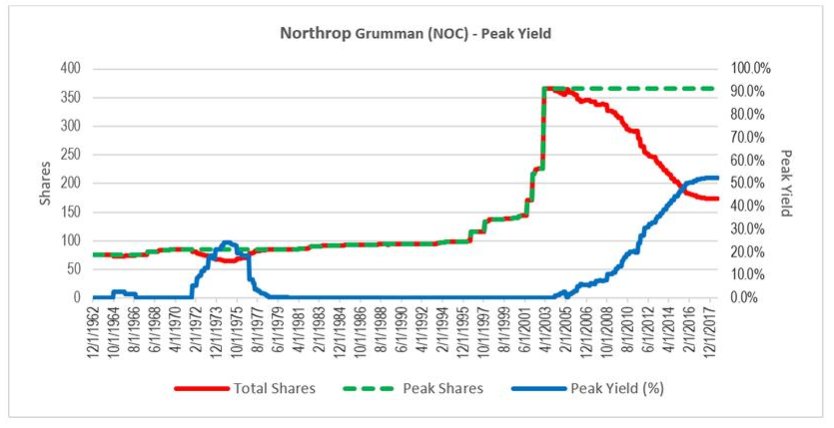
1/ Peak yield is a new statistic we are tracking which measures what percent of shares outstanding a company has repurchased since its share peak.
Here is NOC as an example: they’ve bought back ~50% of shares over the last 15 years.
Here is NOC as an example: they’ve bought back ~50% of shares over the last 15 years.
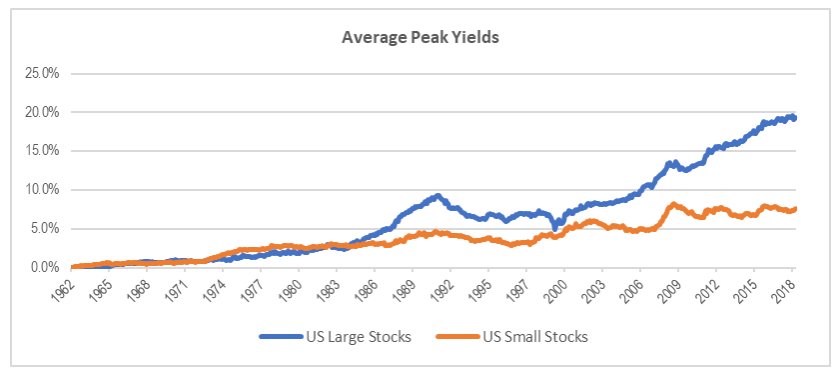
2/ When applied to the entire market, the average peak yield for large and small stocks is ~20% and ~7.5% respectively (this includes stocks still at their peak, which registers as a peak yield of 0).
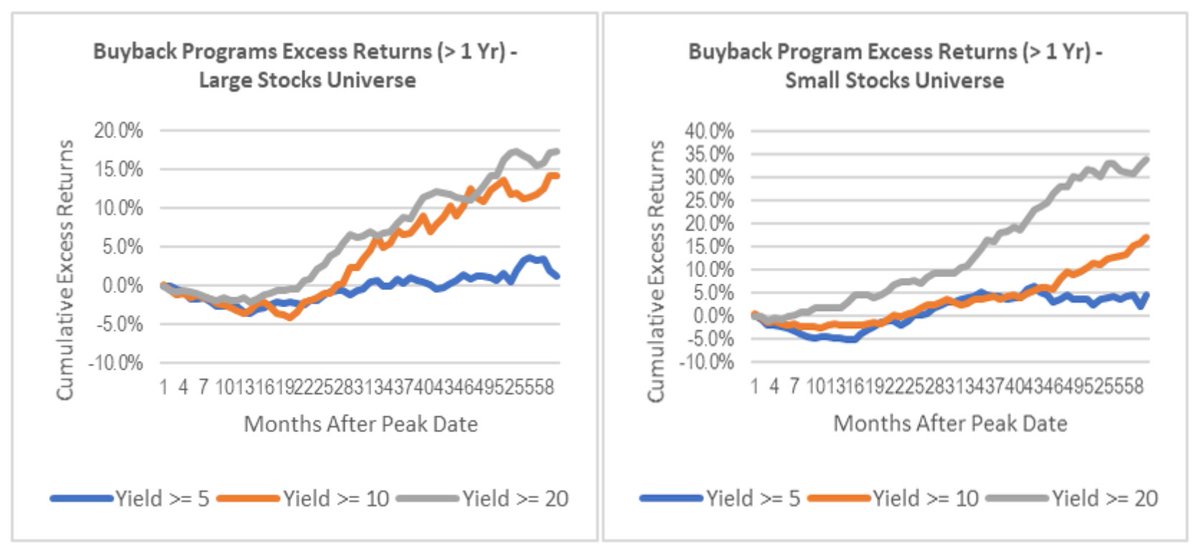
3/ The magnitude of the full buyback program has been related to coincident excess returns: larger share reduction --> better returns as the buybacks were happening.
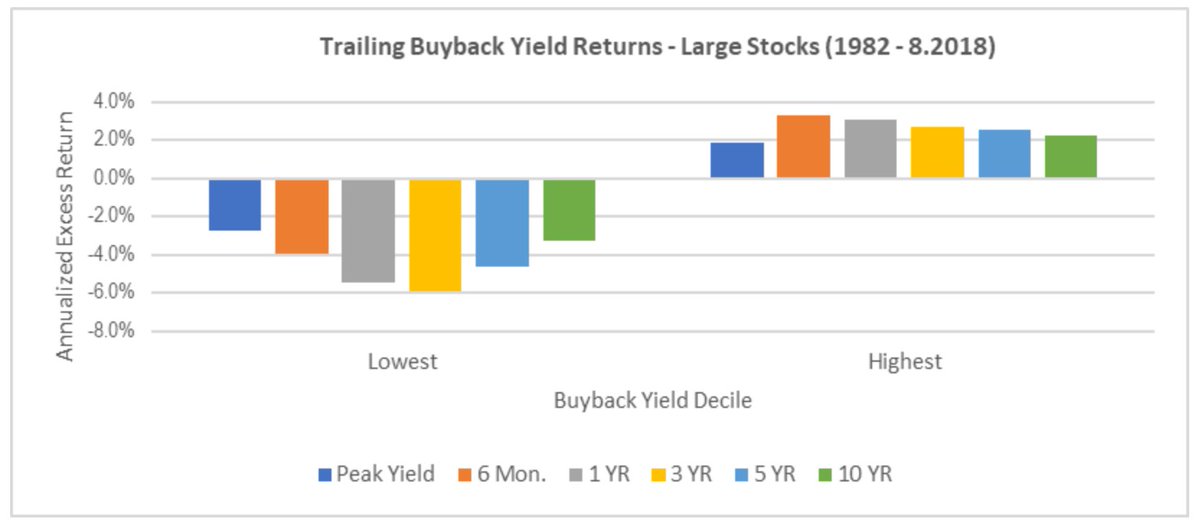
4/ But so what? We care about future returns after a signal, not returns coincident with a signal.
Here, too, buybacks shine. Every trailing measure of the buyback factor, looking back 6 months all the way to 10 years, has led to excess returns.
Here, too, buybacks shine. Every trailing measure of the buyback factor, looking back 6 months all the way to 10 years, has led to excess returns.
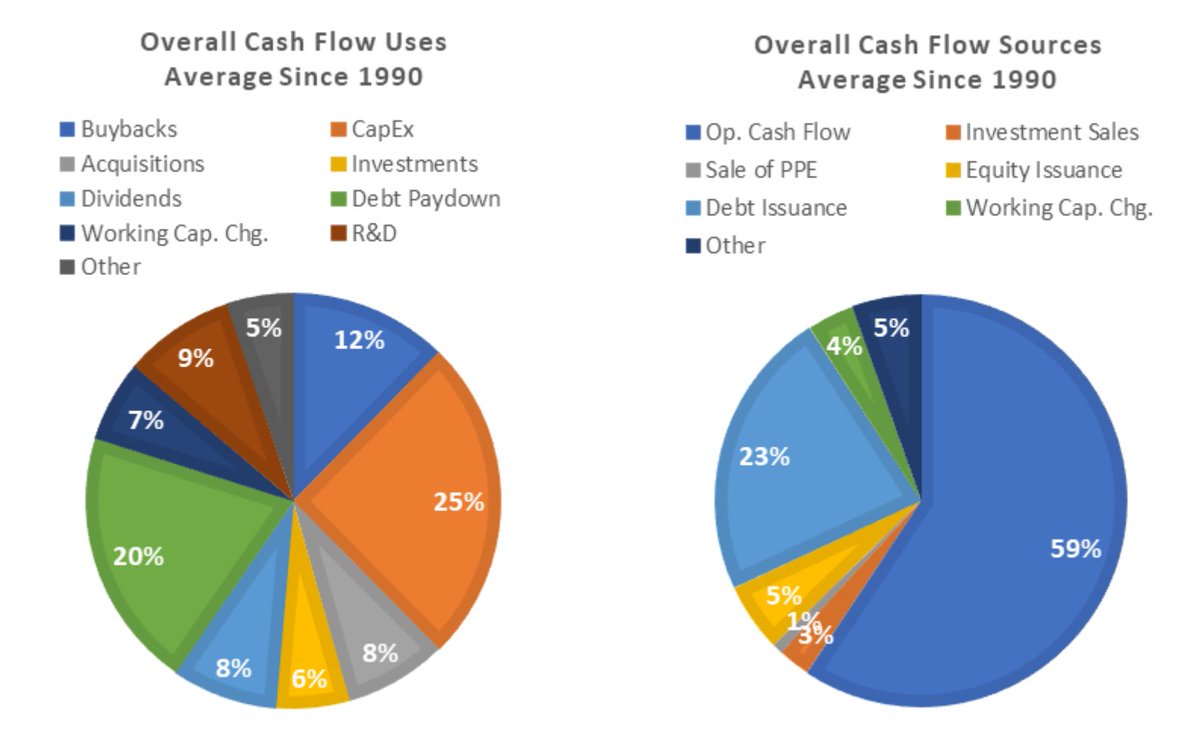
5/ More interesting to us are sources of alpha within the buyback factor. Buybacks are just one option for capital allocation. The sources and uses of capital determine a lot about a company and stock. Here are the average uses and sources of CASH since 1990:
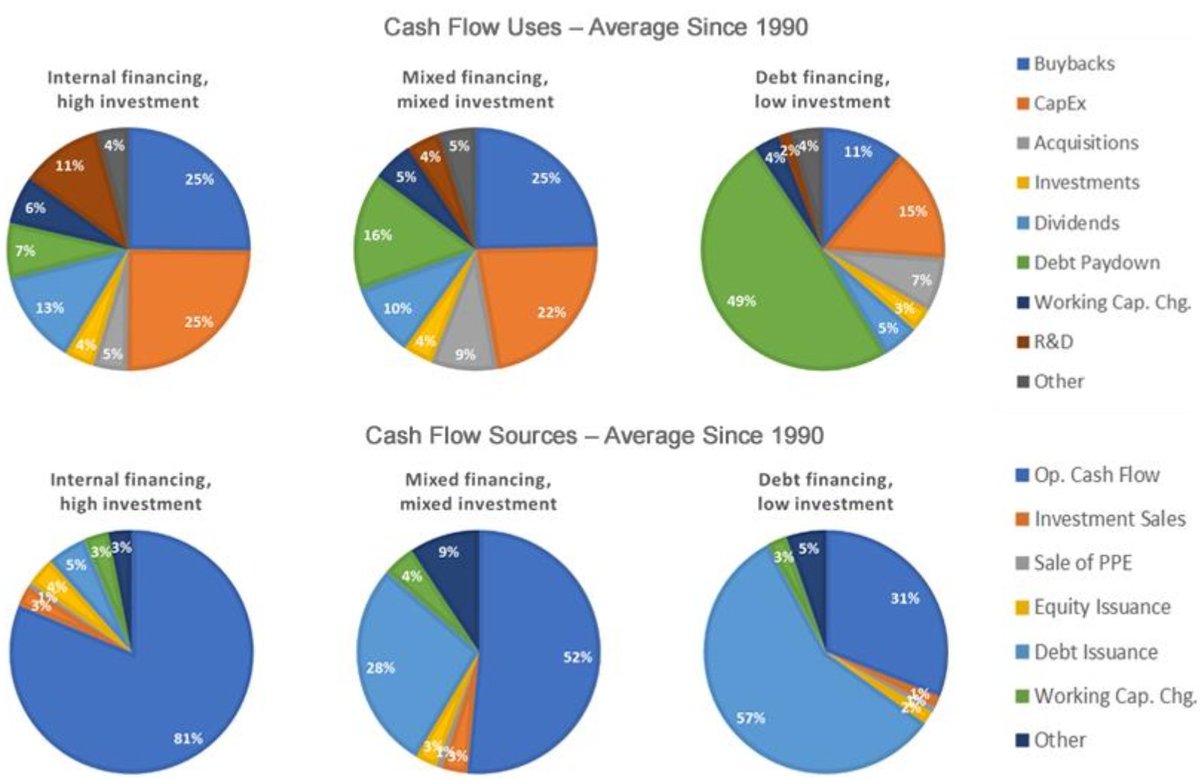
6/ We always like to follow the cash. Among high buyback firms we use statistical clustering to identify 3 most common capital sourcing and allocation strategies among firms. The resulting clusters are defined by their financing (internal vs. ext) and investment (high to low).
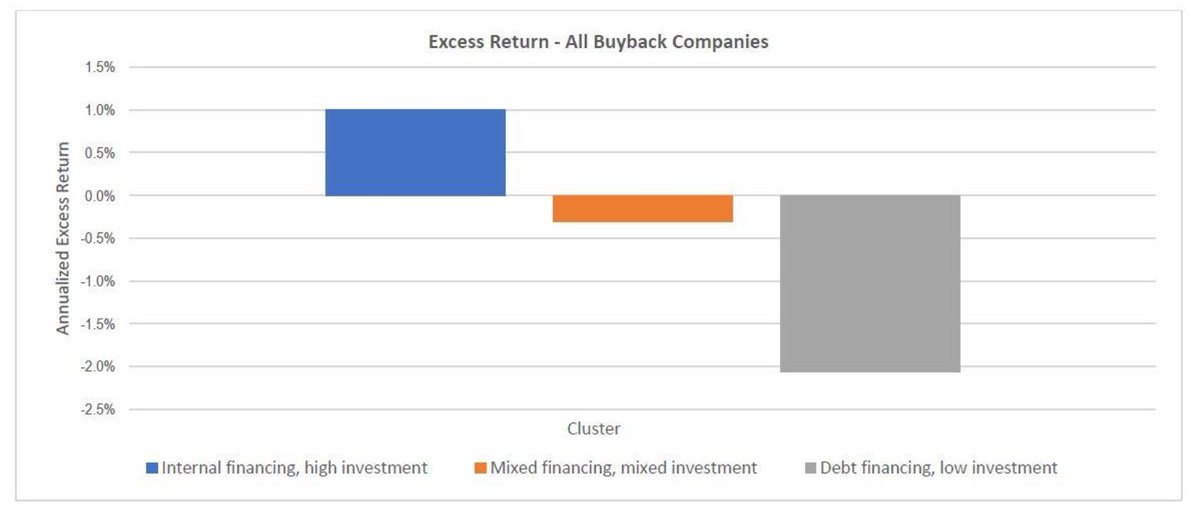
7/ Interestingly, these clusters all trade at similar valuations on average, despite wildly different capital strategies. But despite similar valuations, they deliver different returns (shown here as excess returns vs. all companies buying back stock).
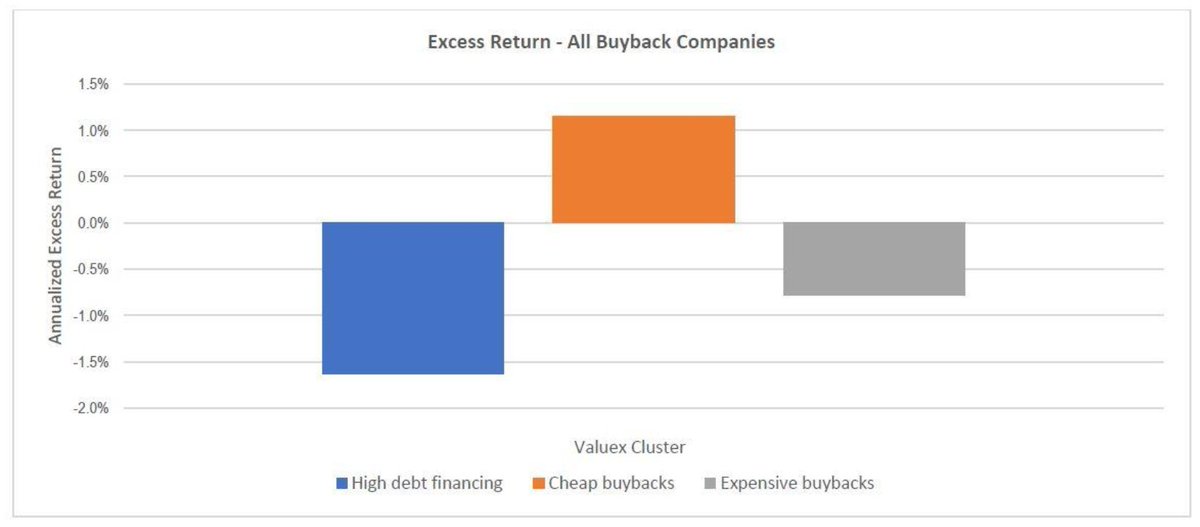
8/ If we modify the clustering to include prevailing valuation, we get different groupings: 1) high debt financing, 2) expensive buybacks and 3) cheap buybacks. Now, the best results come from cheap buybacks and the worst from high debt financing cluster.
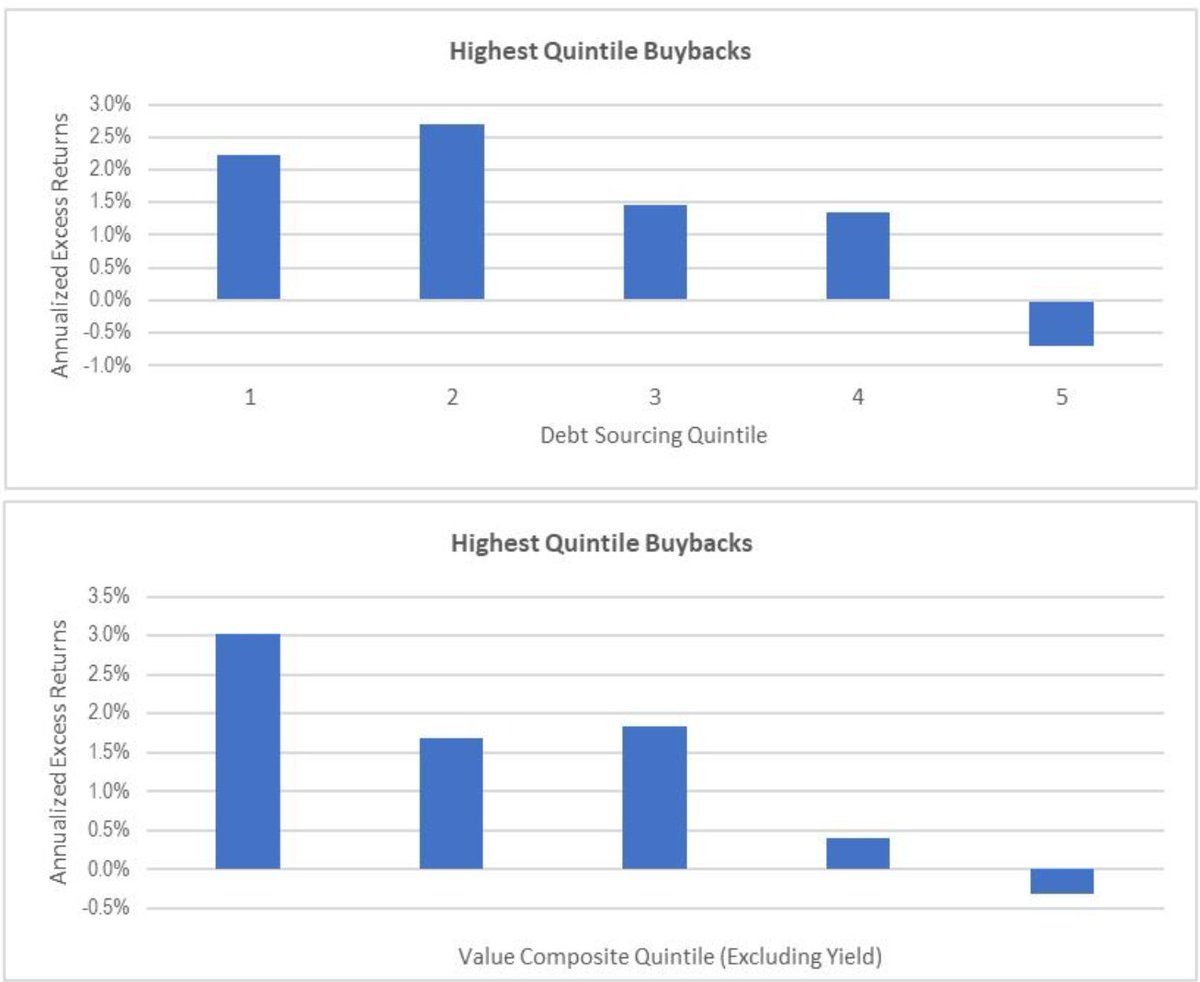
9/ Running separate, more traditional two factor tests, we see that within the highest quintile of buybacks, debt capital sourcing and valuation as two factors provide more return differentiation. We view this as a source of “alpha within factors”
10/ These examples are intentionally simple to prove a point. Buybacks, or value, or momentum have demonstrated advantages. But the performance of stocks within those categories has depended on many other variables.
11/11 Dispersion of returns within factors is wide. Research into what drives that dispersion is the next stage of factor investing.
More here: osam.com/Commentary/osa…
More here: osam.com/Commentary/osa…