Doing a bit of digging into the Chinese trade data.
As @gilliantett noted on Friday, Chinese exports to the US (in the Chinese data) have been doing quite well in the last few months.
Running about $5b a month more than this time last year, and $10b more than this time 2y ago
As @gilliantett noted on Friday, Chinese exports to the US (in the Chinese data) have been doing quite well in the last few months.
Running about $5b a month more than this time last year, and $10b more than this time 2y ago
This is the time of year when China's exports seasonally surge. Pulling out a "pull forward imports ahead of the tariffs" effect is a challenge.
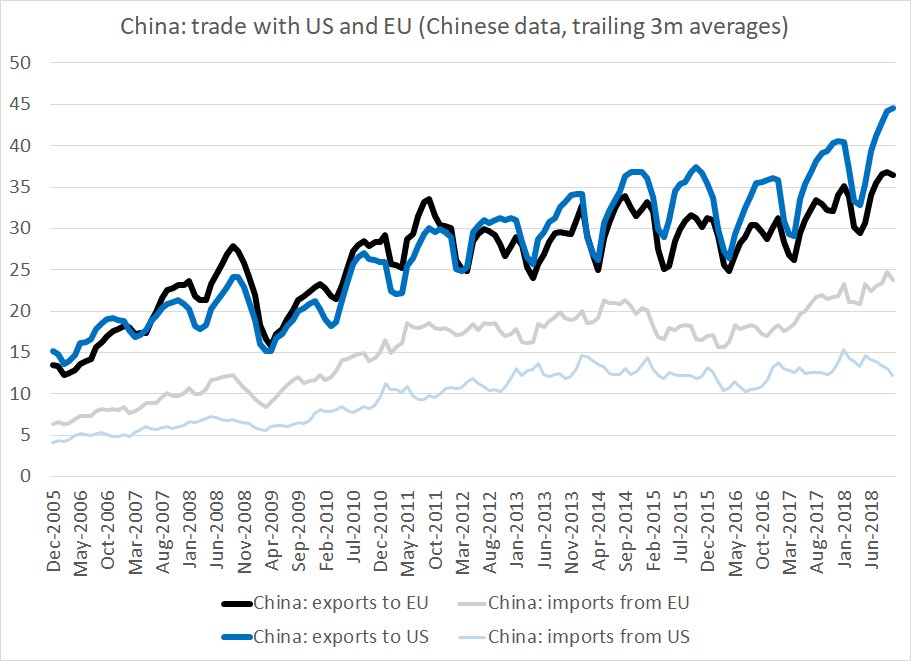
Personally think the aggregate evidence is still modest - look at y.y change in China's exports to Europe (no tariff) v US
Personally think the aggregate evidence is still modest - look at y.y change in China's exports to Europe (no tariff) v US

Also note the 2013 rise in China's exports to HK (HK captures some of China's exports to the US as well as some of China's exports to the emerging world imo). That's what a major distortion looks like. Ended up impacting the trailing 12m sum too ...

For now (and the PMIs suggest there will be a change in the near future), China's exports are growing to pretty much everyone. Chalk that up to rising prices for semiconductors and thus electronics, the lagged impact of the 15/16 CNY move and the broader rebound in trade ...

While imports from the US are dropping fast (they will soon turn negative)

But there is an important caveat. ~ a third of US exports to China are basic commodities. LNG is LNG. Soybeans are soybeans (apart from some differences in protein levels, and harvest seasonality). Tis easier for China to substitute away from US goods than the US from China
Aggregate impact on US will be more modest than the impact on the bilateral balance (which China has tools to influence), tho obviously it hurts the US to have to offer its beans at a discount ...
More worried about the broader trend. US exports to China have grown less rapidly than EU exports since 2014 (see the first chart in the thread). Some of that is commodity prices, but some of that is the strong dollar ...
And the US bilateral balance with China is moving in a different way than the euro area's bilateral balance with China. That's a change from the pre-crisis days.
In this case, the bilateral balance clearly echos broader global trends, so it has information value.
In this case, the bilateral balance clearly echos broader global trends, so it has information value.

For the last chart incidentally I used the US and the euro area data, not the Chinese data. And I added in the balance with HK (for technical reasons, I think this is the best way of viewing the data).
Last point: US data on imports lags a month, so it doesn't have the information content of the October data from China (after the September tariffs, but potentially influenced by beat the January tariff). Doesn't show anything different than the Chinese data tho right now.