,
13 tweets,
5 min read
Read on Twitter
📏 Here's a quick breakdown of how to interpret the field data in PageSpeed Insights, powered by CrUX. (thread) 

The first thing you need to know is that PSI shows results for mobile and desktop. In the BigQuery dataset you'll recognize this as the form_factor.name field where mobile includes both phone and tablet.


The underlying data is not exactly the same as what you'd find in BigQuery with two big differences:
1. Field data is included for individual web pages (in addition to origin-level field data)
2. The data are re-aggregated every day to span the previous 30 days.
1. Field data is included for individual web pages (in addition to origin-level field data)
2. The data are re-aggregated every day to span the previous 30 days.
The "Field Data" section of the report is where you'll find all CrUX data. There are 3 types of information here:
- speed label
- percentiles
- distributions of fast/avg/slow performance
- speed label
- percentiles
- distributions of fast/avg/slow performance

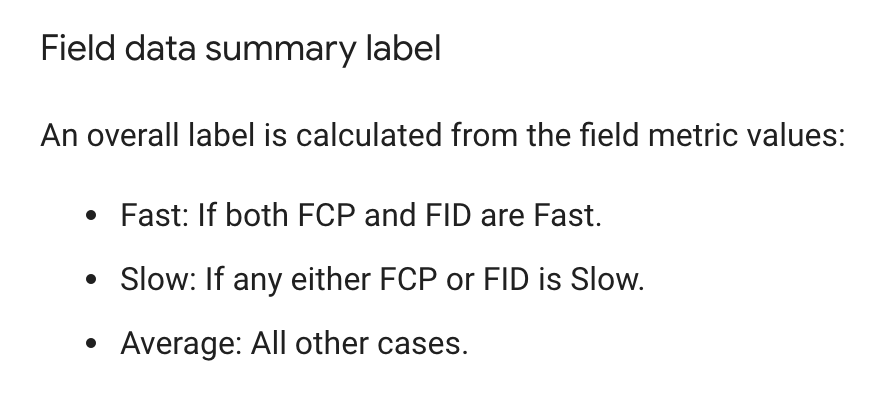
The speed label can be fast, average, or slow. It's based on the FCP and FID speeds. In short, if both metrics are fast, the label is fast. If either metric is slow, the label is slow. Otherwise it's average. For more info see the PSI docs: developers.google.com/speed/docs/ins…

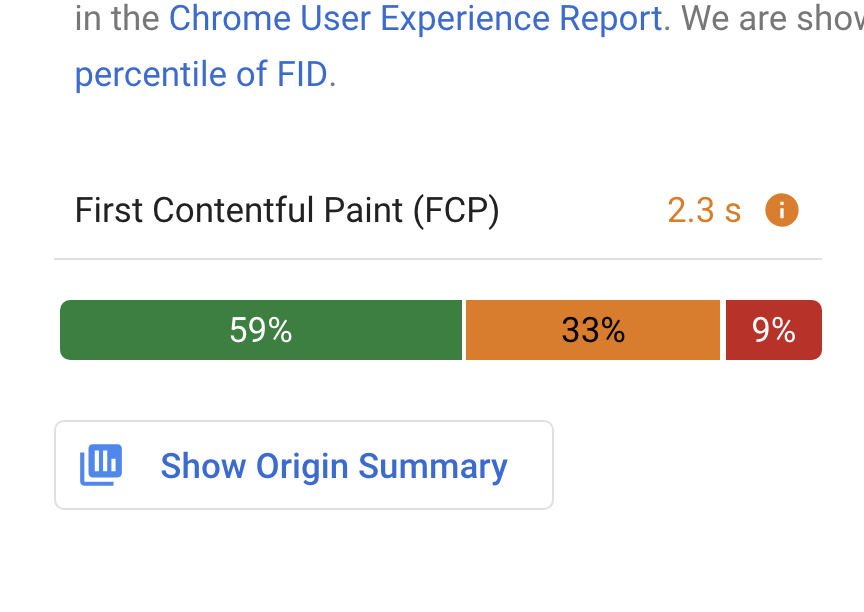
The number next to FCP is the 90th percentile. It will be colored according to its speed. FID uses the 95th percentile.
FCP: fast < 1000ms <= average < 2500ms <= slow
FID: fast < 50ms <= average < 250ms <= slow
FCP: fast < 1000ms <= average < 2500ms <= slow
FID: fast < 50ms <= average < 250ms <= slow

❓ Why 90 and 95th percentiles and not the median (50th)? The PSI docs capture this nicely: "so that developers can understand the most frustrating user experiences on their site"
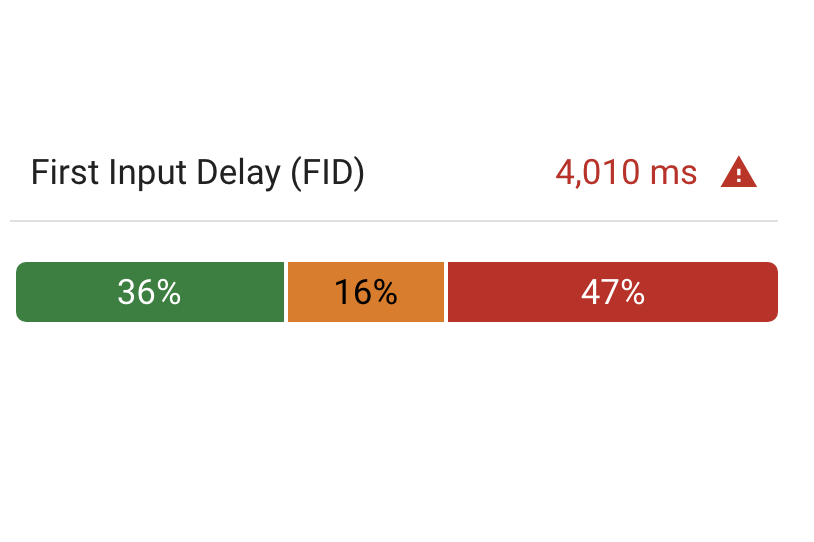
The third data type is the distribution. This is the tri-color bar that visualizes how often users experience fast/average/slow FCP and FID.
We can read this chart as "36% of FID are fast, 16% are average, and 47% are slow".
We can read this chart as "36% of FID are fast, 16% are average, and 47% are slow".
❓ Why would PSI omit field data from the results? CrUX excludes UX data for pages/origins that have too few samples to ensure confidence in the results.
In this example, the news article was just published today and so it hasn't been aggregated yet. It might have data tomorrow.
In this example, the news article was just published today and so it hasn't been aggregated yet. It might have data tomorrow.

All this time we've been looking at the page-level CrUX data. PSI also includes an origin summary.
This captures all UX on all pages for the origin. Remember that http and https are different origins. Same for www or any other subdomain.
This captures all UX on all pages for the origin. Remember that http and https are different origins. Same for www or any other subdomain.

The same data types are available in the origin summary as the page summary. This is helpful if the page you're testing is so new that it doesn't contain any page-level field data yet.
The origin summary is similar to what you'd find in the BigQuery dataset, but remember that PSI is aggregated daily, while the publicly queryable dataset is aggregated monthly. So it's normal to get slightly different results across the tools.
That's it! If you want to learn more about using CrUX on PSI you can check out this guide at web.dev/chrome-ux-repo…
(end)
(end)