
Let me make a super short [THREAD] about the little bump in this curve today !
Another useless yet interesting and surprising subject, bringing engineering and aerodynamics into your daily timeline ! 👾🛫#AvGeek
Another useless yet interesting and surprising subject, bringing engineering and aerodynamics into your daily timeline ! 👾🛫#AvGeek

First of all : WHAT is this chart ? It’s the curve representing the True Mach Number linked to the Indicated Mach Number in the T-38(N), taken from the NASA T-38(N) 2003 Flight Manual.

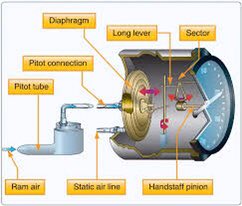
As you know, airspeed is indicated in aircrafts using a Pitot/static system, which I talked about just here :
Now that everybody knows how airspeed is displayed, let’s take a closer look to this curve.
As you can see, it starts indicating our Mach number correctly from Mach 0.2 (Instrument threshold) up to Mach 0.89 ( f(x) -> y = x )
But WHY does it bump ?
As you can see, it starts indicating our Mach number correctly from Mach 0.2 (Instrument threshold) up to Mach 0.89 ( f(x) -> y = x )
But WHY does it bump ?
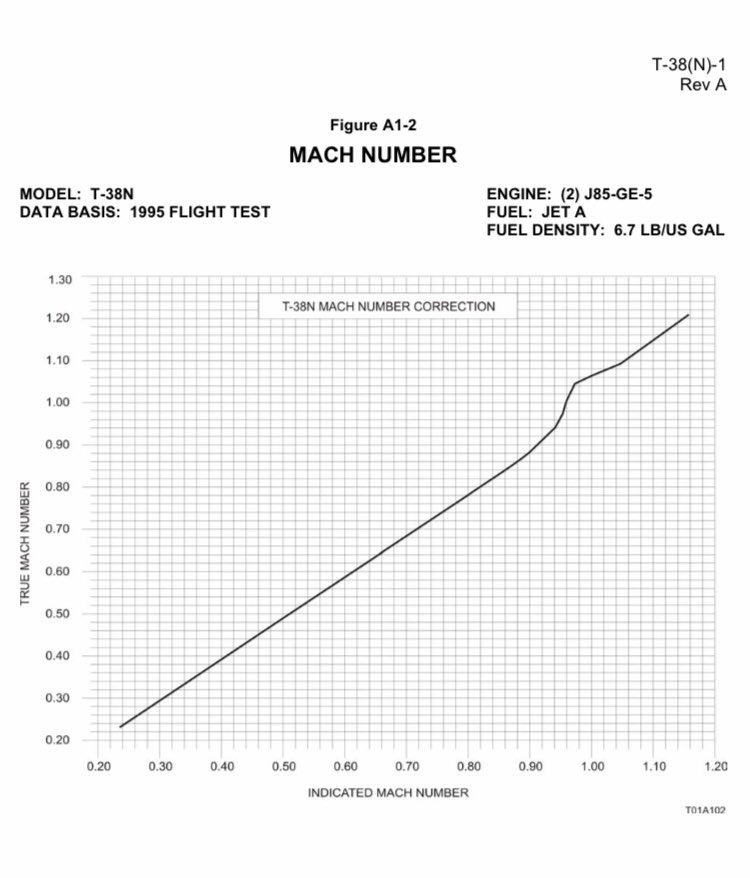
The curve starts behaving strangely between Mach 0.9 and Mach 1.10. This speed range is called Transonic speeds.
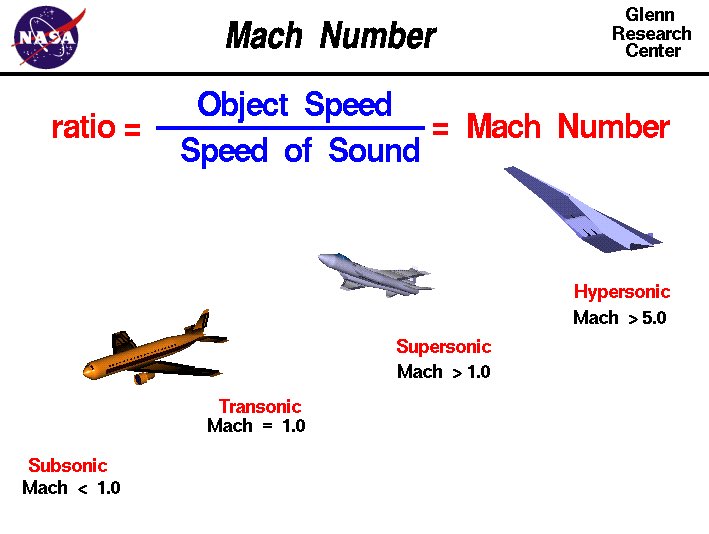
It happens when an aircraft transitions from subsonic speeds to supersonic speeds.
It happens when an aircraft transitions from subsonic speeds to supersonic speeds.
Let’s go deeper in aerodynamics. The airflow is accelerated when being above the wing.
So depending on the wing’s profile, the airflow will accelerate more or less at a given speed. Two different wings at the same speed will accelerate the air differently. Got it ?
So depending on the wing’s profile, the airflow will accelerate more or less at a given speed. Two different wings at the same speed will accelerate the air differently. Got it ?
If the air accelerates, it means that it will travel faster than the speed of sound relatively to our plane BEFORE our plane reaches supersonic speeds ! And this supersonic flow will create a shock wave, leading to an airflow separation from the wing.
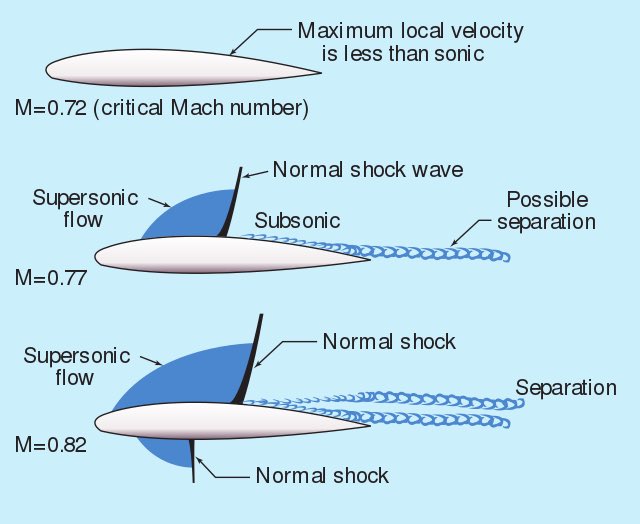
To be simple : transonic speeds are unstable and the airflow begins to act strangely.
When your airflow will separate from the structure, you might have drops of static pressure, or an overpressure if the flow « sticks » too much to the plane.
When your airflow will separate from the structure, you might have drops of static pressure, or an overpressure if the flow « sticks » too much to the plane.
If you remember correctly, the static pressure should keep the diaphragm pushed so the dynamic airflow expands it relatively to altitude. But now that our static pressure isn’t correct and that our Pitot measurement can be incorrect as well... it leads in a false indicated speed!
That’s exactly what we see here ! The curve shows us that the IAS and TAS are different during transonic transition, because the aerodynamics makes the airflow unstable. When reaching supersonic speeds, the airflow is different from subsonic BUT stable : x = y again !

As you can see, from a small bump in a mach number indicator curve, we can reach an aerodynamic flow analysis relative to the static pressure !
I hope that you enjoyed this small [THREAD], as always feel free to share it !
I really like to explain these surprising interesting small things, and will make another one soon !
CC : @EurekafeTLS @mr_vieux
I really like to explain these surprising interesting small things, and will make another one soon !
CC : @EurekafeTLS @mr_vieux
By the way : IAS = Indicated Air Speed and TAS = True Air Speed


