
Each day we learn more about the #nCOV2019 outbreak. Here is a #tweetorial on 5 key questions and terminology in infectious disease epidemiology to help make sense of all of this information.
#1. R0: what does it mean, and what does it tell us? R[subscript]0 -- pronounced R-nought or R-zero, and called the basic reproductive “rate” or number, is the value that summarizes how contagious a pathogen is.
R0 is the average # of people one case will infect if it is introduced into an entirely susceptible population. If R0 >1 each infected person will transmit to >1 person, creating epidemic potential.
R0 does not give us any information on the total number of people who are currently infected. It is also not a measure of disease severity - it only tells us on average how many people each person will infect, not how severe those infections will be.
R0 does not have to be constant for a given disease, and may depend on factors such as population density and contact patterns. Despite this, it seems to be relatively similar for a given disease across populations.
There are several ways to estimate R0. At an epidemic’s start, reported cases grow exponentially, and R0= (approximately) 1+growth rate*serial interval. The serial interval is the time between one infection and the next in a transmission chain.
For more details on the math and the exact version see: ncbi.nlm.nih.gov/pmc/articles/P…. Using this approach, Guangdong CDC reported estimates of the R0 for nCoV of 2.9: biorxiv.org/content/10.110…
Challenges for this approach are:
a) unreliable reporting (missing cases) -can lead to biased estimates of R0 (up or down) if there are changes in proportion of cases detected or in delays in reporting
b) uncertain serial interval (time step over which to calculate the rate)
a) unreliable reporting (missing cases) -can lead to biased estimates of R0 (up or down) if there are changes in proportion of cases detected or in delays in reporting
b) uncertain serial interval (time step over which to calculate the rate)
In simple mathematical models, we can estimate R0 as the probability of infection given contact with infectious person (b) x contact rate (k) x infectious duration (d). At the beginning of an outbreak, these parameters are challenging to estimate, given the limited data.
The # of contacts (k) is particularly hard to estimate. Heterogeneity in k can lead to “bursts” of cases from superspreading events (when one individual infects a large # of people) leading to heterogeneity in R0. Superspreaders played important roles in SARS and MERS outbreaks.
For the Wuhan nCoV there are several estimates of R0 using different approaches. A list is: docs.google.com/spreadsheets/d…. Not every approach is equally valid.
E.g., using the growth rate in cases by date of symptom onset is preferable to using the growth rate by date of report, because reporting can be delayed, come in “chunks” of many cases reported at once, and otherwise be confusing. Even date of onset has issues, but is better.
Also, the growth rate by date of symptom onset will seem to decline near the present, because recent cases won’t all have been reported. If not accounted for this can look like transmission is slowing. From 2009 flu: onlinelibrary.wiley.com/doi/full/10.11…
#2. How do we know the # of cases? Reports from health facilities and government agencies are key sources of information. But at the beginning of an outbreak, even if diagnostics are available quickly (like for nCoV), the total number of cases will be uncertain.
If we assume many cases are missed in the outbreak’s epicenter (here, Wuhan), but detection is near 100% in int’l travelers, case incidence in travelers combined w/ daily probability of travel and mean detection time can be used to estimate total # of cases at the epicenter.
This approach was used for the nCov outbreak: imperial.ac.uk/mrc-global-inf…. Similar methods were used during the 2009 H1N1 epidemic. For the algebra behind it: journals.plos.org/plosone/articl…
HKU released results of their real-time nowcast and forecast, using number of confirmed cases and daily travel estimates: sph.hku.hk/images/news/pr…
This analysis combined an approach using outbound traveler volume from Wuhan and exported case numbers to estimate cases in Wuhan, then again used outbound travel volume to estimate cases exported to other Chinese cities. files.sph.hku.hk/download/wuhan…
Active surveillance, which involves testing an (ideally representative) sample of the population exhibiting symptoms, can also be used to estimate total # cases: thelancet.com/journals/lance…
#3. How and when did the outbreak start?
Rapid genomic sequencing can help identify when a virus was introduced, how many times, and where imported infections originated. Viruses mutate, so if two people are infected with viruses that are similar, this suggests the two people’s infections are connected.
Combining analysis of genomes of viruses from those infected with estimates of how fast viruses are mutating and the total number of cases, we can estimate when the virus was introduced into a population.
Analyses of nCoV viruses suggest it was introduced in Nov or Dec 2019. The similarities in the viruses suggest only one or a small number of introductions from animals. virological.org/t/phylodynamic…
nextstrain.org
nextstrain.org
Combined with data on people’s travel history and exposure, genomic data can help distinguish between imported cases and local transmission. Most cases outside of China have been imported, but local transmission is beginning to be reported. Global cases: systems.jhu.edu
#4. How do we contain an outbreak? What makes containment harder or easier?
R[subscript]e (effective reproductive number) is the # of people infected by a single case when the population isn’t entirely susceptible, and/or control measures are in place. Re=R0*(1-effect of control)*(proportion of pop susceptible). To stop an epidemic, Re must be <1.
Vaccines are some of our best tools for bringing Re <1, by reducing the proportion of the population that is susceptible. Like a forest fire, if susceptibles (trees) run out, the epidemic will burn out.
Vaccine development for #nCOV2019 is underway: cepi.net/news_cepi/cepi…
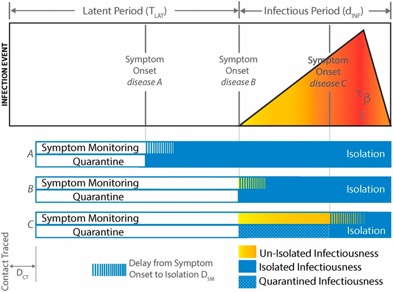
Treatment can also reduce Re by decreasing the duration of infectiousness. Until vaccines and treatment are available, we must rely on nonpharmaceutical interventions. These include measures to decrease contacts, such as symptom monitoring/isolation and quarantine.
The relative effectiveness of these case-based interventions (which require knowing who is infected) depends on two key factors: 1) the relationship b/w timing of infectiousness and symptoms, 2) the proportion of presymptomatic and asymptomatic infections: pnas.org/content/101/16… 
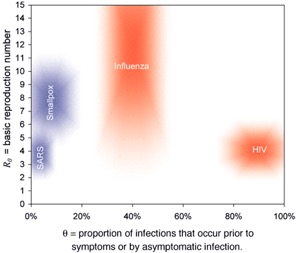
Infectiousness before or w/o symptoms makes control harder b/c cases may not be identified before transmission, or may be missed completely yet may transmit. Quarantine of contacts can reduce these effects but has feasibility and social liberty costs. pnas.org/content/pnas/1…
The substantial concern raised by reports of a presymptomatic transmission (bbc.com/news/world-asi…) reflects that if it is common, control by isolation will be much harder. There isn’t any data yet on whether presymptomatic transmission is common in nCoV.
Screening of travelers at ports of entry for symptoms is another way to control outbreaks. Presymptomatic and asymptomatic transmission make this approach less effective.
#5. Severity - a double edged sword. Understanding the clinical spectrum of a novel infectious pathogen is relevant for public health response to an outbreak.
Severe cases, while leading to hospitalization and potential death, are more likely to be detected and reported. Infected individuals with no or few symptoms are more likely to remain unnoticed. If these individuals contribute to transmission, the outbreak is harder to control.
On the other hand, if mild or asymptomatic cases are common and do NOT contribute much to transmission, then they will aid control because fewer individuals will need care, and their infections will likely give them immunity to reinfection, at least for some time.
Link to text of tweets: docs.google.com/document/d/1Xt…
Thanks to @rebeccajk13 for creating this thread, with input from CCDD director @mlipsitch and associate director @Caroline_OF_B.


