Taught my undergrads about p-values and the decline of war...at the same time!
How did it go?
[THREAD]
How did it go?
[THREAD]
For a refresher, the decline of war debate is the claim that the onset and deadliness of war is declining over time. @tanishafazal & I are on the record (most recently, via @ForeignAffairs) as questioning that claim
foreignaffairs.com/articles/2019-…
foreignaffairs.com/articles/2019-…
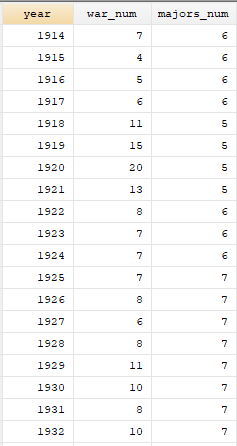
In class, we used the Correlates of War Interstate War data (correlatesofwar.org/data-sets/COW-…). There are questions about these data accuracy (cc @mchorowitz, @jaylyall_red5, & @Michael_Spagat ), but the coverage is useful (back to 1823)
Besides, the data are still useful to teach stats
Besides, the data are still useful to teach stats
The first thing we did was plot the data over time.
This figure shows the raw number of war deaths by year that a war started. As is clear, there is a HUGE bump in the middle of the series -- those are World Wars I and II.
This figure shows the raw number of war deaths by year that a war started. As is clear, there is a HUGE bump in the middle of the series -- those are World Wars I and II.

So we considered the following question: given that the early 20th century (1914 to 1945) was such an outlier, could we claim that the post-1945 time period and the pre-1914 time periods are largely the same?
To begin answering that question, we compared the average number of fatalities per war in each of those time periods.
Conveniently, both time periods had exactly 38 wars.
Conveniently, both time periods had exactly 38 wars.

So the post-1945 time period appears, on average, to actually be deadlier than the pre-1914 time period.
So much for the *decline* of war, right?
Well, maybe.
So much for the *decline* of war, right?
Well, maybe.
Do you think the difference in the time periods would still be observed if you
(a) re-ran history?
OR
(b) corrected for measurement error?
(a) re-ran history?
OR
(b) corrected for measurement error?
Wait, what was that first option again? re-run history?!🤔
YES!
In other words, how confident are you in claiming that the post-1945 time period is FUNDAMENTALLY more deadly than the pre-1914 time period?
Was it just a fluke? How would you know?
YES!
In other words, how confident are you in claiming that the post-1945 time period is FUNDAMENTALLY more deadly than the pre-1914 time period?
Was it just a fluke? How would you know?
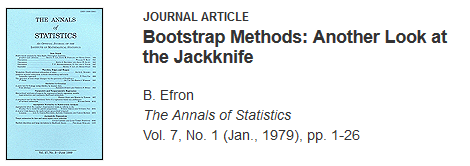
Well, I briefly introduced them to the idea of a bootstrap (I can explain that introduction in another thread)
jstor.org/stable/2958830…
jstor.org/stable/2958830…
And here is what we find. The blue line is the observed difference in means (about 48,000), while the green line is at zero.
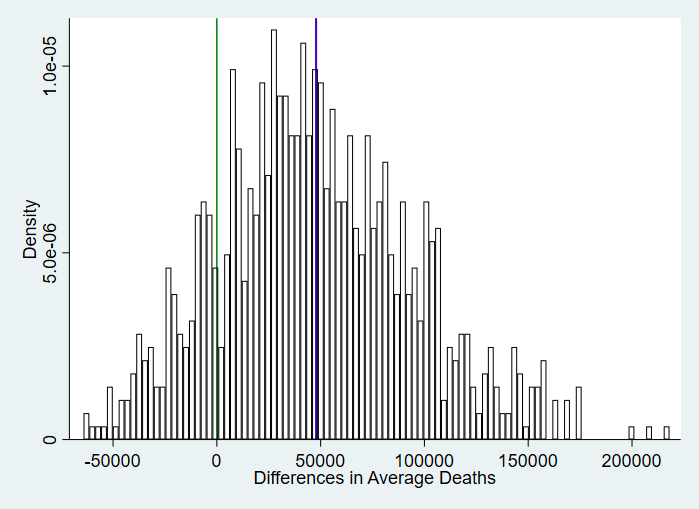
Looking at the graph, MOST of the simulated differences are above zero. Indeed, quite a few are above the observed difference.
But are ENOUGH above zero?🤔
But are ENOUGH above zero?🤔
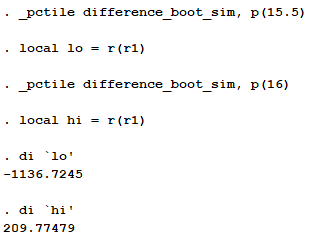
In this case, about 16 percent of the observations are below zero
Is 16 percent *enough* for the students to feel comfortable than the observed difference is indeed NOT a fluke?
Ultimately, it's a judgement call
Ultimately, it's a judgement call
Fisher himself made this clear back in 1926, when he said that his "preference" is for less than 5 percent of the values to be zero (or below).
So if you're Fisher, 16 percent is too much.
Hence, you would conclude that the observed difference in means is not sufficiently far away from zero for you to be comfortable that the observed difference in means is due to fundamental differences in the two samples.
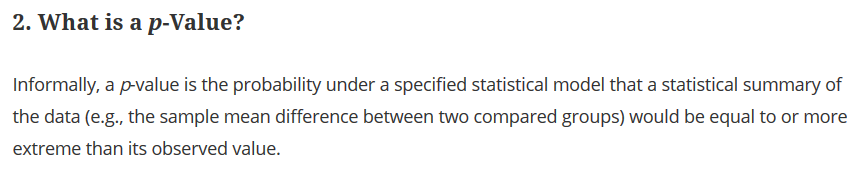
That's a mouthful! But is it really better than the definition of p-value offered by @AmstatNews?
amstat.tandfonline.com/doi/full/10.10…
amstat.tandfonline.com/doi/full/10.10…
Now how does all of this relate to t-tests and hypothesis testing? That was another lesson. This one already gave the students plenty of 🤯
[END]
[END]