A few new graphs on US #COVID19 testing:
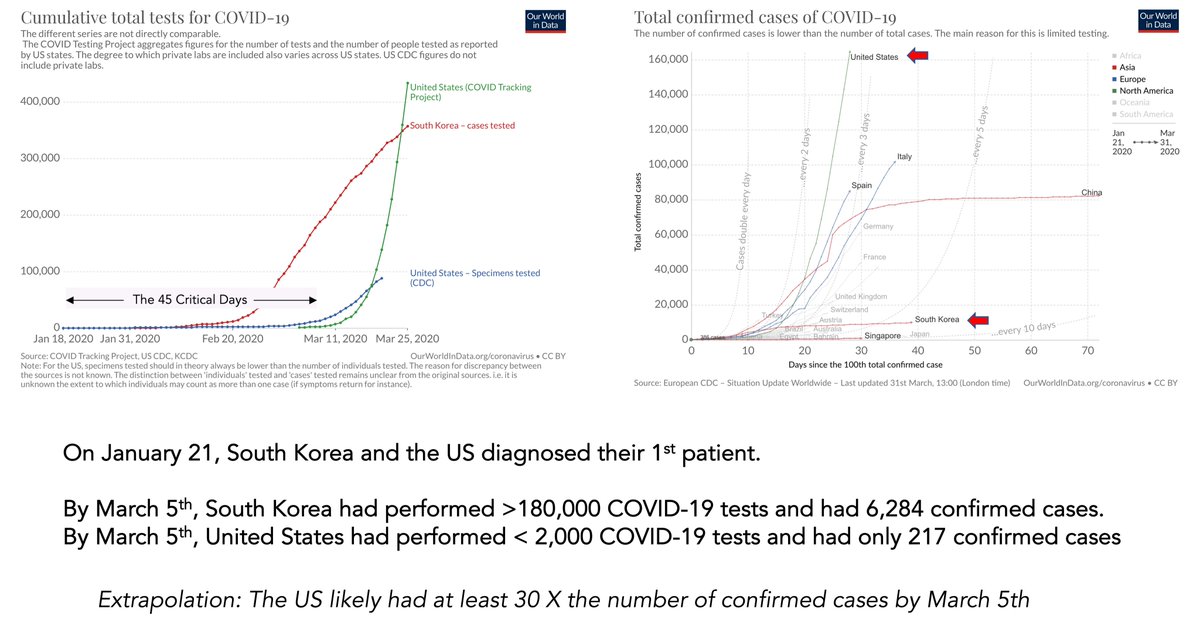
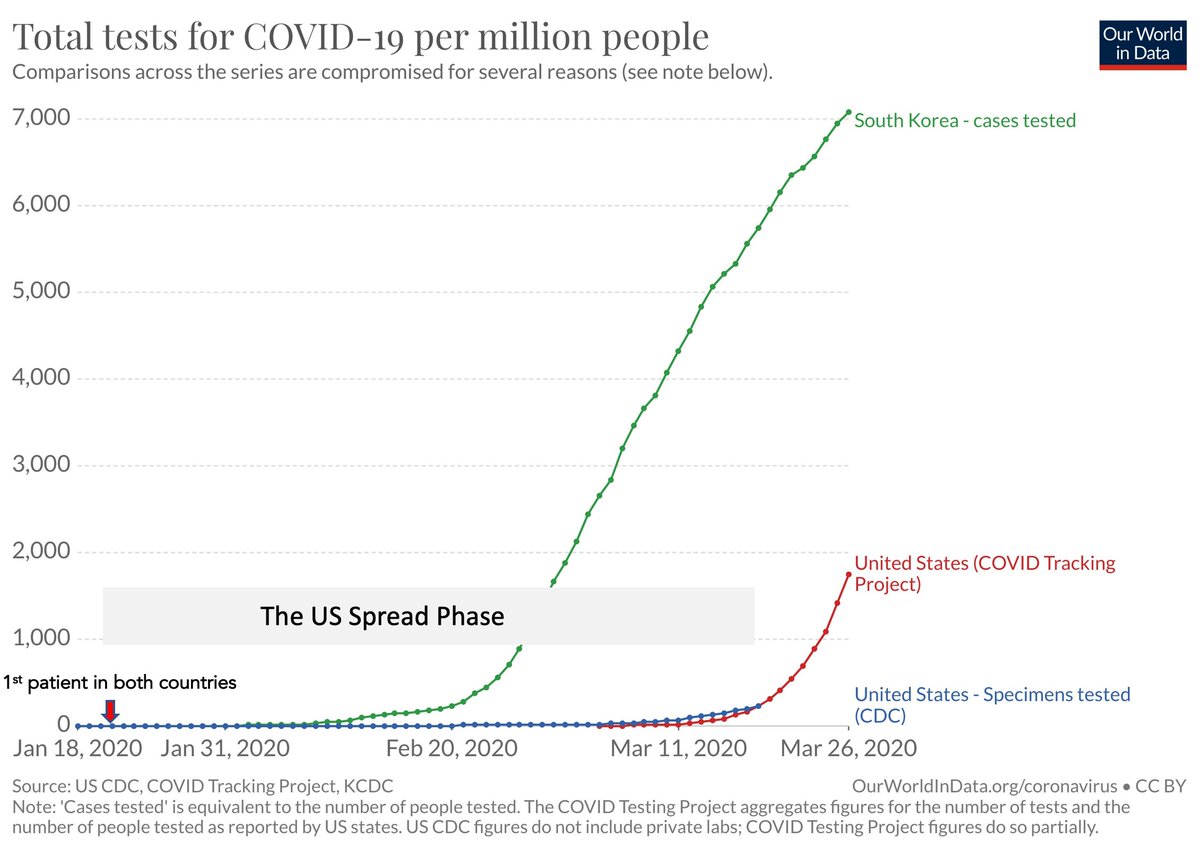
1. I've annotated @JoeHasel's important @OurWorldInData graph ourworldindata.org/grapher/cumula… that compared S Korea vs US. Both countries had 1st patient Dx w/in 24 hrs in Jan. For ~50 days there was very little US testing, the spread phase 1/3
1. I've annotated @JoeHasel's important @OurWorldInData graph ourworldindata.org/grapher/cumula… that compared S Korea vs US. Both countries had 1st patient Dx w/in 24 hrs in Jan. For ~50 days there was very little US testing, the spread phase 1/3
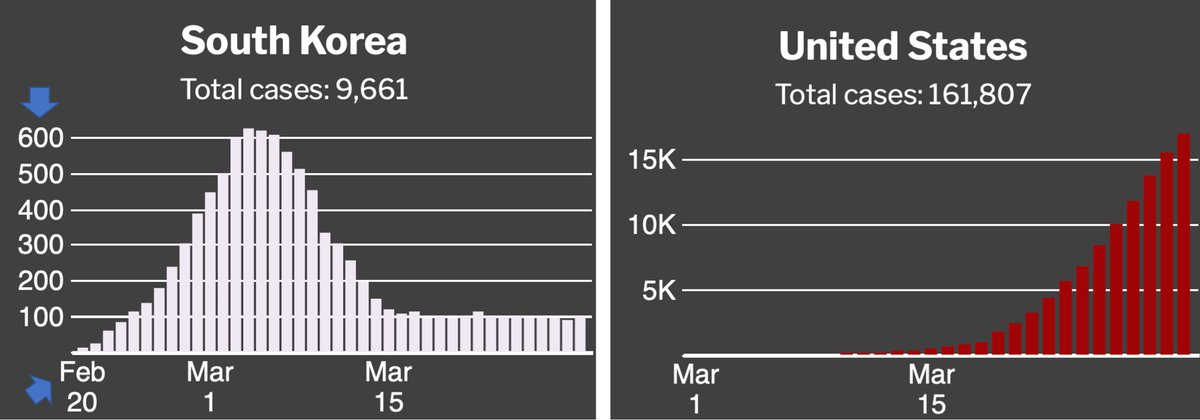
2. In @nytimes on the US surge
nytimes.com/interactive/20…
what is missed is all of February when there were a grand total of 352 US tests vs >75,000 in S Korea
Meanwhile people broadly getting infected in the US but no ability to diagnose (or even suspect) @LazaroGamio @adeelnyt 2/3
nytimes.com/interactive/20…
what is missed is all of February when there were a grand total of 352 US tests vs >75,000 in S Korea
Meanwhile people broadly getting infected in the US but no ability to diagnose (or even suspect) @LazaroGamio @adeelnyt 2/3
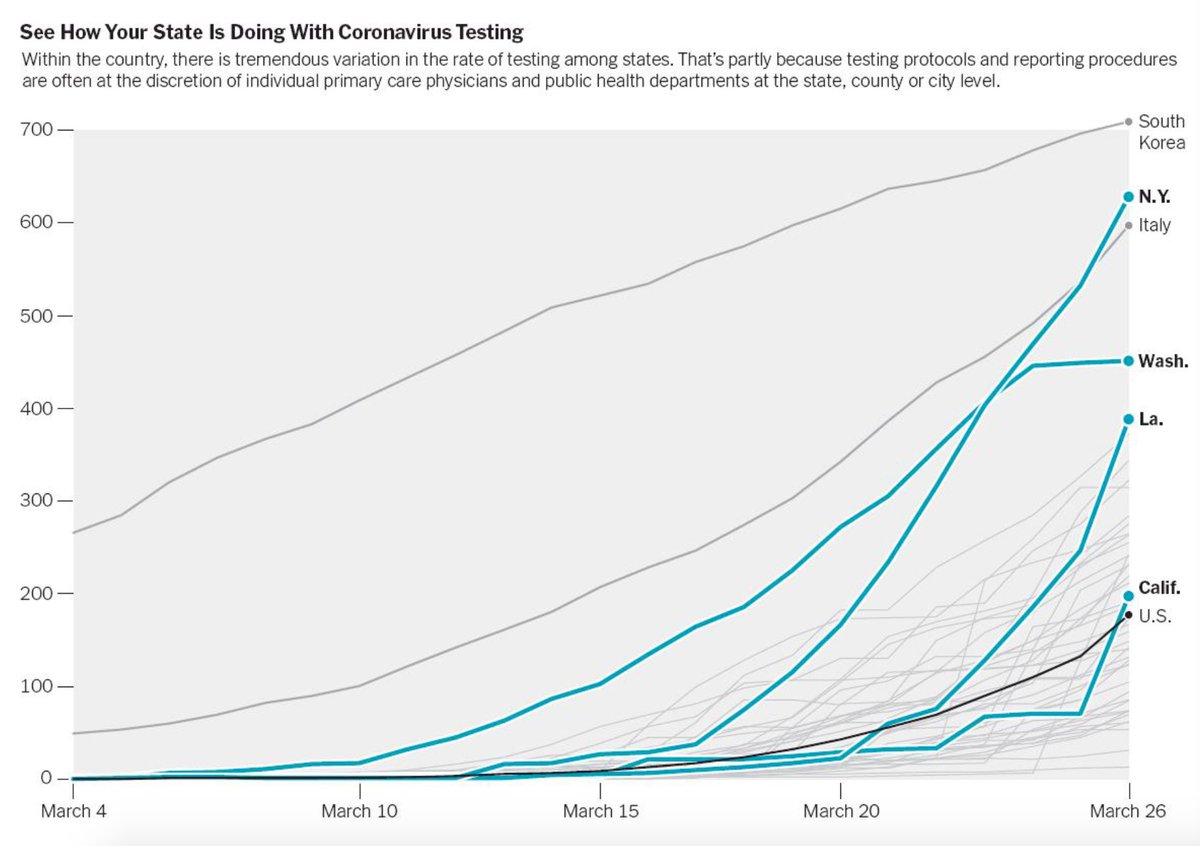
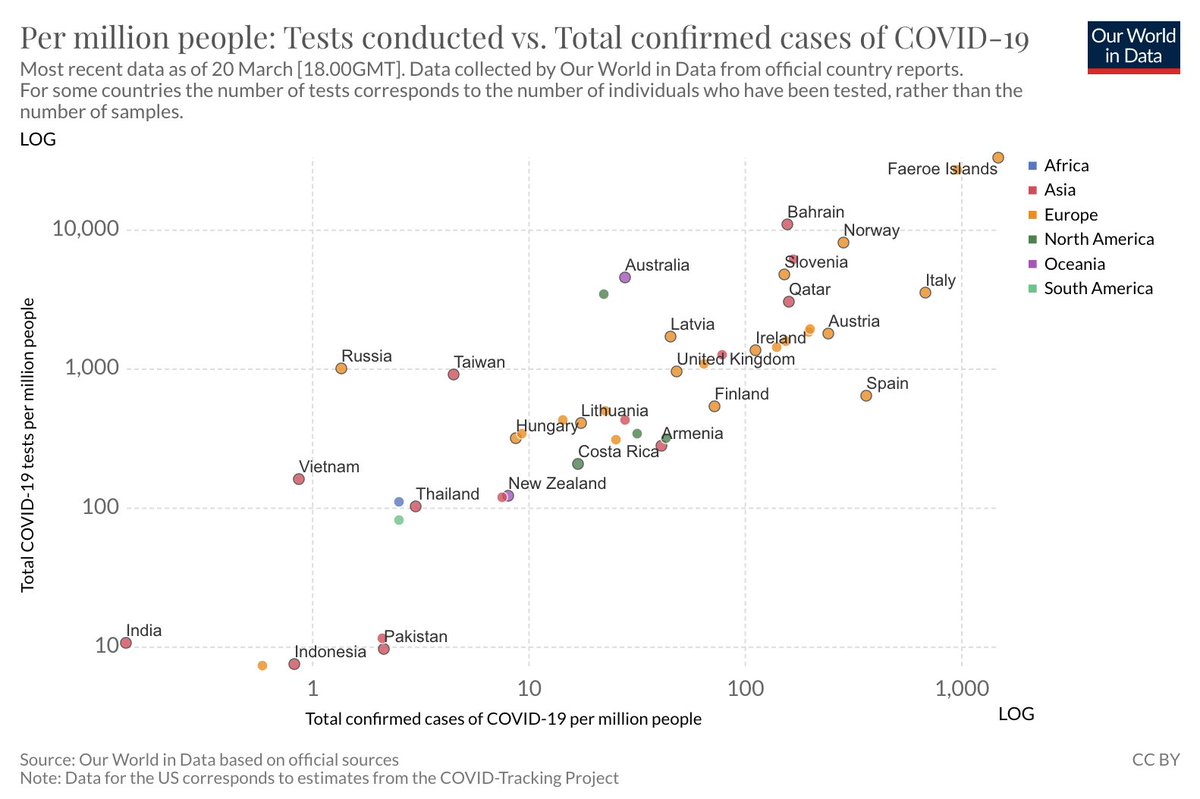
3. And this March graph which also gives the misimpression on theUS surge, although not normalized (R panel). The key omission is timeline from Jan 21, 1st patient. And it's very likely there were people in the US infected in December, but missed before Seattle kicked in 3/3