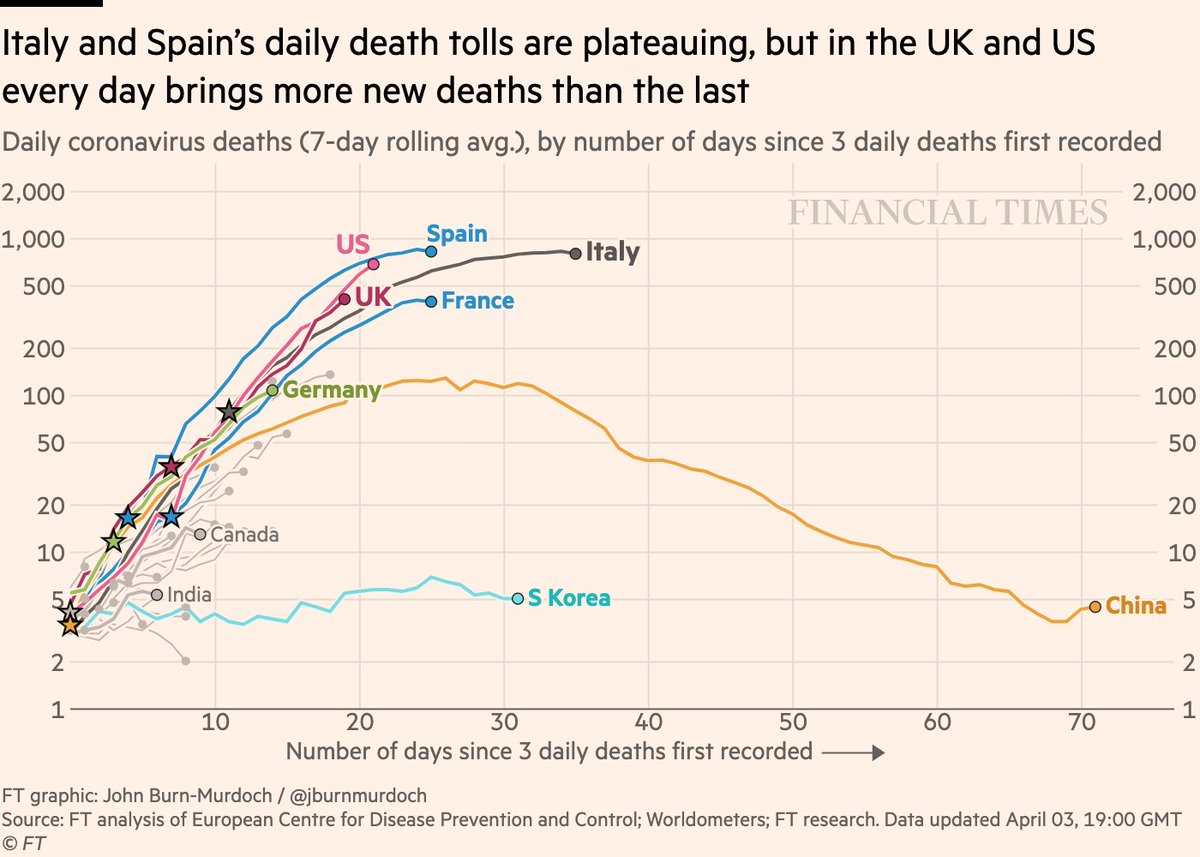
NEW: Sunday 29 March update of coronavirus mortality trajectories
• UK still tracking Italy. Death toll doubling every 2.8 days
• US curve still steepening, could reach 1,000 new daily deaths within next 3-4 days
Live version FREE TO READ: ft.com/content/a26fbf…
• UK still tracking Italy. Death toll doubling every 2.8 days
• US curve still steepening, could reach 1,000 new daily deaths within next 3-4 days
Live version FREE TO READ: ft.com/content/a26fbf…
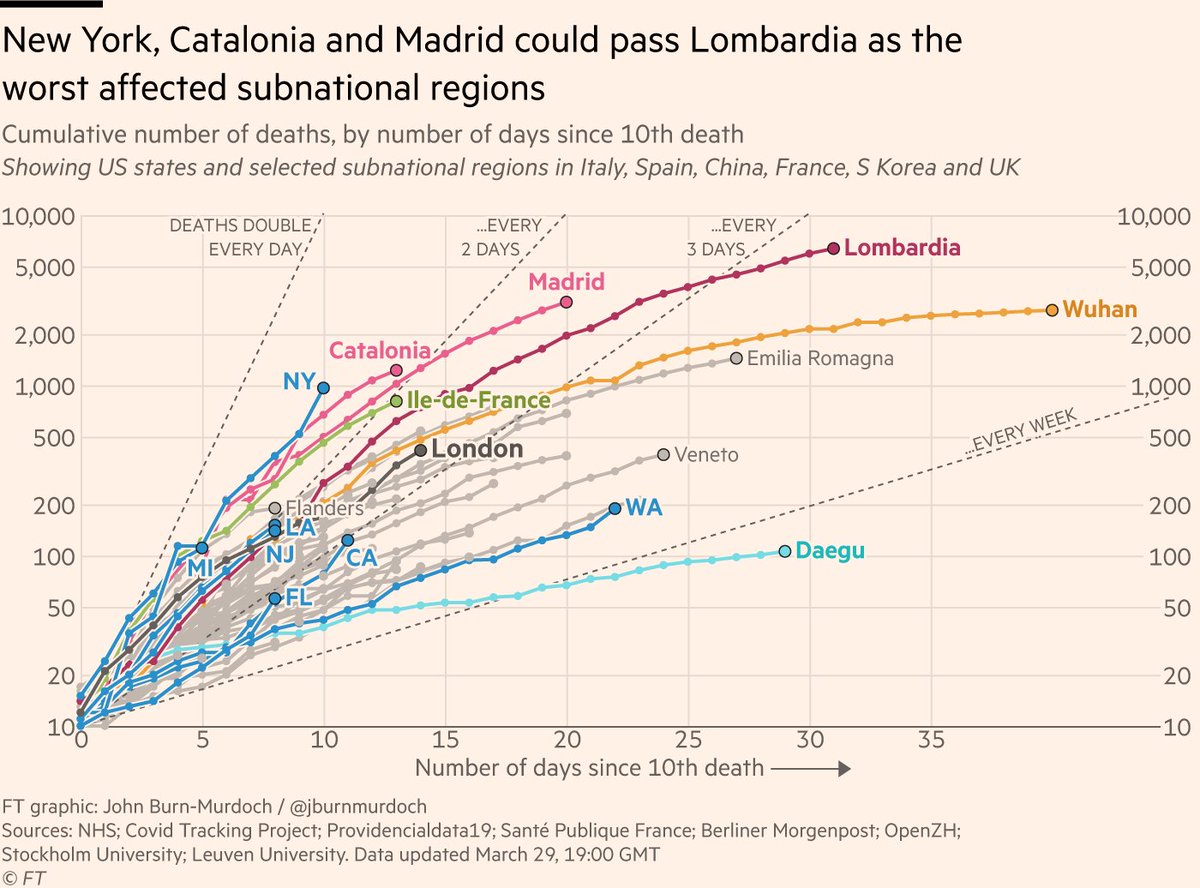
Death toll trajectories in subnational regions:
• New York curve still steepening. Deaths almost doubled in last 24h
• Michigan also looking bad
• Lack of joined-up measures in US starting to take its toll as multiple outbreaks spread
All charts: ft.com/content/a26fbf…
• New York curve still steepening. Deaths almost doubled in last 24h
• Michigan also looking bad
• Lack of joined-up measures in US starting to take its toll as multiple outbreaks spread
All charts: ft.com/content/a26fbf…
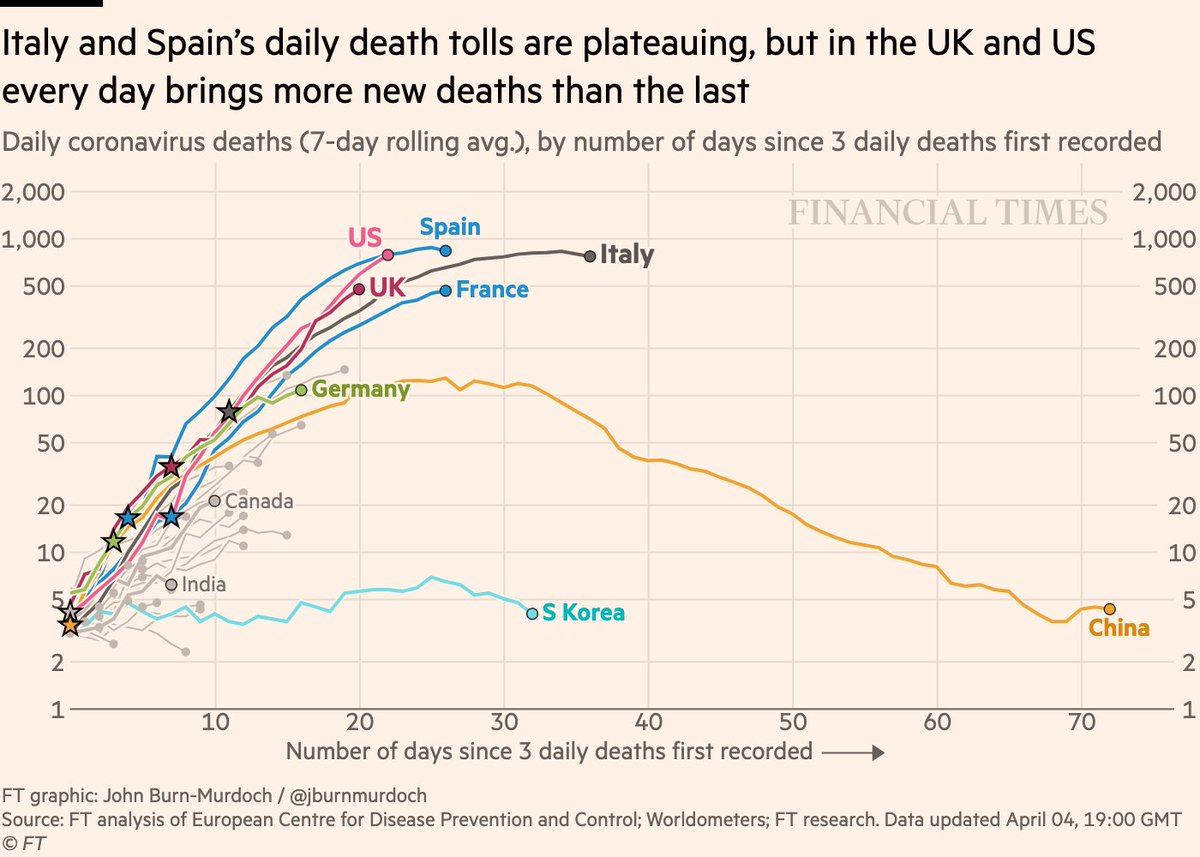
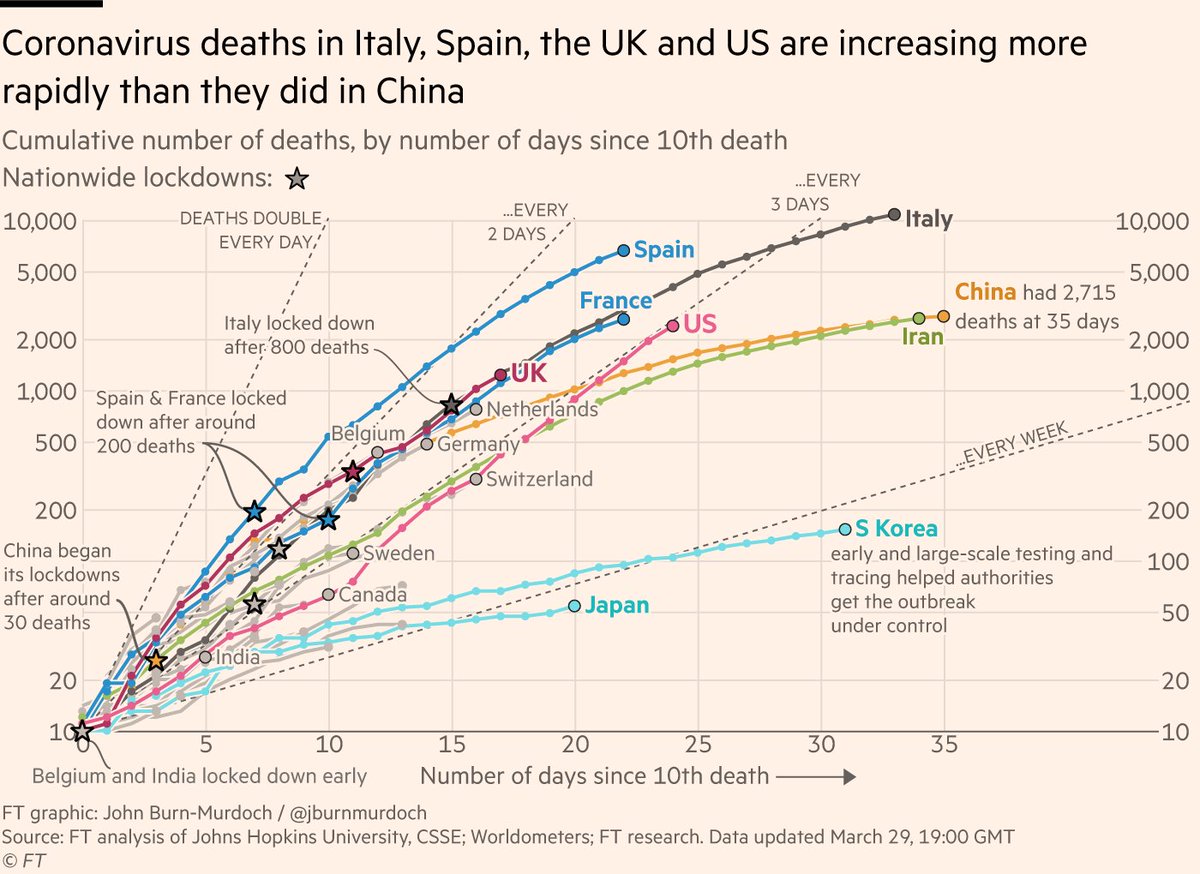
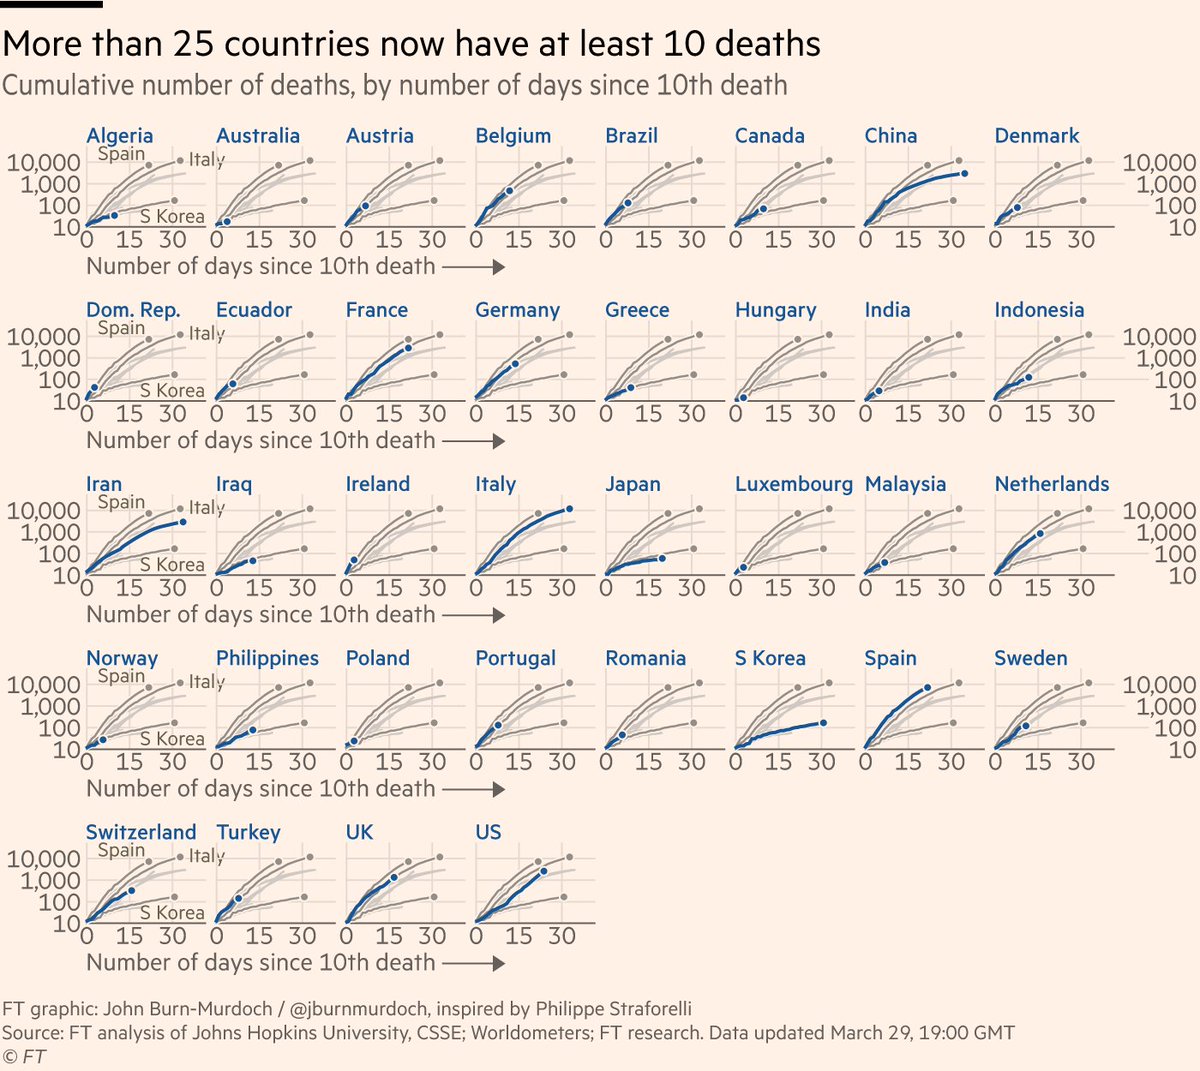
All countries’ death toll trajectories:
• German curve still tracking Italy, as are Turkey, Brazil and many others
• 36 countries’ death toll curves now shown here
All charts: ft.com/content/a26fbf…
• German curve still tracking Italy, as are Turkey, Brazil and many others
• 36 countries’ death toll curves now shown here
All charts: ft.com/content/a26fbf…
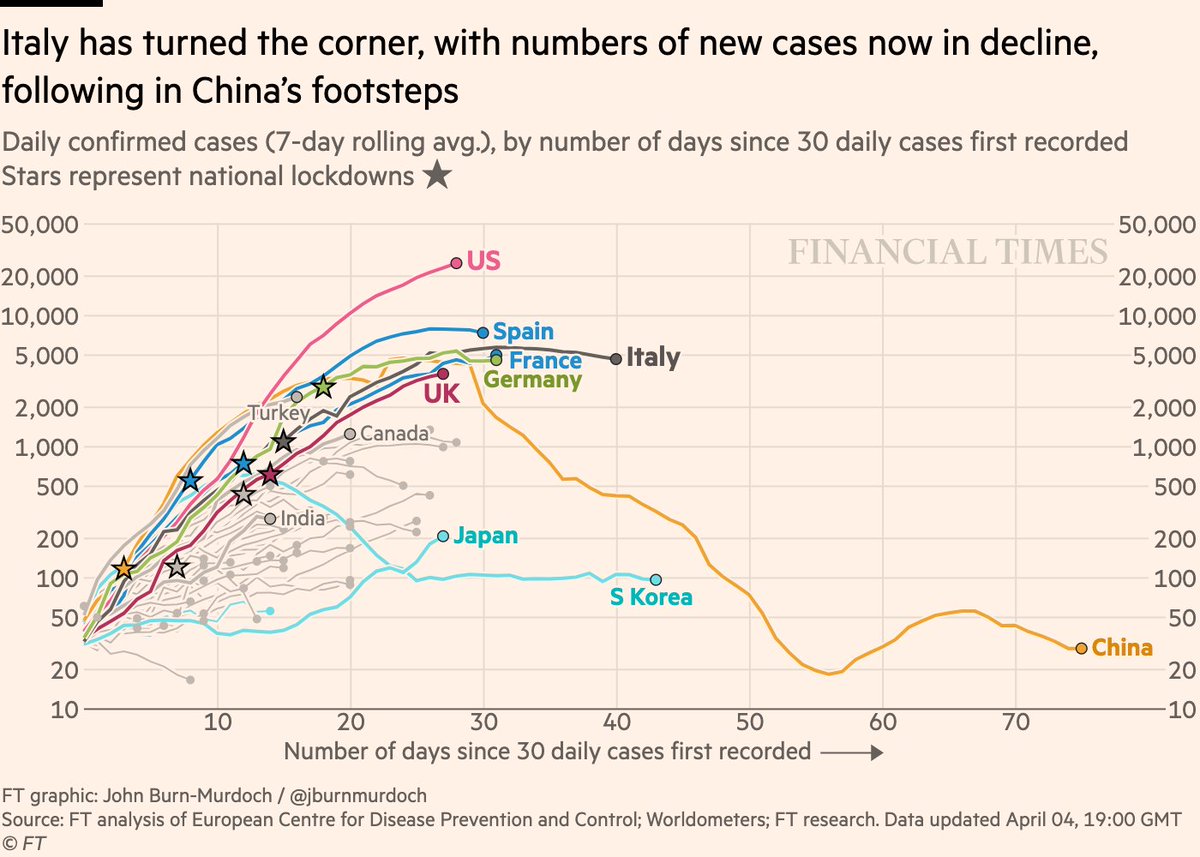
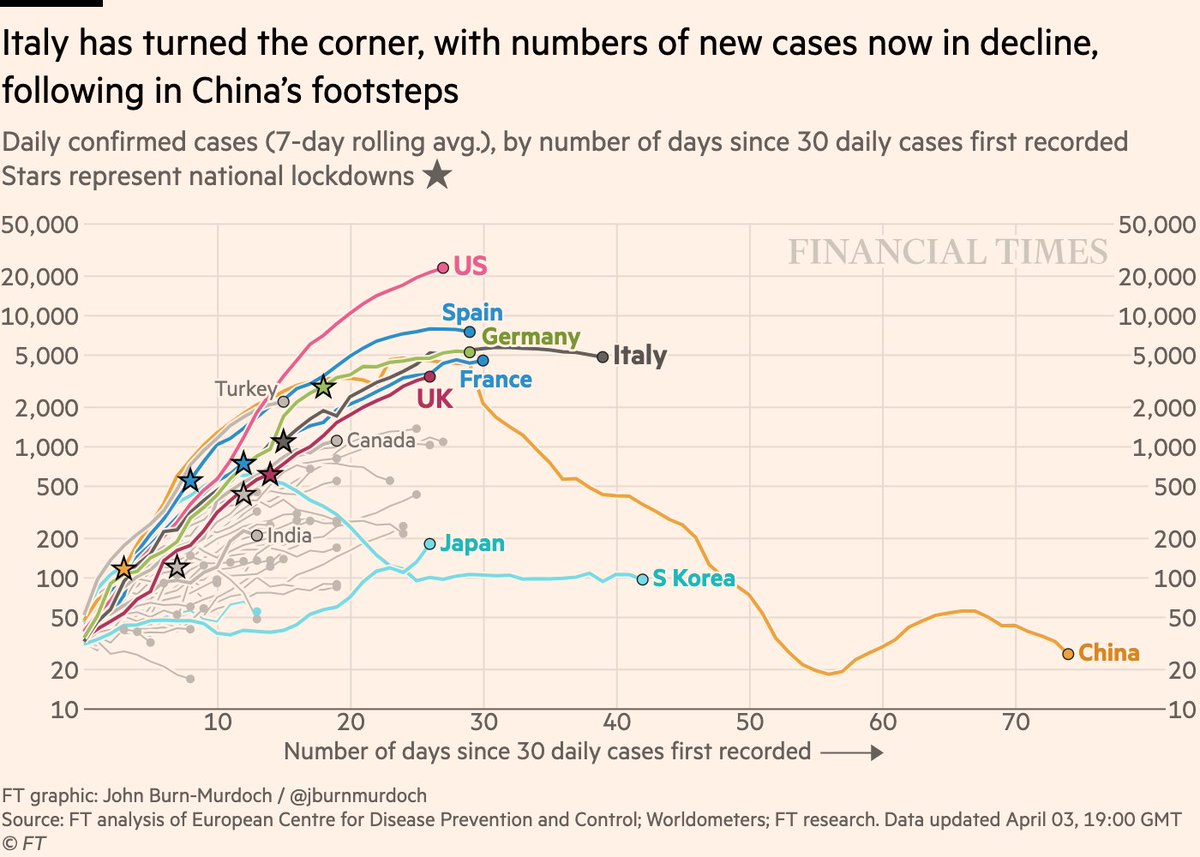
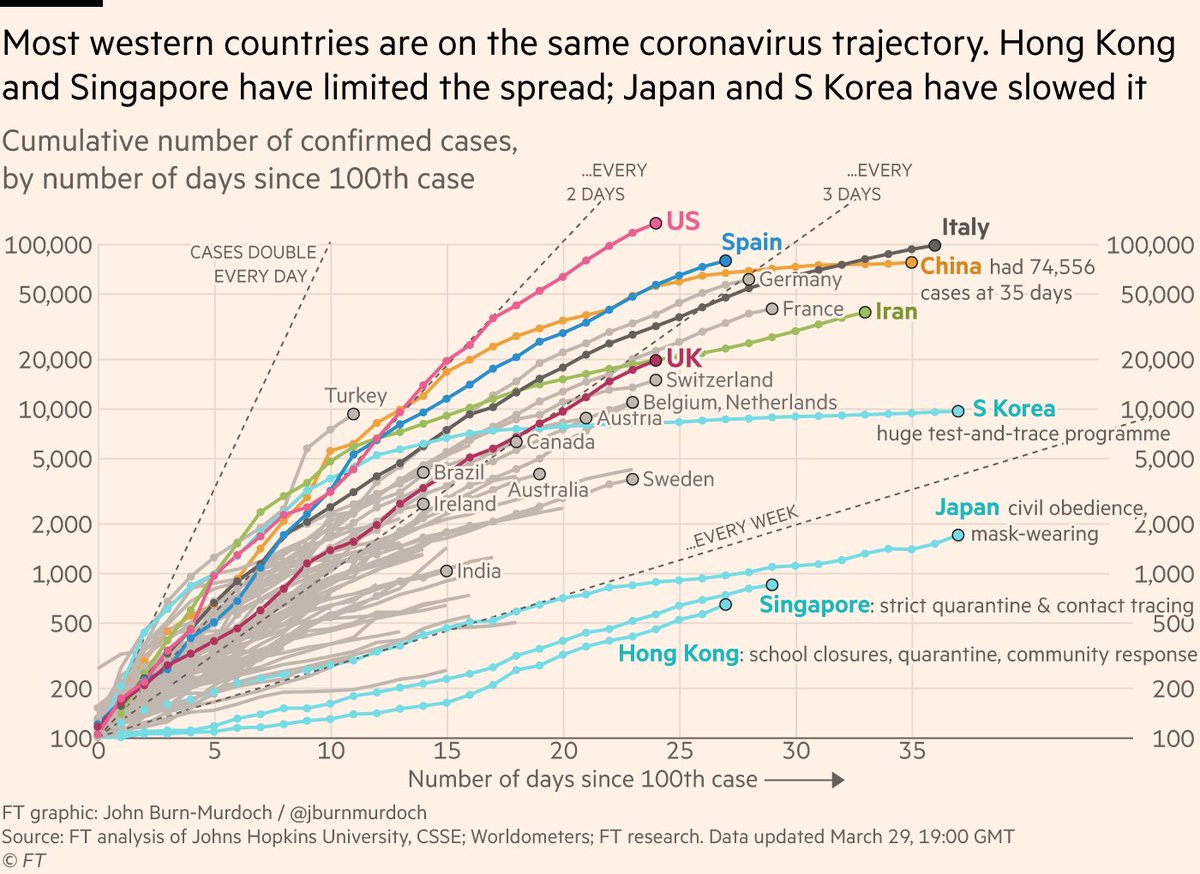
Latest confirmed case trajectories for major countries:
• Turkey and US on steepest trajectories
• UK has passed Iran’s confirmed case numbers for same stage of outbreak
Story from @yuanfenyang & co on whether you can trust Chinese data: ft.com/content/4aa352…
• Turkey and US on steepest trajectories
• UK has passed Iran’s confirmed case numbers for same stage of outbreak
Story from @yuanfenyang & co on whether you can trust Chinese data: ft.com/content/4aa352…
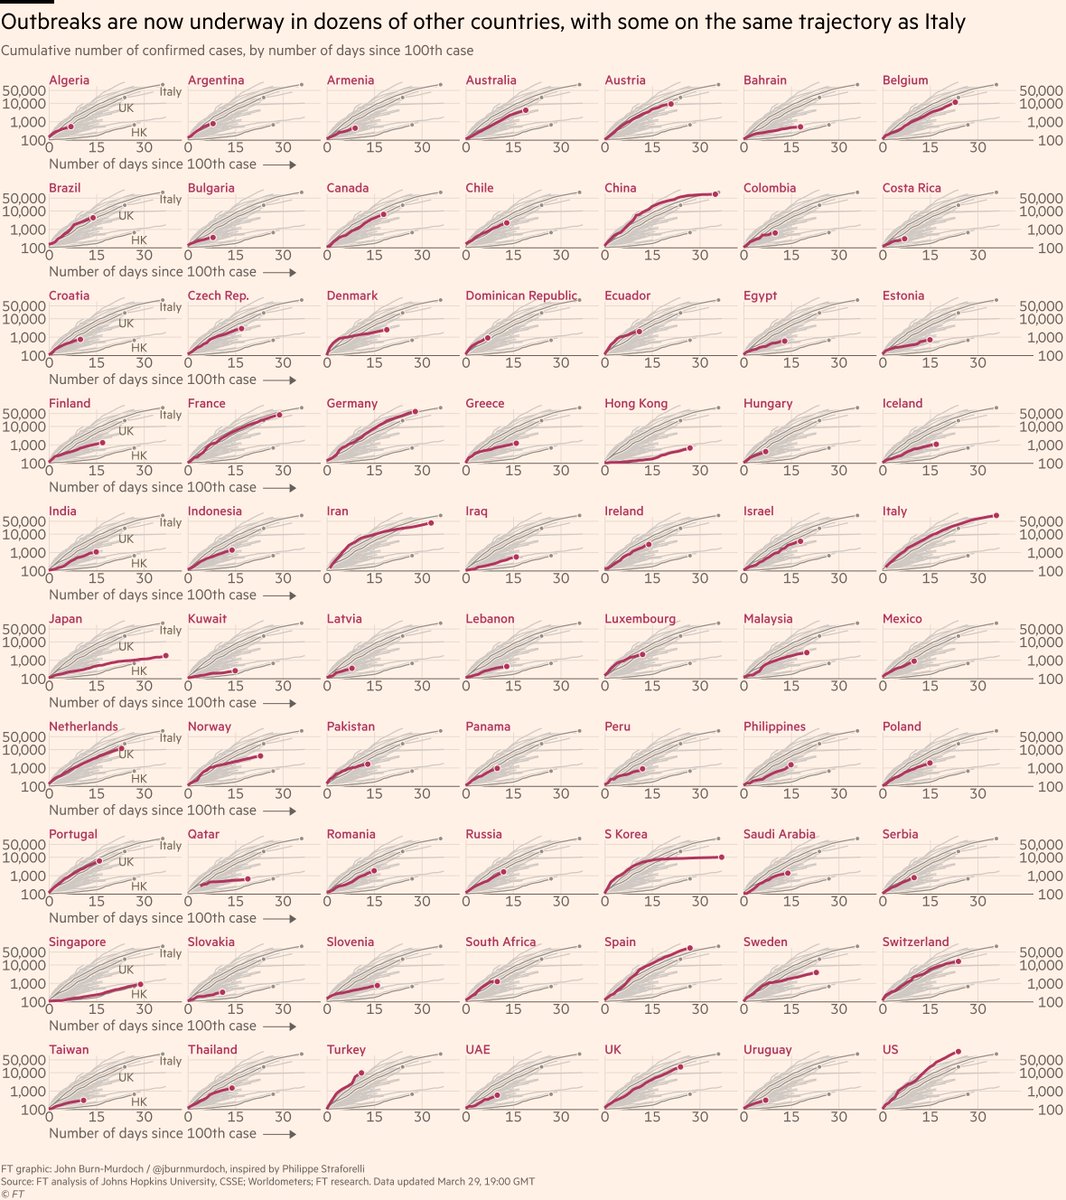
This chart now shows ALL countries with several days of data over 100 confirmed cases, so you can compare case trajectories in the US to the UAE or China to Chile. 70 countries shown.
Live versions of all charts here: ft.com/content/a26fbf…
Live versions of all charts here: ft.com/content/a26fbf…
Here's my explainer on why we're using log scales:
And why we're showing absolute numbers rather than population-adjusted rates:
Please email john.burn-murdoch@ft.com with feedback, comments, requests and subnational data.
All of these are invaluable, and we continue to incorporate your suggestions and data every day.
I’ll keep getting back to as many people as possible.
Stay safe, one and all!
All of these are invaluable, and we continue to incorporate your suggestions and data every day.
I’ll keep getting back to as many people as possible.
Stay safe, one and all!
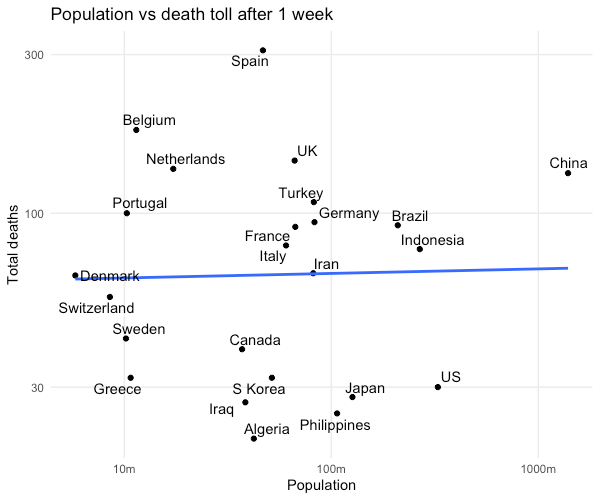
A quick chart for those who keep asking for per-capita adjustment:
Here’s population vs total death toll one week after 10th death.
No relationship.
As I’ve been saying, population does not affect pace of spread. All per-capita figures do is make smaller countries look worse.
Here’s population vs total death toll one week after 10th death.
No relationship.
As I’ve been saying, population does not affect pace of spread. All per-capita figures do is make smaller countries look worse.
And here’s the same for after 2 weeks.
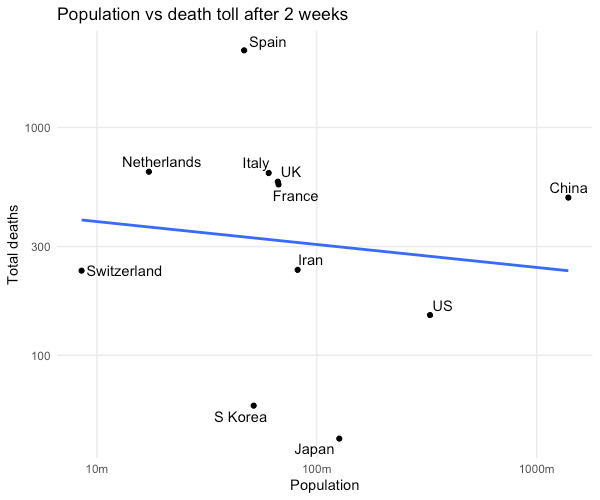
Plenty of things _indirectly related to population_ can make a difference:
• Pop density can increase rate of spread
• Countries with many major travel hubs may end up with multiple outbreaks
But pop alone is a bad thing to adjust for if wanting assess how bad an outbreak is.
• Pop density can increase rate of spread
• Countries with many major travel hubs may end up with multiple outbreaks
But pop alone is a bad thing to adjust for if wanting assess how bad an outbreak is.