I want to dispel a giant misconception on FinTwit regarding PMI data - about 95% of people don't understand what the PMI is, including many famous analysts and FinTwit celebrities
It just takes two graphs (see later)
But first, the China Manufacturing Data from Feb/Mar
1/N
It just takes two graphs (see later)
But first, the China Manufacturing Data from Feb/Mar
1/N
Here is the China Manufacturing PMI, clearly it shows a giant 'V' shape bounce right? It was 35 in Feb, and 52 in March
No it does not, it really really really really really does not...
If you think that, please read on...
2/N
No it does not, it really really really really really does not...
If you think that, please read on...
2/N
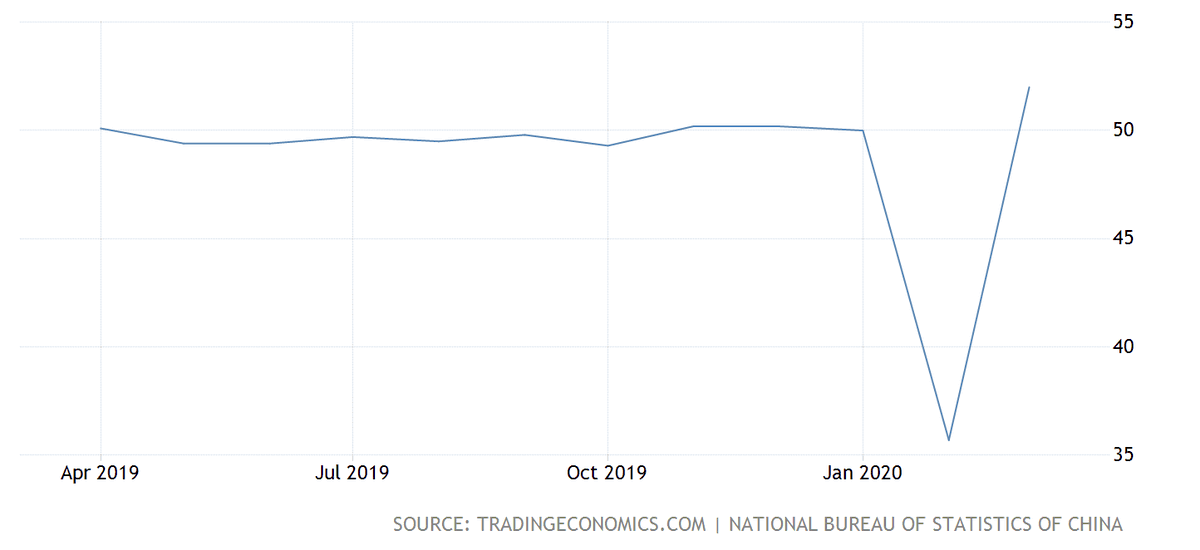
The China data show a very small increase in manufacturing activity, as 52 just above 50 - which represents zero month-on-month (MoM) growth in manufacturing activity
PMI is a MoM diffusion index, companies are asked if they had more/less/same biz activity in the month
3/N
PMI is a MoM diffusion index, companies are asked if they had more/less/same biz activity in the month
3/N
Yet, a rough estimation of my twitter feed this week suggests 95% of people don't understand this. They all started crying
'fake data', 'can't trust China' etc
(as we all know there has not been a 'V' recovery there)
4/N
'fake data', 'can't trust China' etc
(as we all know there has not been a 'V' recovery there)
4/N
The issue is that most people don't think in 'rate of change' (RoC = second derivative) terms, even people who are experts in RoC get PMIs wrong
The PMI represents a MoM growth/reduction in biz activity, it's not an absolute measure of biz activity
5/N
The PMI represents a MoM growth/reduction in biz activity, it's not an absolute measure of biz activity
5/N
The China data really do show that biz activity increased a tiny amount in March vs Feb, as 52 is a little bit over 50. And this agrees with what we have all heard from the ground in China (lockdowns still quite widespread in March, biz not back to normal yet)
6/N
6/N
So let's use two charts to show exactly what a PMI is. And we shall use US data from 2008 recession, no China data anywhere :)
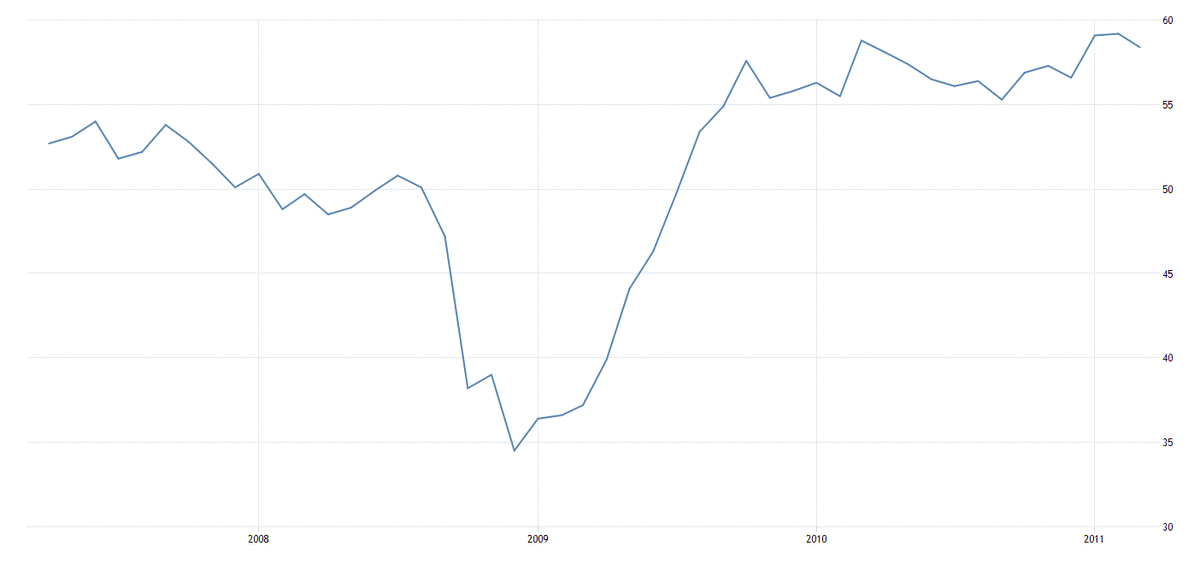
1. US ISM Manufacturing
2. US Industrial Production Index
7/N
1. US ISM Manufacturing
2. US Industrial Production Index
7/N
1. US ISM Manufacturing (from @tEconomics ), shows there is a bottom of sorts in Nov 2008, but if you think this is the bottom of Manufacturing biz activity then think again, this is a RoC chart showing the MoM change = 2nd derivative
8/N
8/N
2. US Industrial Production Index (from FRED), shows there is a bottom in June 2009, this IS the biz activity bottom, as it's the actual index graphed, and the recession ended then as that was the bottom... (by definition = end of recession, it's peak to trough)
9/N
9/N
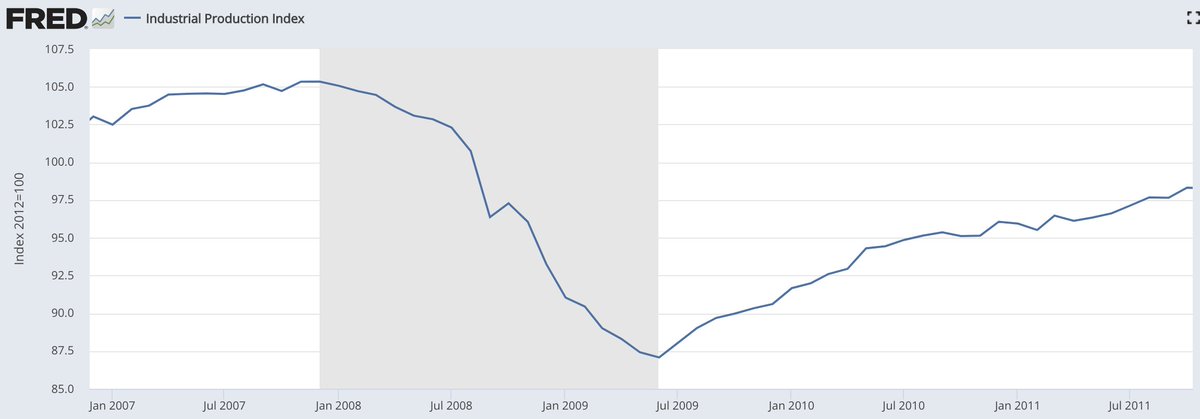
So what is the bottom in the PMI data? It's the maximum RoC of the Index, i.e. the steepest part of the IP Index curve
This occurred in Dec 2008 (see graph #2) and exactly matches the PMI data (which is cool, as PMI = soft survey, and IP = hard data)
10/N
This occurred in Dec 2008 (see graph #2) and exactly matches the PMI data (which is cool, as PMI = soft survey, and IP = hard data)
10/N
Logically therefore, the PMI should be >50 the month after the actual bottom, i.e. Aug 2009 should have a PMI around 50
And as it should be, Aug 2009 is the first month the PMI was >50, confirming this is when on a MoM basis the biz activity was first improving
11/N
And as it should be, Aug 2009 is the first month the PMI was >50, confirming this is when on a MoM basis the biz activity was first improving
11/N
Lots of people just wanted to bash China for whatever reason, but they didn't take the time to think what the PMI data mean
Using US data, we can see the curves show different things, one a RoC (i.e. MoM) and one an absolute measure (i.e. Index)
12/N
Using US data, we can see the curves show different things, one a RoC (i.e. MoM) and one an absolute measure (i.e. Index)
12/N
When Ind Prod was at it's lowest point in the 2008 recession, the PMI was around 50...
If China had posted a 40 PMI after the 35, then it would have shown a further deterioration in biz activity in March as 40 < 50
40 means there is less activity vs previous month
13/N
If China had posted a 40 PMI after the 35, then it would have shown a further deterioration in biz activity in March as 40 < 50
40 means there is less activity vs previous month
13/N
I hope I have laid out the data clearly so you can see for yourself, please do correct tweets that confuse this
I don't want to publicly shame people
14/N
I don't want to publicly shame people
14/N
@Trinhnomics is one who gets this CORRECT, and she was pulling her hair out this week like I was!
I do want to publicly praise her 🙌
15/N
I do want to publicly praise her 🙌
15/N
Please do whatever you can spread the word as I was shocked at how little understanding there was on FinTwit - especially with some of the best known people here
And it will happen with US data very soon...
16/N
And it will happen with US data very soon...
16/N
@AndreasSteno is also fighting the good fight on this too :)