Parliament votes tomorrow to confirm that England will go into its 2nd #COVID19 lockdown from Thursday. Does the data show that it's necessary?

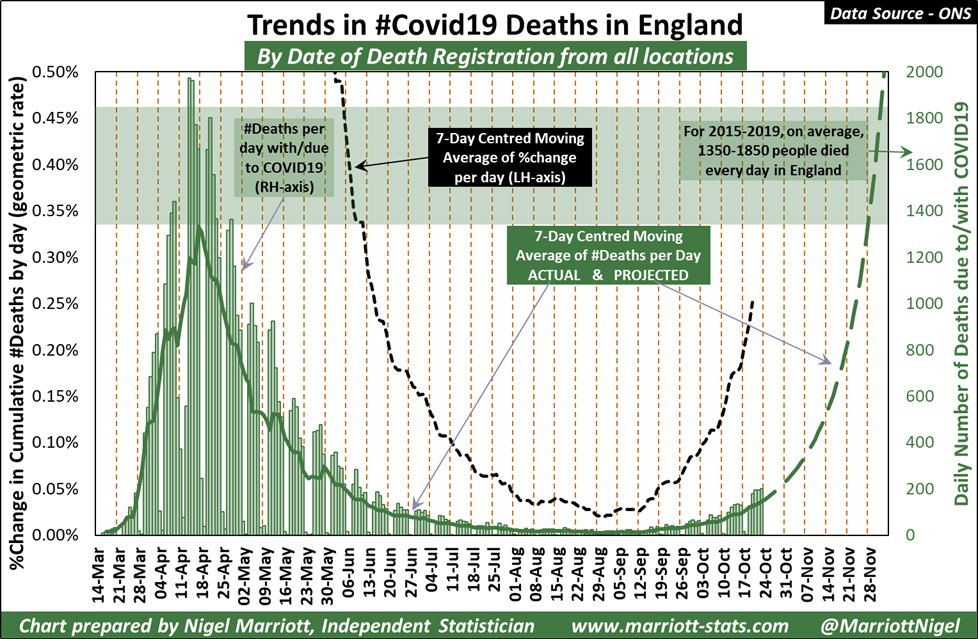
We know that deaths are rising and at present are on trend to overtake the April peak around the 3rd/4th week of November.

But ...1/n
... if cases are already in decline by now, then what will a 2nd lockdown do to help reduce deaths?

At best all it can do is accelerate an existing decline or at worse prevent cases from increasing again.

So are cases about to turn? Nationally, the picture is poised. /2
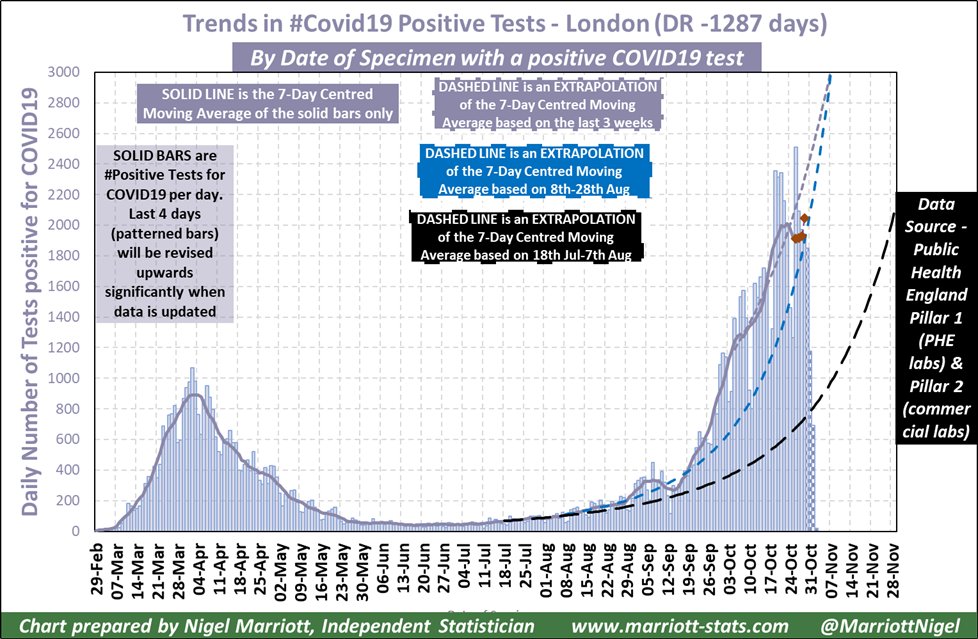
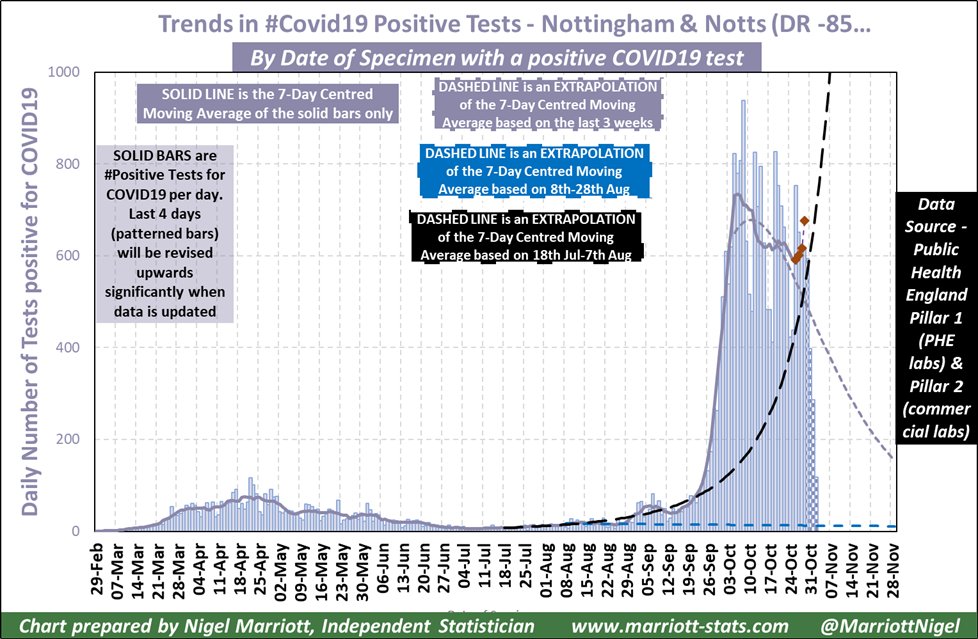
The 7 day centred moving average has turned but potential revisions to the last 7 days could reverse this (red triangles are a short CMA projection based on previous restatements).

The thing to note though is that the latest 7 day CMA is as of 26th October, 1 week ago.

... /3
Thus in a week's time, it may be clearly obvious that a turning was reached before the government announced a 2nd lockdown in which case there may be a clamour to lift it early.

It's worth remembering that the timing of the 2nd wave varied across the country so let's look .../4
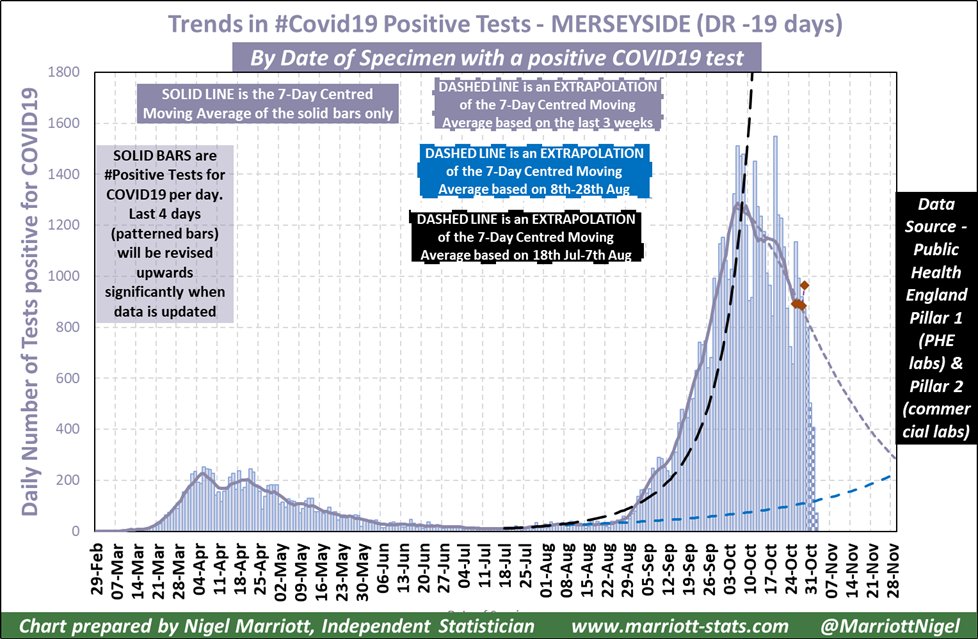
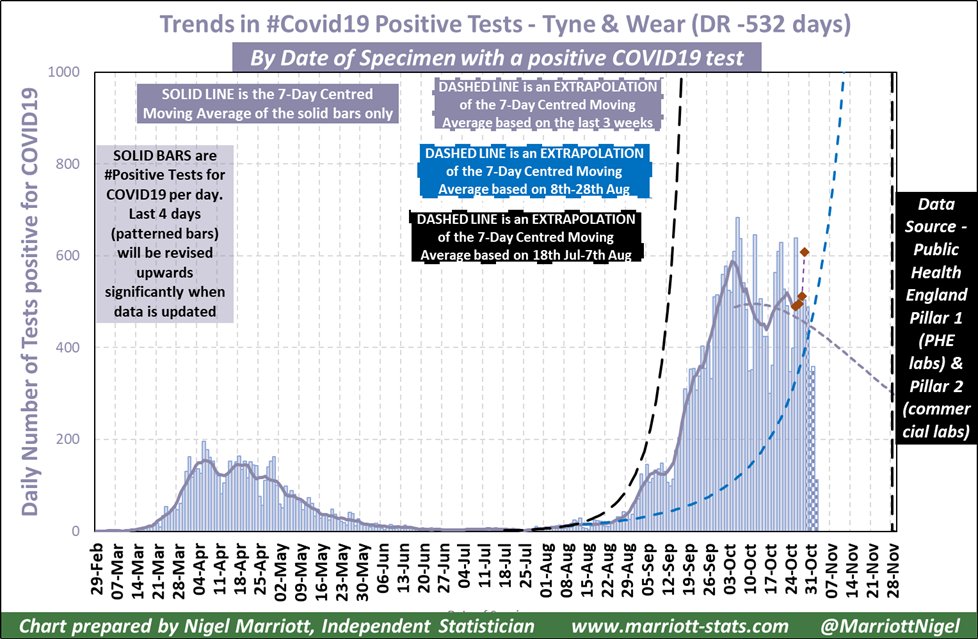
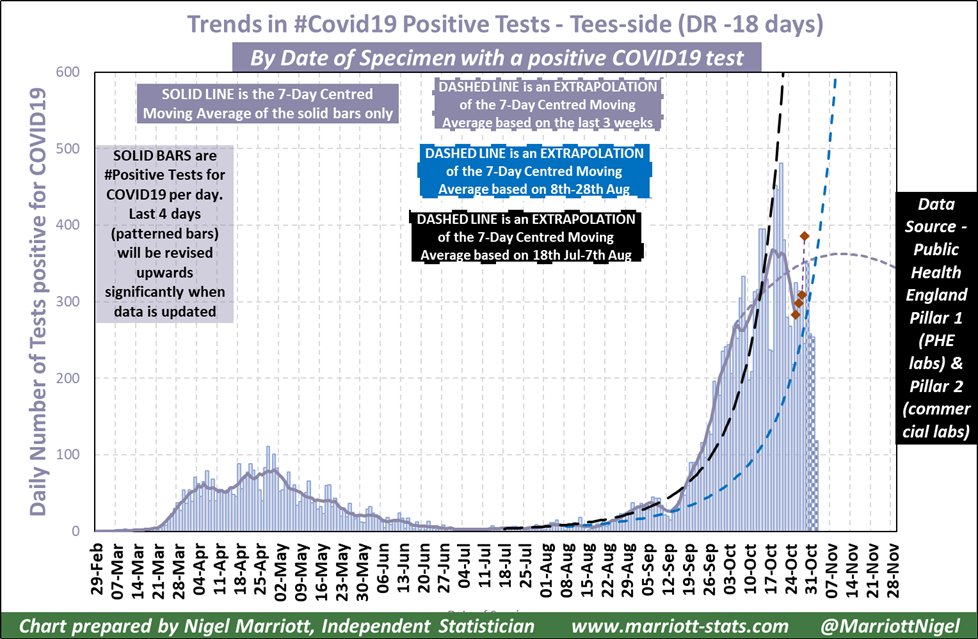
... at the trends in the places at the front of the 1st wave.

Merseyside and Tyne & Wear were among the first places hit and were among the first to be affected when the 3 tier system was introduced at the beginning of October. One has to say that this worked here.

/5
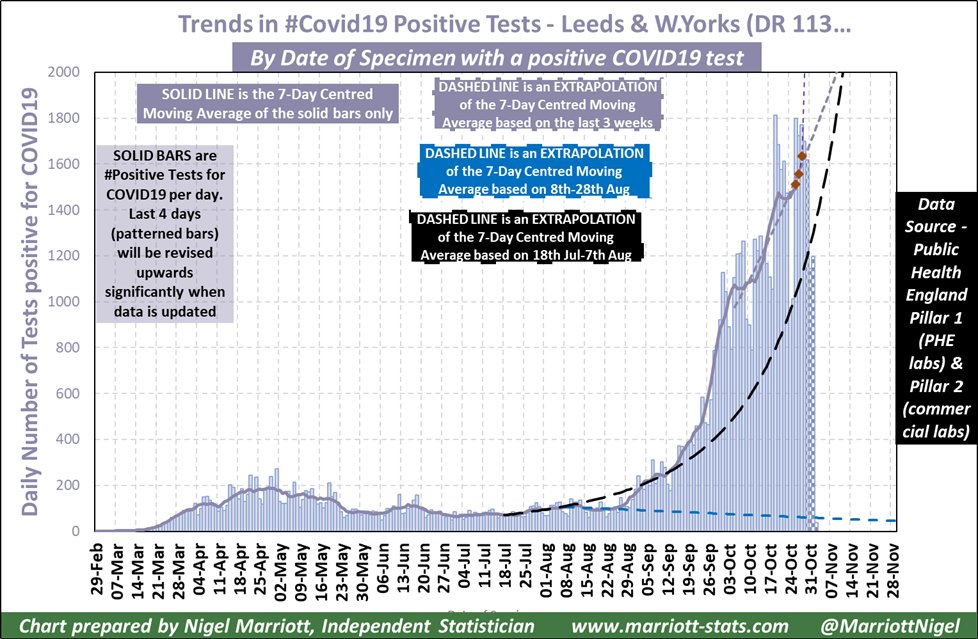
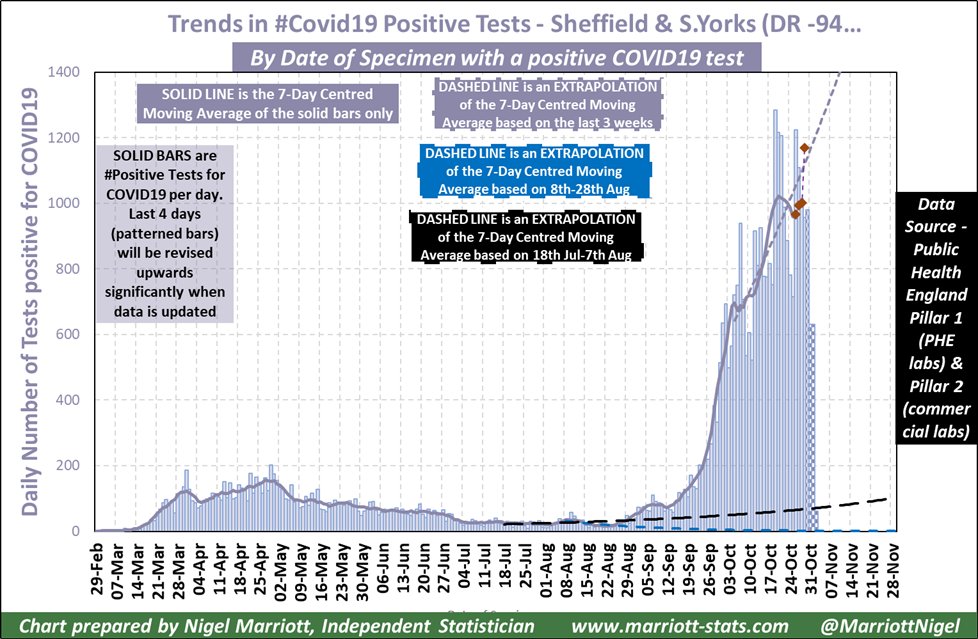
However Gt Manchester and Leeds & W.Yorks have not been as successful. Both look like they are about to turn but it will be next week before we can be sure.

/6
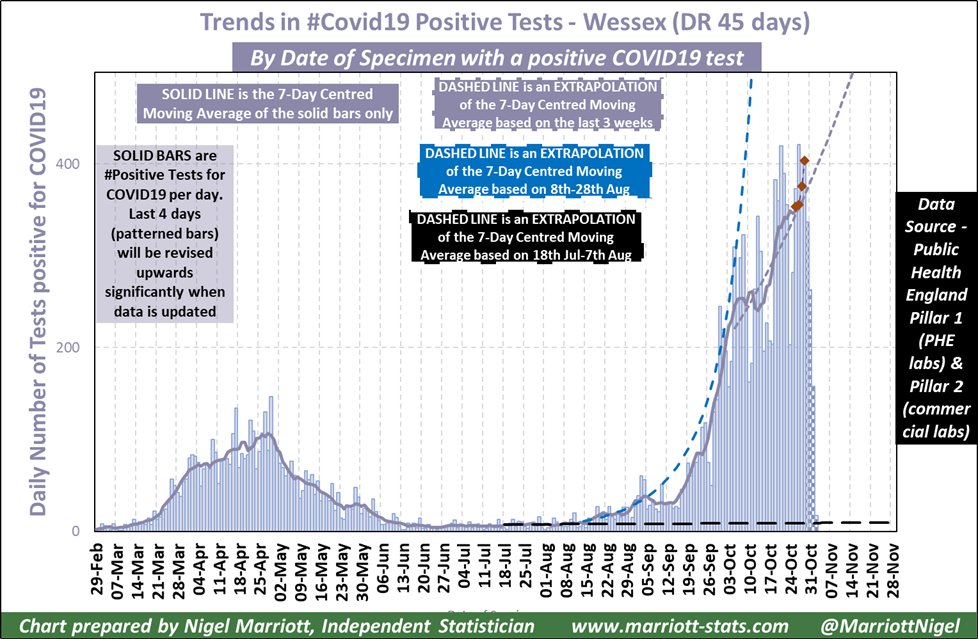
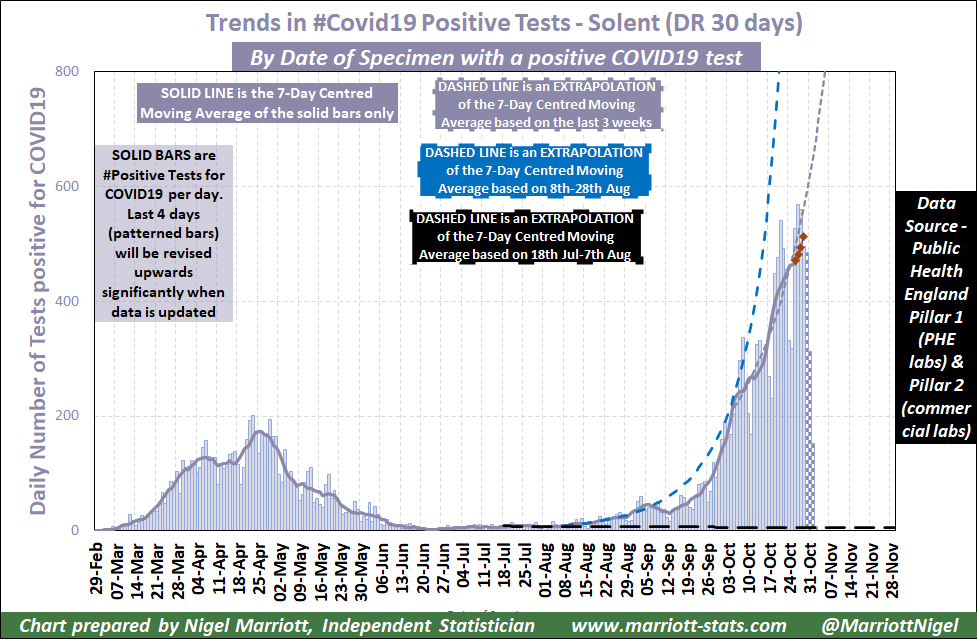
Moving south, the West Midlands (Birmingham & Coventry, etc) and West England (Bristol & Bath area) are still on the upward trend. Given they started later, it's reasonable to expect that it will be another 2 weeks before we are sure they have turned.

But here's the thing. /7
How will we know if the 2nd lockdown had a bigger effect on these areas than simply continuing with the current regional 3-tier system? The answer is we won't unless the effect is very large (which can be detected in the bending of the trend).

My point is that the cases .../8
... we have now are already baked in in terms of hospitalisations and deaths to come in November. A 2nd lockdown now is about reducing the stress on the NHS in December but if cases are turning now and the effect of a 2nd lockdown does little to accelerate the downturn ...

/9
... it won't change what would have happened.

I have to say I feel that continuing with the regional tier system and moving a number of southern areas up into T2 or T3 would have the same effect as putting the whole country into lockdown again.

Am I missing something?

/10
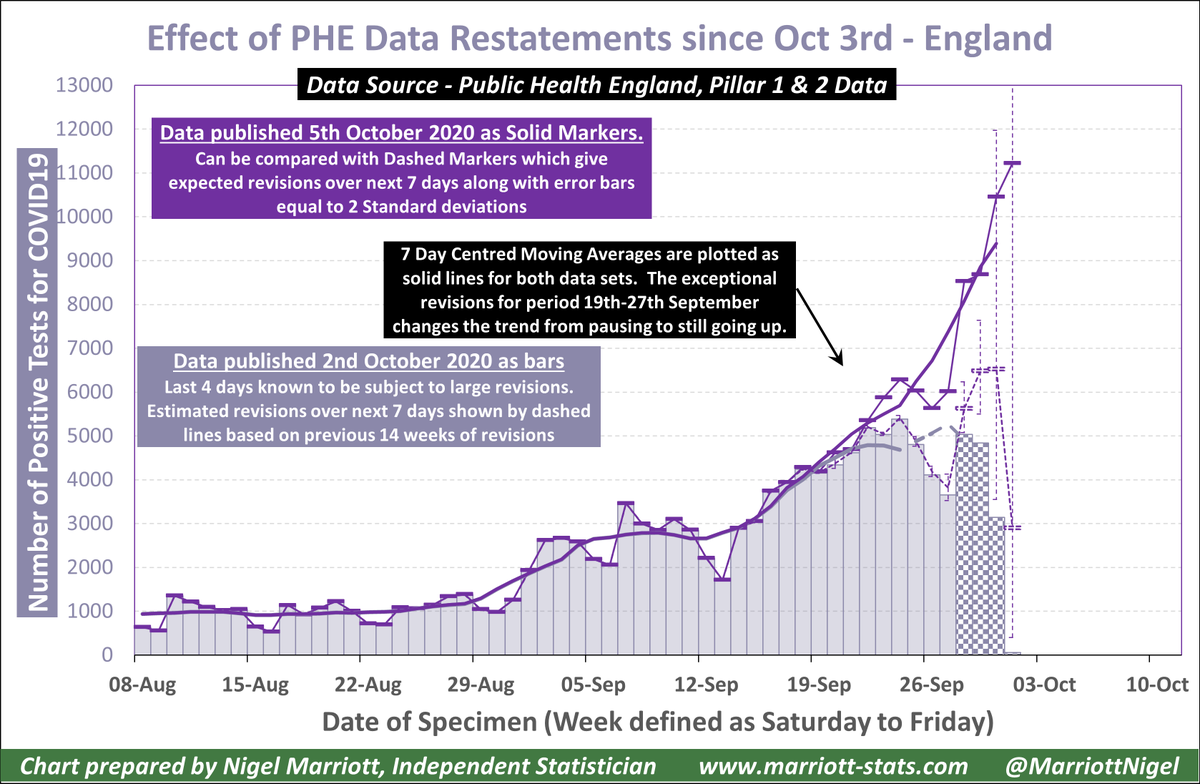
One thing I can think of is that PHE are about to mess up the data again and we will get another rude shock like we did back at the end of September. I don't have a lot of faith in their data management so I don't rule it out.

But could there be something else?

/end

• • •

Missing some Tweet in this thread? You can try to force a refresh
 

Keep Current with Nigel Marriott

Nigel Marriott Profile picture

Stay in touch and get notified when new unrolls are available from this author!

Read all threads

This Thread may be Removed Anytime!

PDF

Twitter may remove this content at anytime! Save it as PDF for later use!

Try unrolling a thread yourself!

how to unroll video
  1. Follow @ThreadReaderApp to mention us!

  2. From a Twitter thread mention us with a keyword "unroll"
@threadreaderapp unroll

Practice here first or read more on our help page!

More from @MarriottNigel

3 Nov
#USPresidentialElections2020 today so I thought I would list some facts and figures you might not be aware of.

This the 59th presidential election in USA and the 56th competitive one.

3 elections saw a candidate elected unopposed 1789, 1792, 1820.

1/n
Of the 55 competitive elections, 36 saw the winner win a majority of both the electoral college (EC) & popular vote (PV).

One, 1800, needed a contingent election in the House of Representatives as well, an oddity that led to the 12th Amendment that could play a part in 2020.

/2
14 of 55 competitive elections saw the winner take the majority of the electoral college with a plurality of the popular vote.

Lowest PV share to win an EC majority was 39.8% by Lincoln in 1860 (his name was not on the ballot in the South) followed by Nixon 68 & Clinton 92.

/3
Read 12 tweets
13 Feb
If this goes viral, I'm claiming the credit for the hashtag!

The #stats behind "Moving to a world beyond p<0.05" bit.ly/2we28Ox should be called #Pexit.

Yes there are parallels between #Pexit & #Brexit as I will explain! /1
First look at the timing.

March 2016 - ASA statement on misuse of p-values bit.ly/2ONg5sX

June 2016 - The UK votes to leave the EU bit.ly/2OMy2be

They were preceded by decades of debate on the use & misuse of P-values & the UK's relationship with the EU.

/2
In September 2016, I attended the @RoyalStatSoc conference in Manchester. #Pexit was a keynote session where @AmstatNews gave its reasons for its statement.

See youtube.com/watch?v=B7mvbO…. I am in the front row taking many notes!

9 mins into that clip is a slide explaining ...

/3
Read 24 tweets
1 Dec 19
Are we going to see a repeat of #GE2017 ? In my Friday post marriott-stats.com/nigels-blog/uk… summarising latest poll trends, I said Labour need to focus on C2DE, Leavers & Lib Dems.

With the polls we've had over the weekend, this thread summarises what I am seeing. /1
CON-LAB lead is unchanged from the start of the election since both LAB & CON are up 7 pts. If this remains the case, it will be a Conservative majority.

Note figures for the latest week includes some from end of last week. My week is defined to be Thurs-Weds. /2
LIB DEMS 1 - Labour needs to first recover its #GE2017 voters lost to the Lib Dems. Having lost 40% of LAB17 voters by the time Theresa May stood down, they've recovered a third. Of the remaining 2/3, half are still with LD&GRN and half with CON&BRX. /3
Read 8 tweets
29 Nov 19
My #GE2019 poll tracker is now up to date on my blog here bit.ly/34u8Bky.

As before, I've compared latest polls to election results from GE74 to #GE17 & broken the data down by region, #GE2017, #Brexit & class.

Full details in the blog but here are the key pts. /1
#ConservativeParty are back to #GE2017 levels in all regions. Votes are being redistributed from remainers to leavers and the key to a majority is the efficiency of this transfer. /2
#Labour are around 10 pts behind where they were in #GE2017. Can they repeat the comeback of GE17 again? The key is reclaiming the defectors to the #LibDems and they have been doing that but they are leaking to the #Tories as well. /3
Read 6 tweets
28 Nov 19
Some excellent points here.

MRP is simply a cleverer model for turning voting intention data into seats.

If you have incorrect polling data, it will cleverly turn that into incorrect seats with more precision.

I had a clever model in #GE17 and look how that turned out! /1
I am not a pollster and so had to rely on published polls that turned out to be wrong in the North & Midlands.

Had the polls been right, my seat forecast would have been near perfect as I demonstrated in my post mortem.

marriott-stats.com/nigels-blog/uk… /2
My biggest regret in #GE2017 was not to realise that this chart I created in my most widely read post during the campaign contained a clue that Labour was doing better than expected in Wales, North & Midlands.

marriott-stats.com/nigels-blog/uk…

/3
Read 4 tweets
29 May 19
OK, if you want to follow the #conservativeleadership race, here is a summary of the declared candidates so far. I've done this as a #Diversity analysis i.e. how much they differ from the norm but I also found it a very good way of getting to know their backgrounds @sundersays /1
Nominations close on June 10th so if people are interested, I will keep this up to date. Once the nominees are known, I will switch to a political summary instead e.g. voting record, years as MP, etc /2
Sticking with the diversity angle, it is interesting to see how #Conservative Prime Ministers started to diverge from the norm after the abolition of the magic circle and the candidates' Difference from Norm scores are on average similar to their predecessors. /3
Read 7 tweets

Did Thread Reader help you today?

Support us! We are indie developers!


This site is made by just two indie developers on a laptop doing marketing, support and development! Read more about the story.

Become a Premium Member ($3/month or $30/year) and get exclusive features!

Become Premium

Too expensive? Make a small donation by buying us coffee ($5) or help with server cost ($10)

Donate via Paypal Become our Patreon

Thank you for your support!

Follow Us on Twitter!