
Today is possibly the apex of this #ArabianMonsoonBurst which began several days ago now. It's hard to imagine it getting bigger than this.
Today's #NorthAfrican #HornOfAfrica and #MiddleEast rainfall forecasts follow.
Today's #NorthAfrican #HornOfAfrica and #MiddleEast rainfall forecasts follow.
The animation above is for 12 hours hence the arriving and departing light effect. As always the engine behind this is the Indian Monsoon which you can see here this morning gathering strength.
A close up from the end of today shows how the big storms over #SaudiArabia are generating new atmospheric rivers of moisture, or plumes, over the Sahara, you can see these top right.
[Note: Atmospheric rivers are often invisible, this one becomes visible as night falls.]
[Note: Atmospheric rivers are often invisible, this one becomes visible as night falls.]
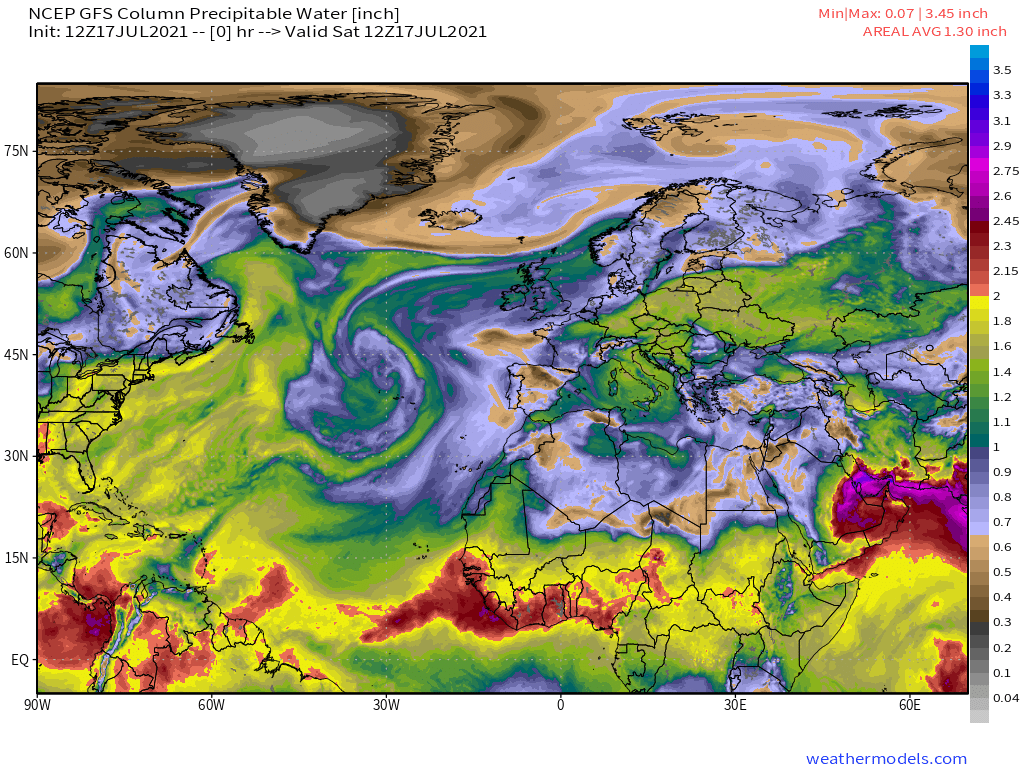
This is my favourite way to visualise this, PWAT anomaly, as it draws the eye to the unusual water activity in the image. In the case in the Middle East and the Sahara. This is a five day simulation and at this point the unusually wet air hasn't yet reached the Sahara.
Finally in this intro section we have an animation over a large area, the monsoon water entering the #MiddleEast is splitting on its leading edge with some heading north east over over Iran into Central Asia.
Today's big picture captures all this and more, a big storm over the Sahel and the ongoing European storms which today have been focussed on Italy and the Balkans. 

Today's 10-Day Rainfall forecasts for North Africa from July 17th through July 28th. The #ArabianMonsoonBurst can be seen very clearly on the far right of the four accumulated rainfall forecasts.


48-hour rainfall forecasts (today and tomorrow from our standard four models: the European @ECMWF, @NOAA's GFS, Canada's CMC and the Korean KMA models. The last, skinniest, one is the ECMWF.


Finally for #NorthAfrica we have the long-range 16-day (GFS) and 12-day (KMA) forecasts - which (as always) remain remarkably well aligned inspite of the 4 days difference.
[NOTE: We will have a better view of forecasts of the #ArabianMonsoonBurst later in the bulletin.]
[NOTE: We will have a better view of forecasts of the #ArabianMonsoonBurst later in the bulletin.]


This is today GFS PWAT simulation - 384 hours (from which the anomaly data shown early is calculated). While it still shows the main burst of moisture pulling back you can see that it continues to pulsate over the 16 day period.
Here we see another view of this, the corresponding 16 day India Monsoon PWAT plot. In this you can see in the later part how a low system over the Bay of Bengal drags moisture up over Bangladesh and how that travels East along the Himalayas into Pakistan.
Today's July 17th 16-day rainfall forecasts for #Ethiopia (+1 12-day from KMA) and the #HornOfAfrica: #Somalia, #Somaliland, east #SouthSudan, south east parts of Sudan, #Djbouti and #Eritrea.
Purple heavy rain covers #Tigray, & #Abbay (#GERD) & #TekezeAtbara basins.
Purple heavy rain covers #Tigray, & #Abbay (#GERD) & #TekezeAtbara basins.


48 Hour forecasts (today and tomorrow) from the same three models.


This animation zeros in on the extraordinary #ArabianStorms which this monsoon burst is bringing and follows them into the evening.
As always @Arab_Storms has been capturing the best storm videos he can find and here is a selection from today, the first from UAE of a flooded road.
https://twitter.com/Arab_Storms/status/1416464634203152384?s=20
This picture of a terrible dust storm being produced by the storms is from Al-Kharj #SaudiArabia, the city in which the King's palace is located near the capital Riyadh.
https://twitter.com/Arab_Storms/status/1416441044149755907?s=20

This flooding video from #Oman looks rather destructive.
https://twitter.com/Arab_Storms/status/1416424608199229440?s=20
These waterfalls also from #Oman, less so.
https://twitter.com/Arab_Storms/status/1416410398505512960?s=20
Back in Saudi Arabia we have a picture of what is presumably the same enormous dust storm arriving in Riyadh.
https://twitter.com/Arab_Storms/status/1416405226886729734?s=20
And a video from Al-Kharg which appears to show that the storm contained a mixture of sand, dust and water.
https://twitter.com/Arab_Storms/status/1416404682138861576?s=20
This video from Riyadh shows some brave soul driving during the dust storm.
https://twitter.com/Arab_Storms/status/1416403733014061060?s=20
And this remarkable video shows another dust storm, this time with thunderclouds towering above it.
https://twitter.com/Arab_Storms/status/1416401128116428803?s=20
& This video of some children playing on a slippery mud flat in Pakistan, also from today seems like a good one to finish on.
Follow @Arab_Storms for more ongoing live storm coverage.
https://twitter.com/Arab_Storms/status/1416331082782453763?s=20
Follow @Arab_Storms for more ongoing live storm coverage.
July 17th 10-Day accumulated rain forecasts for the #MiddleEast from the GFS, CMC, KMA & ACG weather models.
#ArabianStorms
#KSA #Yemen #Oman #Jordan #Sudan #Iran #Syria #GERD #Sudan #DesertRain #UAE
الله أعلم
#ArabianStorms
#KSA #Yemen #Oman #Jordan #Sudan #Iran #Syria #GERD #Sudan #DesertRain #UAE
الله أعلم


48 Hour July 17th (today and tomorrow), accumulated rain forecasts for the #MiddleEast from the GFS, CMC, KMA and ACG weather models.
#ArabianStorms
#KSA #Yemen #Oman #Jordan #Sudan #Iran #Syria #GERD #Sudan #DesertRain
الله أعلم
#ArabianStorms
#KSA #Yemen #Oman #Jordan #Sudan #Iran #Syria #GERD #Sudan #DesertRain
الله أعلم


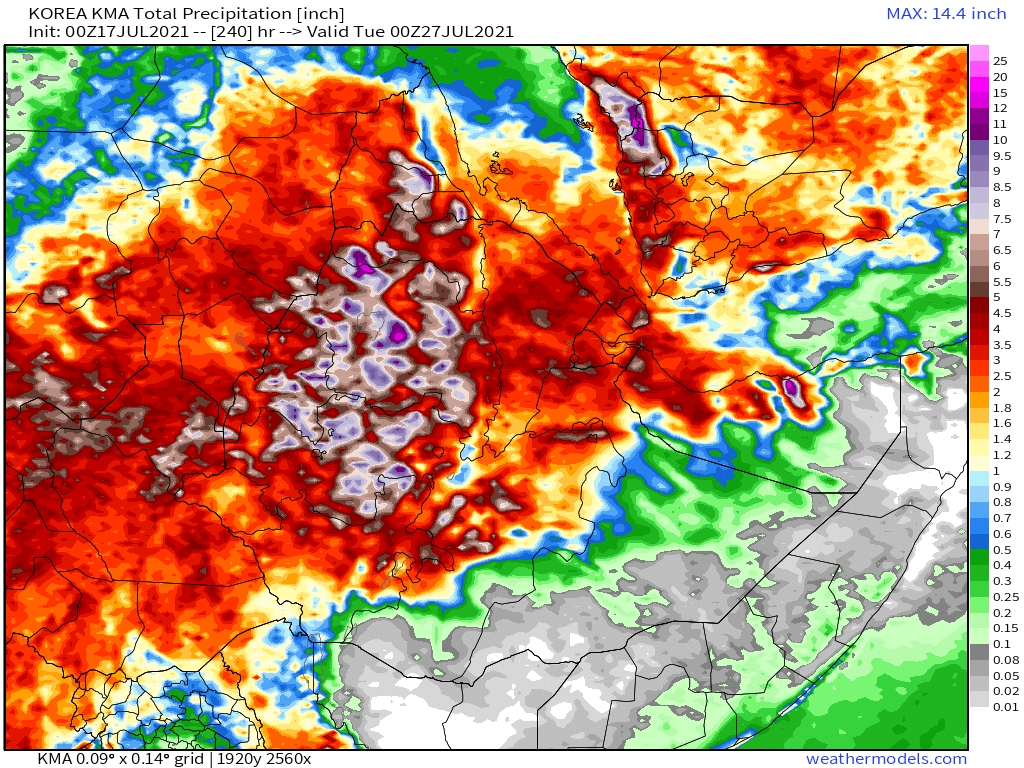
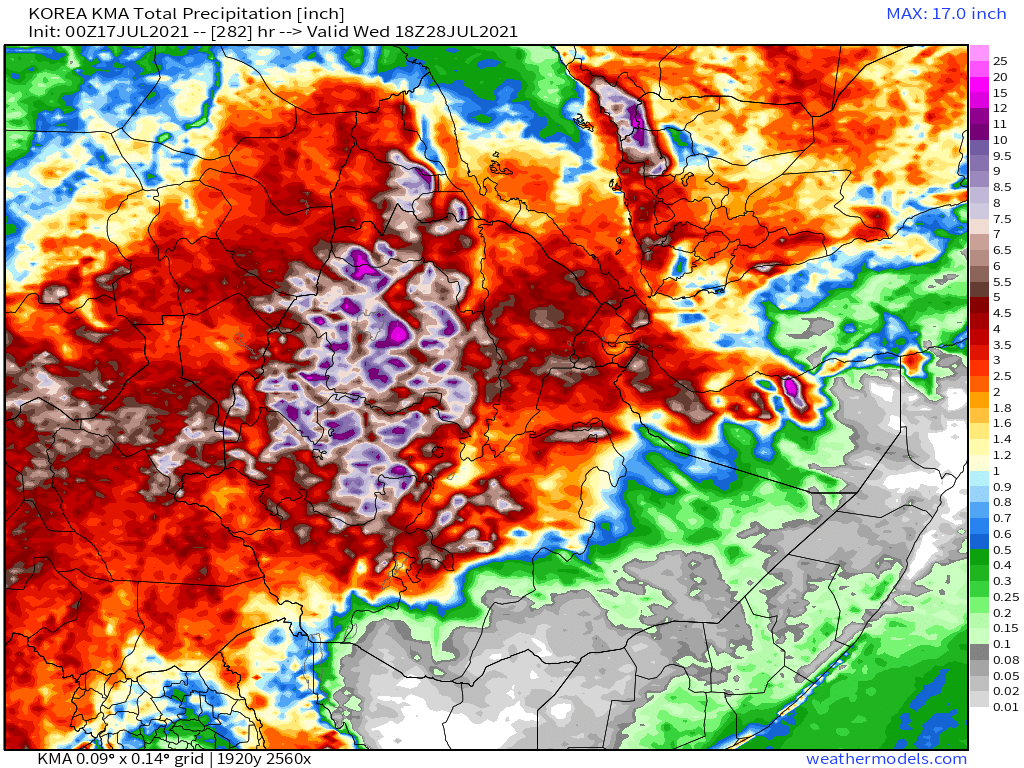
And finally we have today's long-range #MiddleEast July 17th rainfall forecasts.
The16-day GFS & GEFS models, the 12 day KMA and the 15 day EPS (Euro ensemble) model forecasts.
الله أعلم
The16-day GFS & GEFS models, the 12 day KMA and the 15 day EPS (Euro ensemble) model forecasts.
الله أعلم


Here is an accumulating rainfall forecast 10-days from the Canadian CMC model. Of the models the CMC and KMA models have for some time the most ambitious about forecasting rain for the peninsula.
And here we see the KMA's version of how this may play out.
We now move to a big picture view. North Western Hemisphere zero hour simulation data (i.e. now).
1. Precipitable water PWAT anomaly
2. PWAT (potential rain + energy)
3. MLSP (Mean Sea Level Pressure)
4. 250Hpa (jet stream winds approx 11kms high)
1. Precipitable water PWAT anomaly
2. PWAT (potential rain + energy)
3. MLSP (Mean Sea Level Pressure)
4. 250Hpa (jet stream winds approx 11kms high)


This is the Eurasia GFS 16-day PWAT forecast. Two things stand out for me.
1. a potentially large rain system moving through the Kazakhstan desert.
2. The unusual path of what will likely soon by Typhoon Fabian after it makes landfall in China.
1. a potentially large rain system moving through the Kazakhstan desert.
2. The unusual path of what will likely soon by Typhoon Fabian after it makes landfall in China.
Here we see a view of the depression which is expected to turn into cyclone Fabian. Cyclone genesis is a remarkably beautiful and awe inspiring process.
This animation shows a simulation over the same 16-day period of actual rainfall. Purple areas indicate over 12 and up to 25 inches of rain. There is some rain shown in the Kazakhstan desert but not a great deal.
Hopefully the rain in Siberia will dampen the forest fires.
Hopefully the rain in Siberia will dampen the forest fires.
The other large scale map we have covers most of the other inhabited parts of the Northern Hemisphere (absent islands and the US pacific coast). We have three long range PWAT forecasts now for this area to look at GFS (16 days) & CMC and ACG (10 days).
Here's the ACG version.
Here's the ACG version.
I get the impression that the ACG (Australian) and CMC (Canadian) models are leaning a bit on the GFS as the large scale features of all three are both very similar to each other, and all three are very good.
Here's the mother ship's version.
Here's the mother ship's version.
I find this presentation, a 16-day early warning system WRT weather (for the part of the world I now live in) endlessly fascinating.
But it is pretty clear now that these incredible long range models are now an absolutely vital piece of resilience infrastructure for humanity.
But it is pretty clear now that these incredible long range models are now an absolutely vital piece of resilience infrastructure for humanity.
While we can't influence the weather, knowing what is going to happen (or might happen) with up to 16-days warning provides time to prepare. But for this to work effectively:
1. We need to be paying attention.
2. And we need to be willing to tolerate false alarms.
1. We need to be paying attention.
2. And we need to be willing to tolerate false alarms.
These models are also an amazing communication tool. As are services like @zoom_earth and @meteoblue which also provide a means to visualise and begin to understand our changing weather systems.
This animation e.g. shows today's significant storm activity in Europe.
This animation e.g. shows today's significant storm activity in Europe.
We are used to thinking about weather as if it is a local phenomena, we know the sort of weather we get, and we are not that interested in weather that happens to other people.
My current expectation is that with what we are seeing this year, this is about to change.
My current expectation is that with what we are seeing this year, this is about to change.
/ENDS
@Threadreaderapp unroll
@Threadreaderapp unroll
• • •
Missing some Tweet in this thread? You can try to
force a refresh


