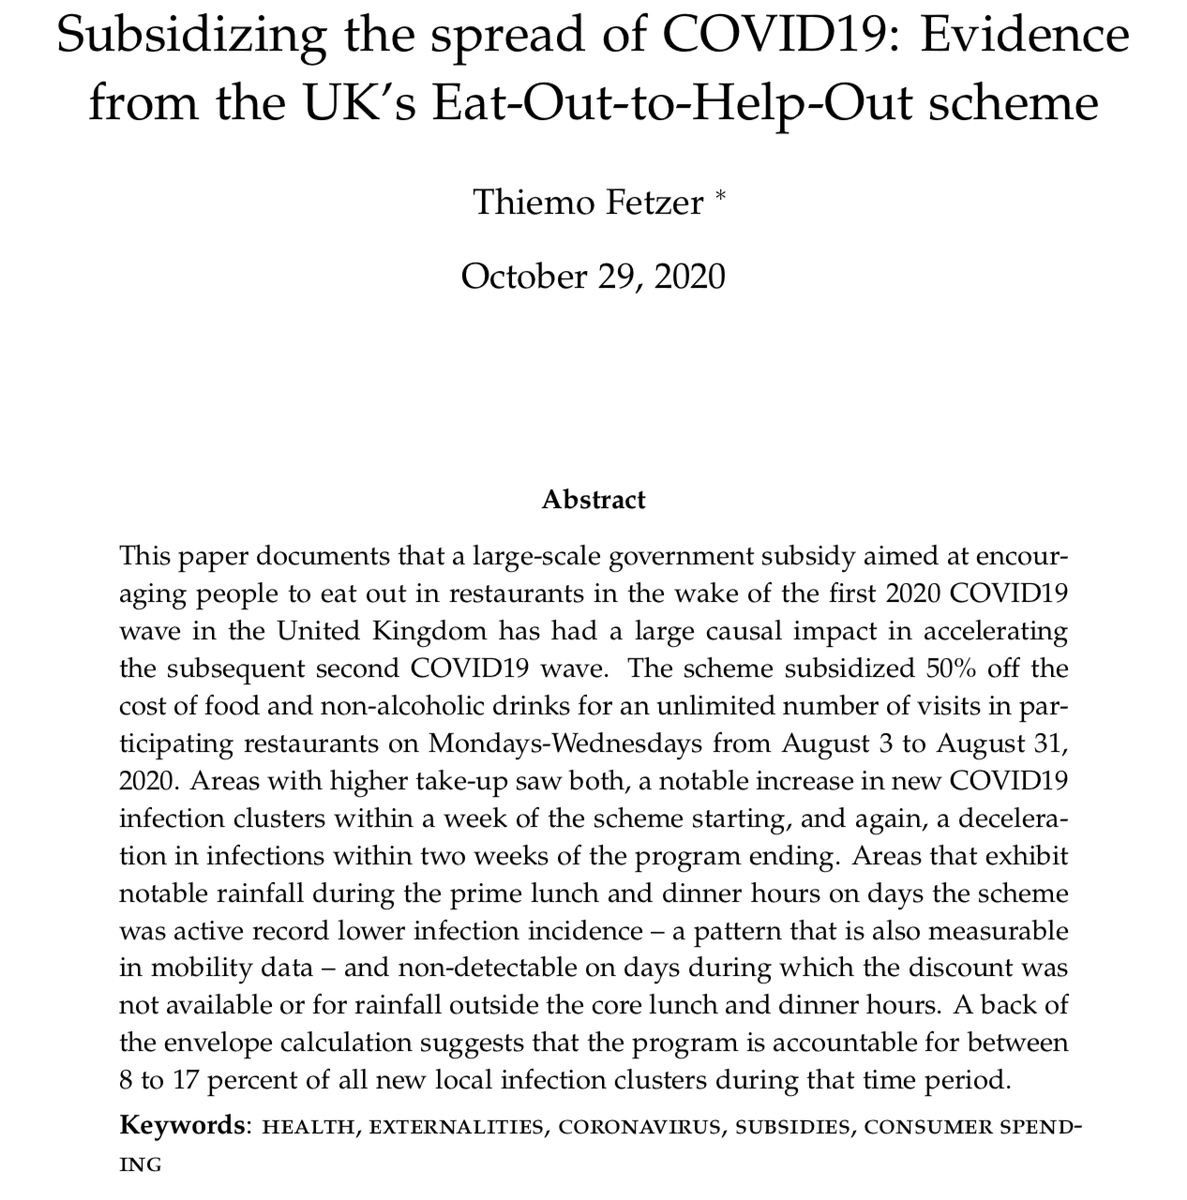
What is the epidemiological impact of a #falsenegative #COVID test? An important question in a high vaxx/low NPI context, but one that cannot be studied in a experiment for obvious reasons. Enter the UK, a reliable supplier of #naturalexperiments. 🧵⬇️
➡️bit.ly/3DhqQv5 Image
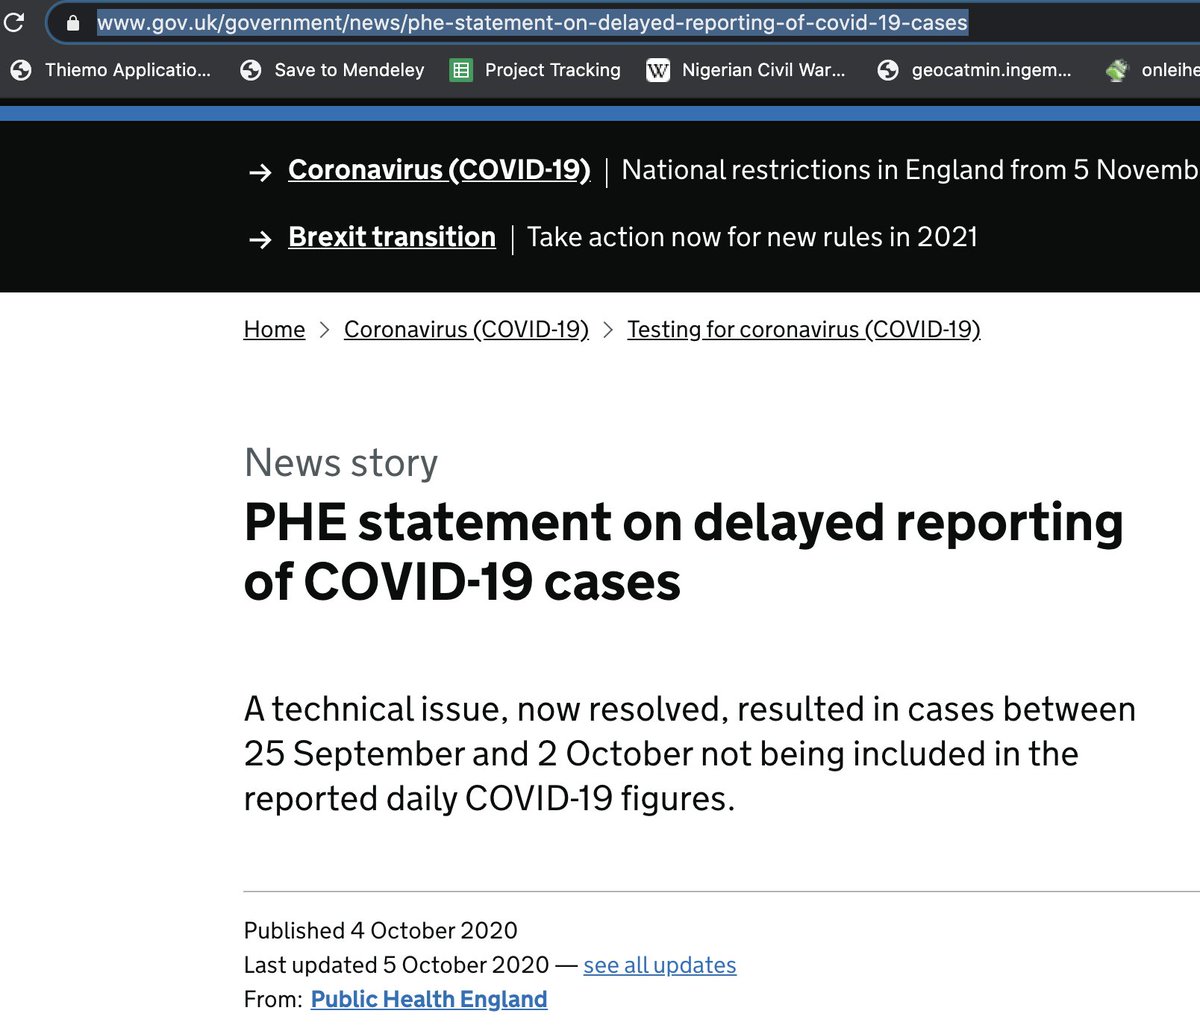
On Oct 15, @UKHSA suspended an #Immensa lab, because of community reports of neg PCR tests following a pos lateral flow. There was loads of excellent reporting e.g. by @rowenamason @tomjs @JamieGrierson. NHS TT estimates that 43,000 individuals may have been given a .. 2/N ImageImage
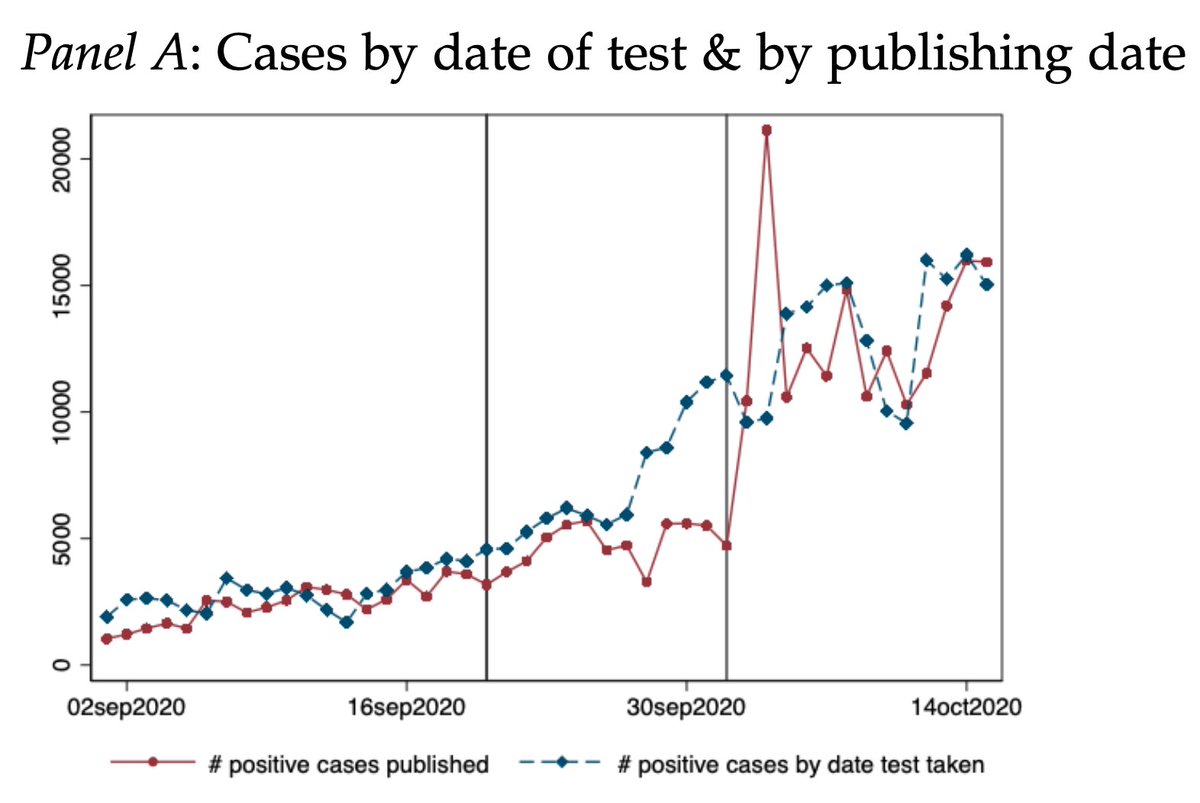
false negative result most concentrated in South West of England. Even across all of England, a notable increase in both absolute # and relative % of PCR tests matched to a positive LFD tests producing a negative result from early Sept to early Oct 3/N Image
this is also visible in overall testing comparing the 13 allegedly most affected districts with the rest of England, you see similar evolution of % of positive tests & # of cases, up until 2 Sept from then on the rates go down, before shooting up after the lab was suspended 4/N Image
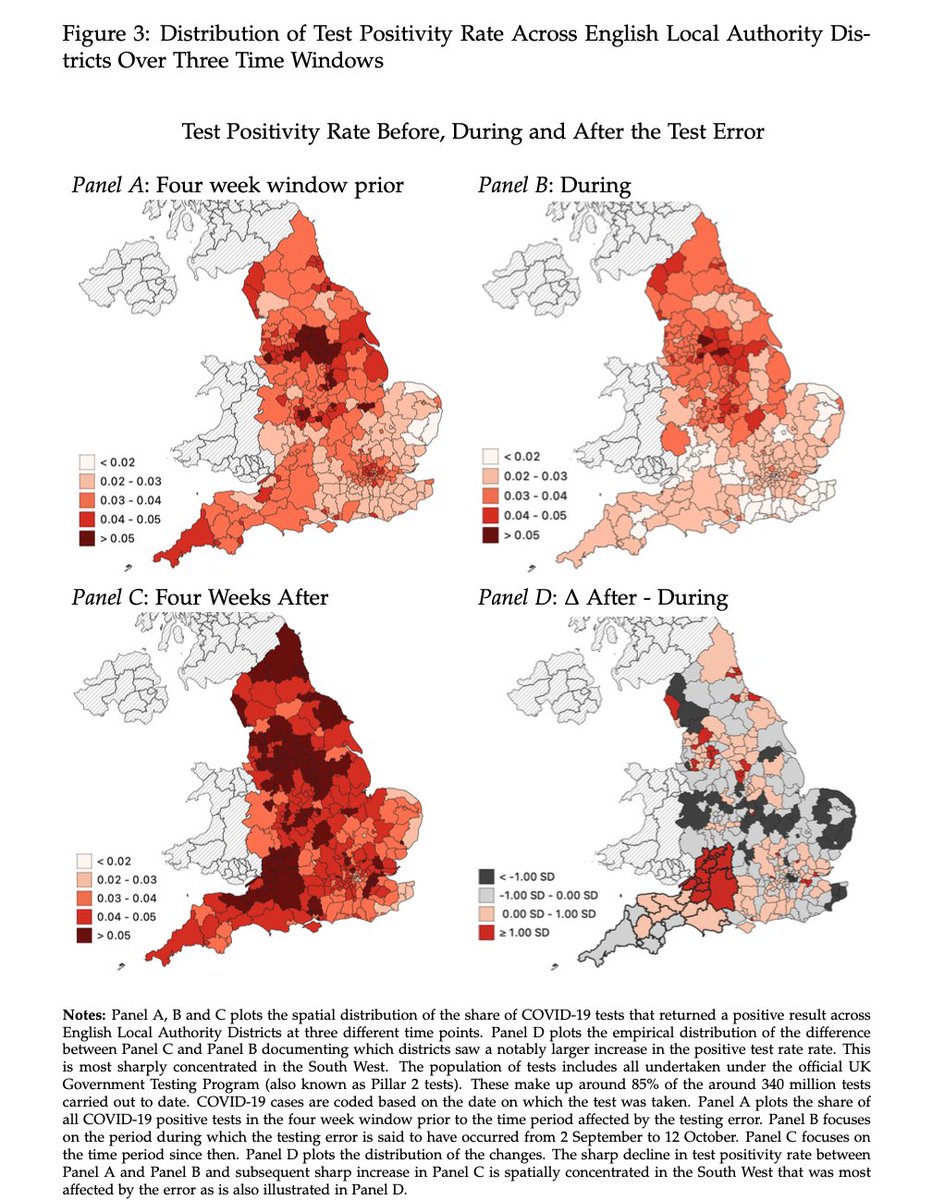
Geographically, map plots the % of positive tests A. four weeks prior to the lab returning false neg; B. the 5 weeks when it was producing false negs; C. & four weeks after. D plots highlights districts in SW standing out with massive ⬆️ in % tests after suspension of lab. Image
So how can we quantify if this testing error impacted #covid19 infections? @BorisJohnson claims the it did not (bbc.com/news/health-58…). We lack granular data, but🤞 a FOI I launched (whatdotheyknow.com/request/immens… ) aims to pry open some data. In the meantime, I used a synthetic.. 5/N Image
control approach focusing on the 13 districts that were said to have been most affected. This allows for a cleaner quantification of the impacts by contrasting case figures relative to a more credible/cleaner counterfactual 6/N Image
Doing so, I estimate that every missed case has lead to between 0.6 to 1.6 additional infections. Combined, this would imply that 43k missed + cases implied between 25 - 68k additional cases. 7/N Image
The analysis is also done district-by-district, suggesting some heterogeneity. But really more data is needed to refine the analysis as it does suggest that the % of tests processed by the Wolverhampton lab varied over time. 8/N ImageImageImageImage
The lumpiness of missing cases on specific dates suggests that errors may have been due to faulty equipment, environmental conditions or consistent mishandling in specific days/shifts. The @Independent @samueljlovett had a piece with a whistleblower independent.co.uk/news/health/co… 9/N Image
Now where to take it from here? It's imperative that a full independent investigation is carried out of what went wrong. Maintaining trust in the testing system & the guidelines is key, but so is accountability and transparency. The pandemic has been a financial boon to many 10/N
many firms that were awarded huge contracts without tender. The UK testing system is much better than what exists in e.g. Germany, but it has cost taxpayers around GBP 37 bn. So its evident there needs to be more public scrutiny & its crucial academics get the right data 11/N.
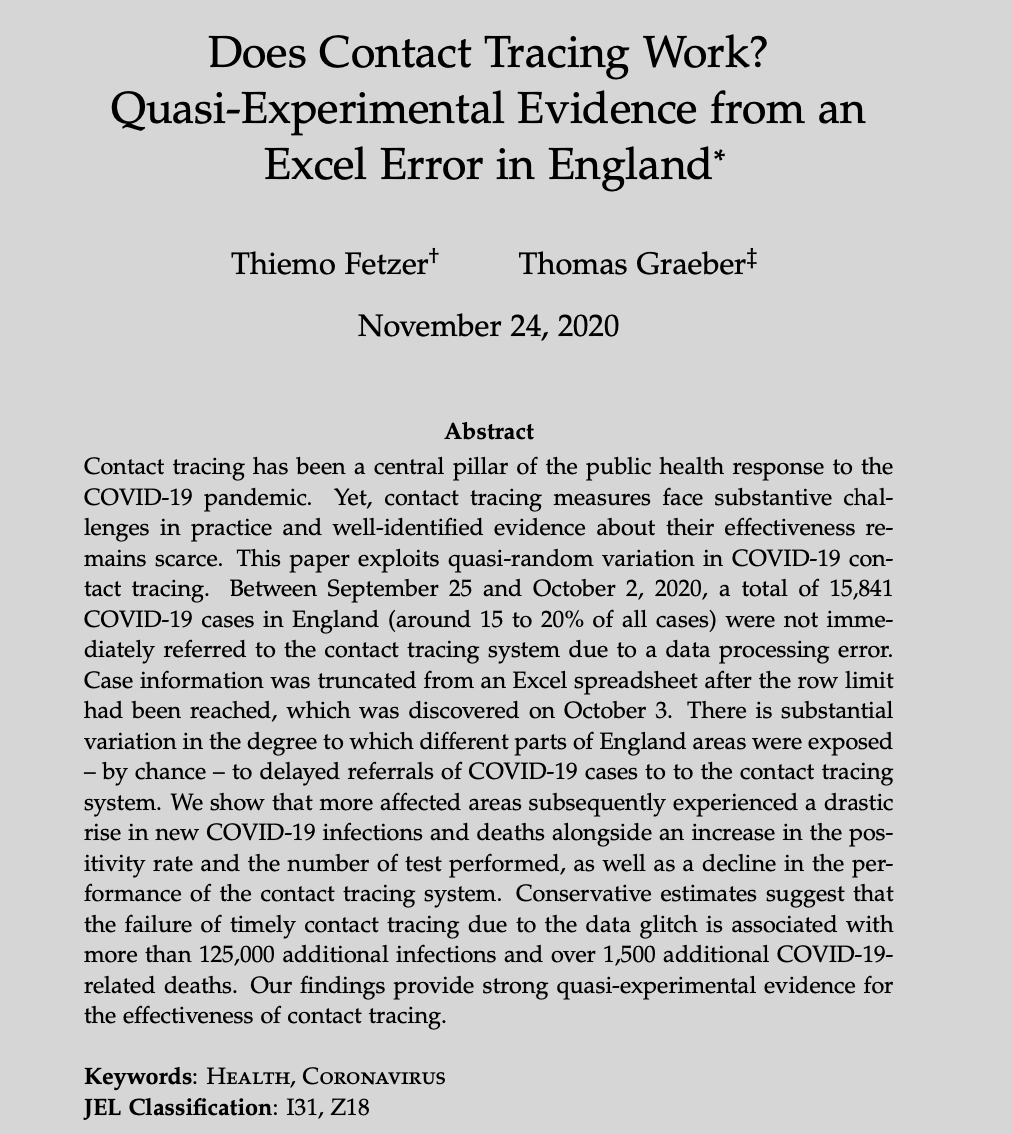
And here is the @cage_warwick Working Paper version: warwick.ac.uk/fac/soc/econom…

• • •

Missing some Tweet in this thread? You can try to force a refresh
 

Keep Current with Thiemo Fetzer

Thiemo Fetzer Profile picture

Stay in touch and get notified when new unrolls are available from this author!

Read all threads

This Thread may be Removed Anytime!

PDF

Twitter may remove this content at anytime! Save it as PDF for later use!

Try unrolling a thread yourself!

how to unroll video
  1. Follow @ThreadReaderApp to mention us!

  2. From a Twitter thread mention us with a keyword "unroll"
@threadreaderapp unroll

Practice here first or read more on our help page!

More from @fetzert

23 Jun
Today is the 5th year anniversary of the 2016 EU referendum vote in which the UK had narrowly voted to #Leave the European Union. Unlike Trump, the impact is permanent and already caused notable damage. Here is a 🧵 of 🧵 with some past work and deliberations on #Brexit... 1/...
In one of the first papers we asked "Who voted for #Brexit?". The paper is a systematic correlational analysis of what is common to #Leave support across districts and within cities & we also show that a #Brexit model can predict LePen voting. Link: goo.gl/VzBo57 2/
Similarly, we augment the analysis using individual level data. This helps tackle whether correlational district level evidence is due to ecological fallacy. Open access at @ejprjournal goo.gl/sPzzwf 3/
Read 12 tweets
9 Mar
So I am going to report on some lack of progress about a #FOIA request we launched to @PHE_uk last Nov to make data available on the #Excel error that resulted in 15k #COVID19 cases to not be contact traced in a timely fashion (whatdotheyknow.com/request/region…). The response so far is ...
quite underwhelming. In the paper we reverse engineer the geographic distribution of the missing cases which is far from perfect. We find that places with higher exposure to the contact tracing error saw a notable differential increase in infections and subsequent deaths.
Naturally we would much rather prefer to work with the actual data as the measurement will be more precise. And further, it would allow for a direct measurement of infections among contacts of individuals that were traced with a delay. But @PHE_uk do not consider this is of
Read 5 tweets
28 Feb
So @UKHofficial did have a look at my paper on #EOHO and #COVID19 - they have gone to some lengths to try to cast doubt about my research, the methods & results (see ukhospitality.org.uk/page/SafeReope…). So here are their point-by-point lines of attack on my work and my response. Thread 🧵⬇️
Point 1: Misunderstanding the research design and aggregate data fallacy 1/
Point 2: Actually, EOHO did not increase restaurant visits that much. 2/
Read 16 tweets
24 Nov 20
Timely #ContactTracing does matter fighting #COVID19. In a new paper (➡️ bit.ly/394Ebuo) we study a bizarre #Excel error in England that caused 16k cases to NOT be contact traced. We econometrically can link this blunder to ~ 120k new cases & 1.5k deaths...🧵⬇️1/N
Studying non-pharmaceutical interventions to fight #COVID19 is HARD because we hardly ever isolate specific individual policies as often many measures are taken together (lockdowns, school closures, masks,...). For #ContractTracing we also have mostly correlational evidence...2/N
Enter the English Test&Trace system hastily built on, what appears to be a set of XLS spreadsheets giving us a consequential natural experiment. On Oct 4, PHE announced that ~ 16k #COVID19 cases were not correctly reported resulting in a large jump in reported cases.. 3/N
Read 15 tweets
30 Oct 20
Today I m sharing another paper on unintended consequences of a UK policy which makes me cringe at how my tax money is spent all the while debating #FreeSchoolMeals "Subsidizing the spread of COVID-19: Evidence from the UK’s #EOHO scheme". ➡️ bit.ly/3ed5Slo a thread🧵⬇️
The EOHO scheme was conceived to help the hard-hit restaurant businesses in the UK in the wake of 1st #COVID19 wave. The scheme cut the cost of meals & non-alcoholic drinks by up to 50% across tens of thousands of participating restaurants in the UK from 3 to 31 August 2020. 1...
The research leverages data from #HMRC’s own #EOHO restaurant finder app which was the go-to platform for people searching for EOHO restaurants in their neighbourhood, together with weekly data on new #COVID-19 infections measured at the granular MSOA level (5-10k residents) 2...
Read 12 tweets
16 Jul 20
Happy to see my new paper "Measuring the Regional Economic Costs of #Brexit: Evidence up to 2019" feature in @FinancialTimes. For interactive map ➡️ brexitcost.org, the FT article ➡️ ft.com/content/90e988…, the paper ➡️ bit.ly/2C9BOIg a short summary ⬇️ 1...
We use the synthetic control method previously used by @JohnSpringford @bornecon @MSchularick studying #Brexit-vote economic impact on the UK as a whole, just that we study regional economic output. The UK wide exercise is published in the @EJ_RES bit.ly/3j2zt2V 2...
We apply (a lot of variations) on regional quarterly GDP as well as annual district-level Gross-value added data for the UK. In total, for districts we construct a total of 100+ synthetic control estimates to assess concerns of overfitting - below plot is the case of Lewisham 3..
Read 10 tweets

Did Thread Reader help you today?

Support us! We are indie developers!


This site is made by just two indie developers on a laptop doing marketing, support and development! Read more about the story.

Become a Premium Member ($3/month or $30/year) and get exclusive features!

Become Premium

Too expensive? Make a small donation by buying us coffee ($5) or help with server cost ($10)

Donate via Paypal

Or Donate anonymously using crypto!

Ethereum

0xfe58350B80634f60Fa6Dc149a72b4DFbc17D341E copy

Bitcoin

3ATGMxNzCUFzxpMCHL5sWSt4DVtS8UqXpi copy

Thank you for your support!

Follow Us on Twitter!

:(