Thiemo Fetzer Profile picture
24 Nov, 15 tweets, 10 min read
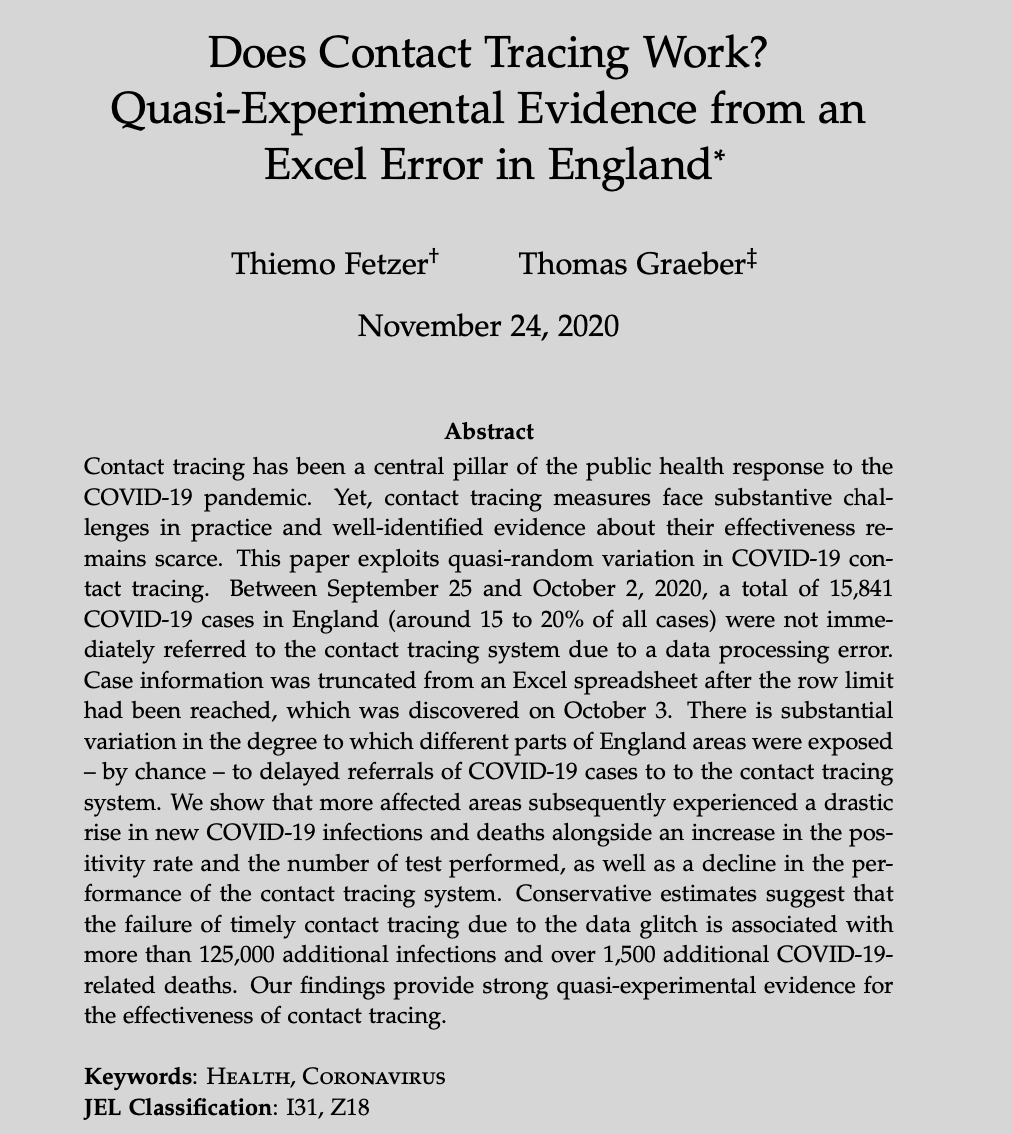
Timely #ContactTracing does matter fighting #COVID19. In a new paper (➡️ bit.ly/394Ebuo) we study a bizarre #Excel error in England that caused 16k cases to NOT be contact traced. We econometrically can link this blunder to ~ 120k new cases & 1.5k deaths...🧵⬇️1/N
Studying non-pharmaceutical interventions to fight #COVID19 is HARD because we hardly ever isolate specific individual policies as often many measures are taken together (lockdowns, school closures, masks,...). For #ContractTracing we also have mostly correlational evidence...2/N
Enter the English Test&Trace system hastily built on, what appears to be a set of XLS spreadsheets giving us a consequential natural experiment. On Oct 4, PHE announced that ~ 16k #COVID19 cases were not correctly reported resulting in a large jump in reported cases.. 3/N
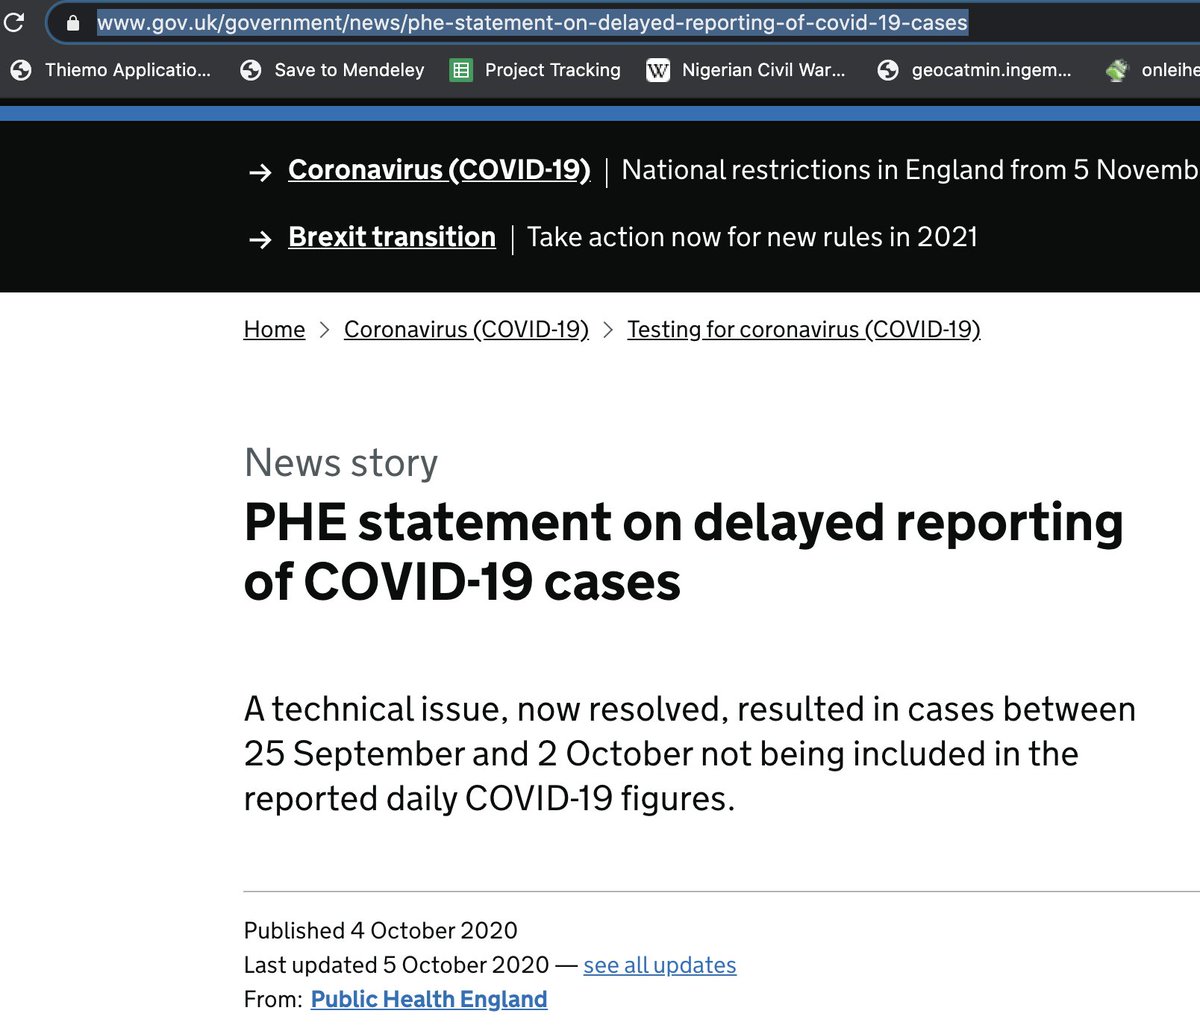
The reason was an XLS file reaching its max # of rows resulting in case-information to be truncated. This affected individuals taking tests from as early as Sept 20 who were themselves informed of their test result, but whose case was not contact traced until earliest Oct 3. 4/N
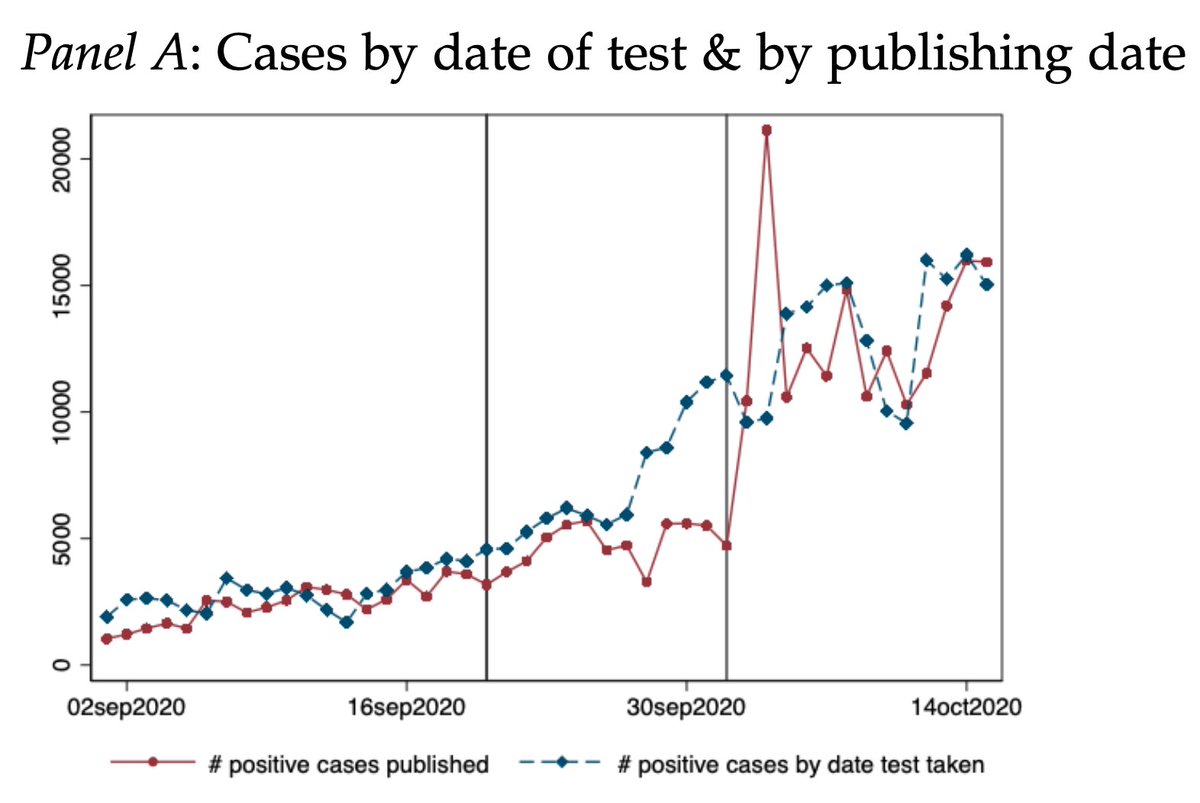
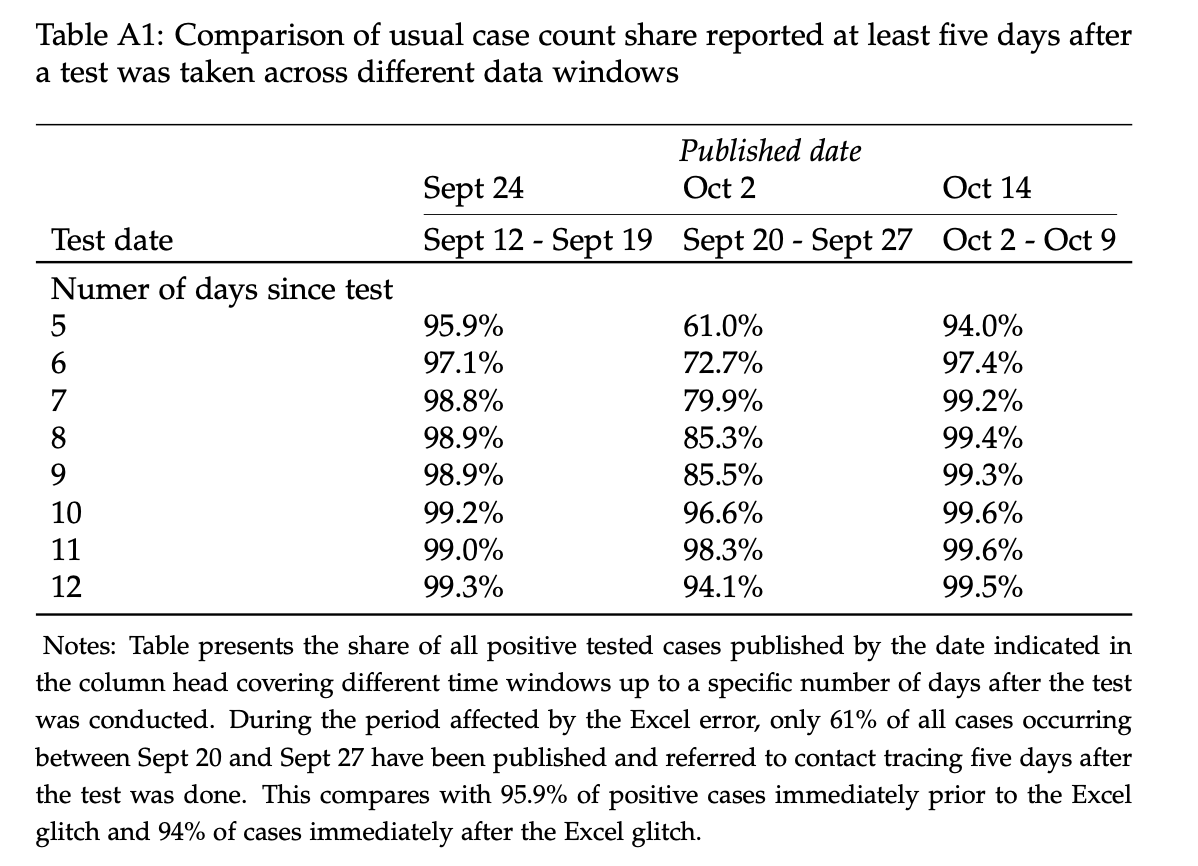
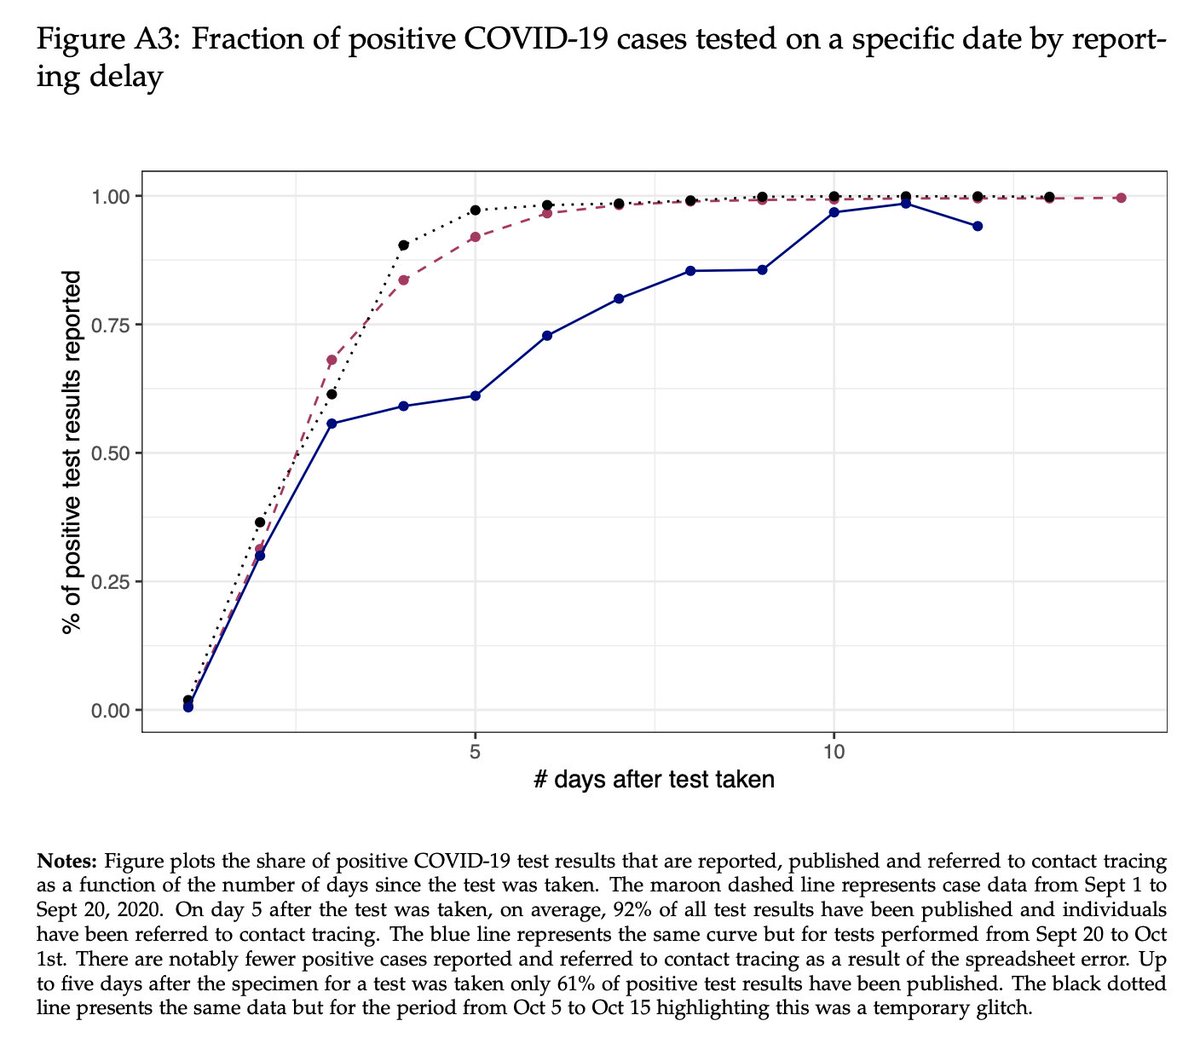
The #PHE statement is obfuscating things a bit but we we can quite well identify where those missing cases are geographically from public data. How do we do that? Usually we expect at least 95% of tests to report back within 5 days of the test date. 5/N
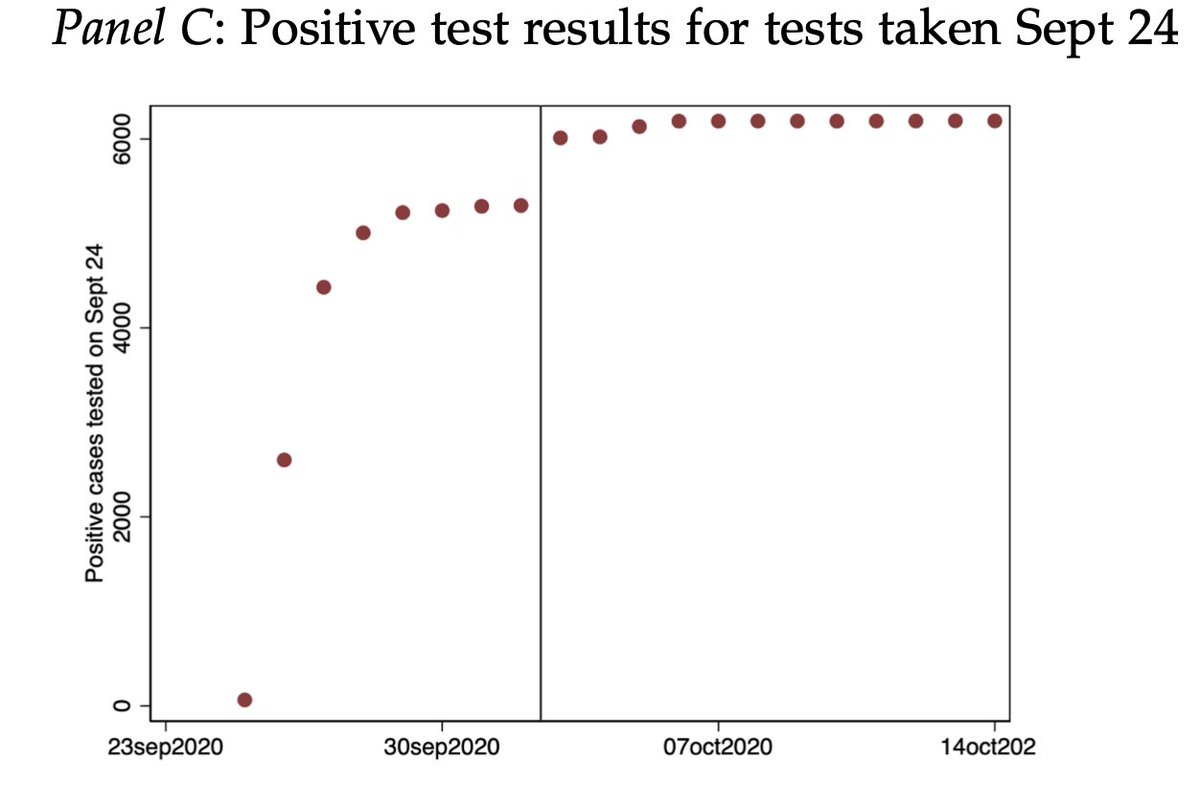
Below, we look at jumps in #COVID19 cases reporting for tests taken on on Sep 24. We observe the case count "converges" as labs take some time but there is a notable jump on Oct 3 of almost 1k new cases 9 days after. Such jumps are visible for most days btw Sep 20 to Oct 2. 6/N
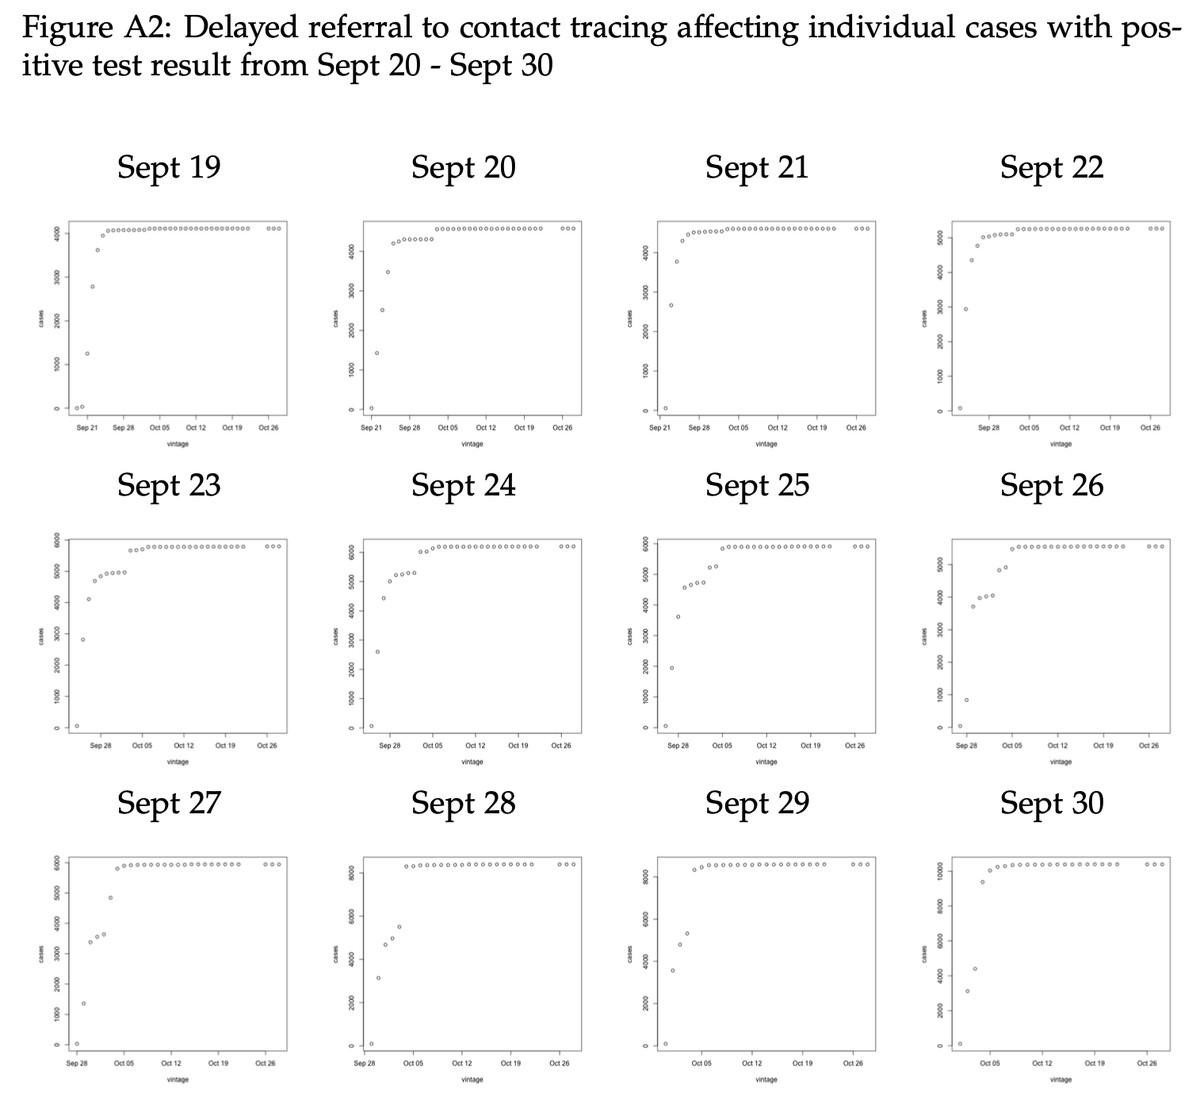
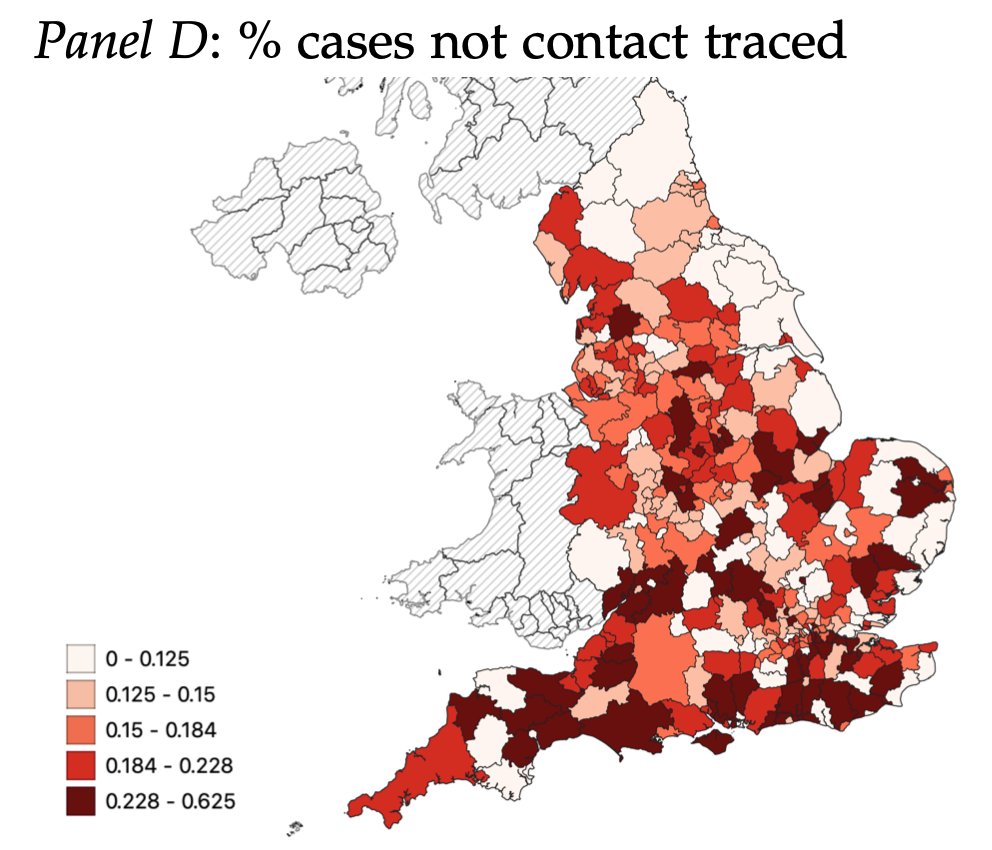
Focusing on specimen dates (i.e. people who tested) between Sept 20 to Sept 27 we can be certain to not confound lab delays. This measure gives us ~7250 #COVID19 cases not contact traced until 7-14 days after the test was taken. They are not evenly spread across England. 7/N
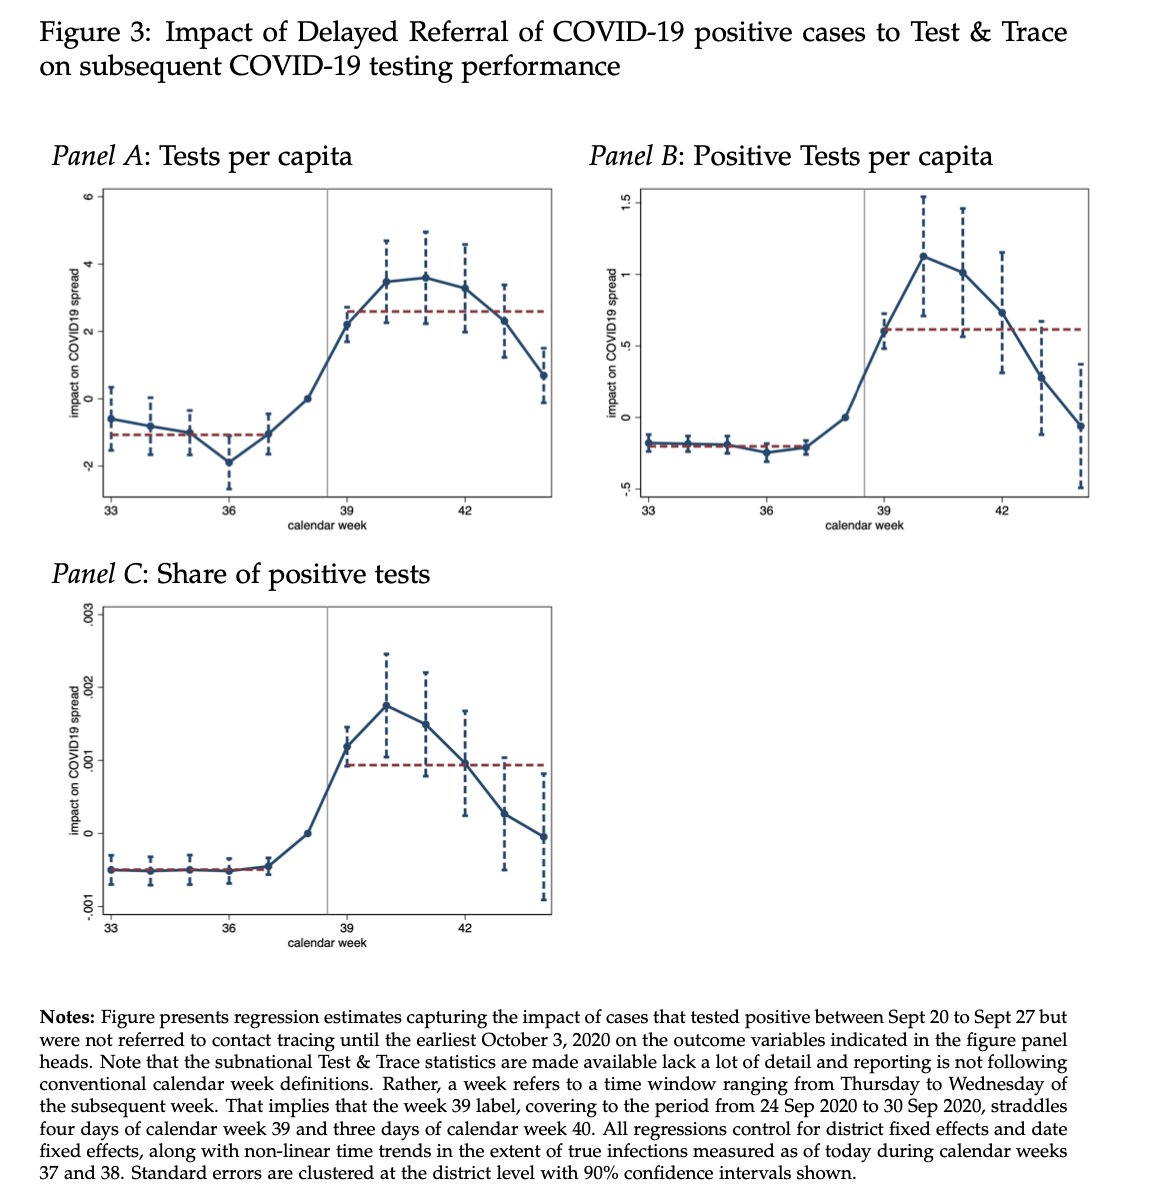
In the DID exercise we compare areas that had more or less exposure to the Excel error, taking into account a host of factors. The estimates imply that for every non-contact traced case, on avg, there are 0.4-0.6 new daily infections between calendar weeks 39 to 44. 8/N
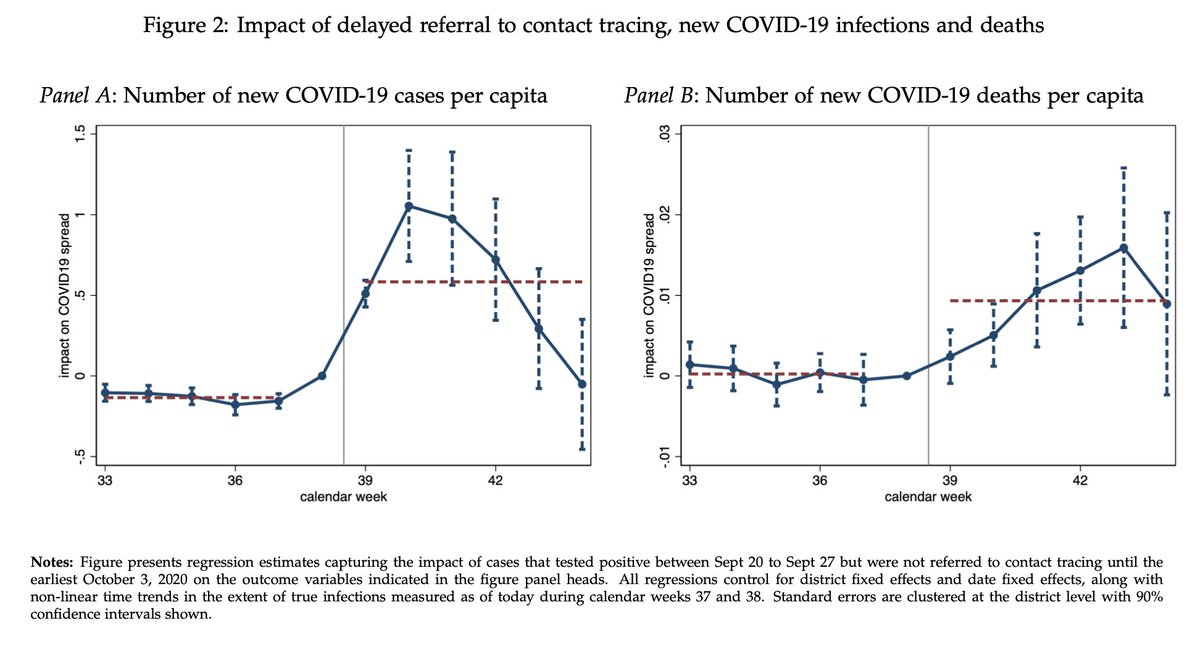
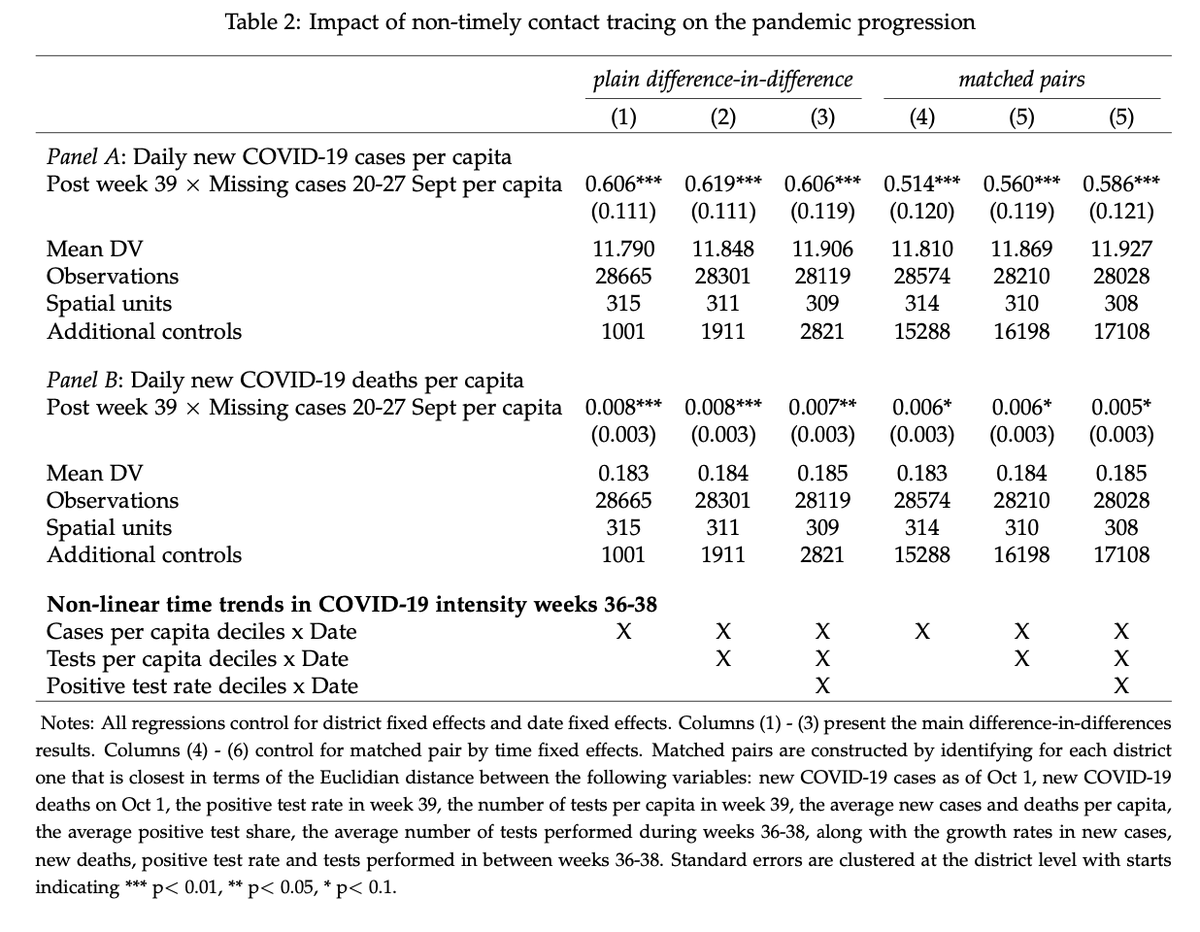
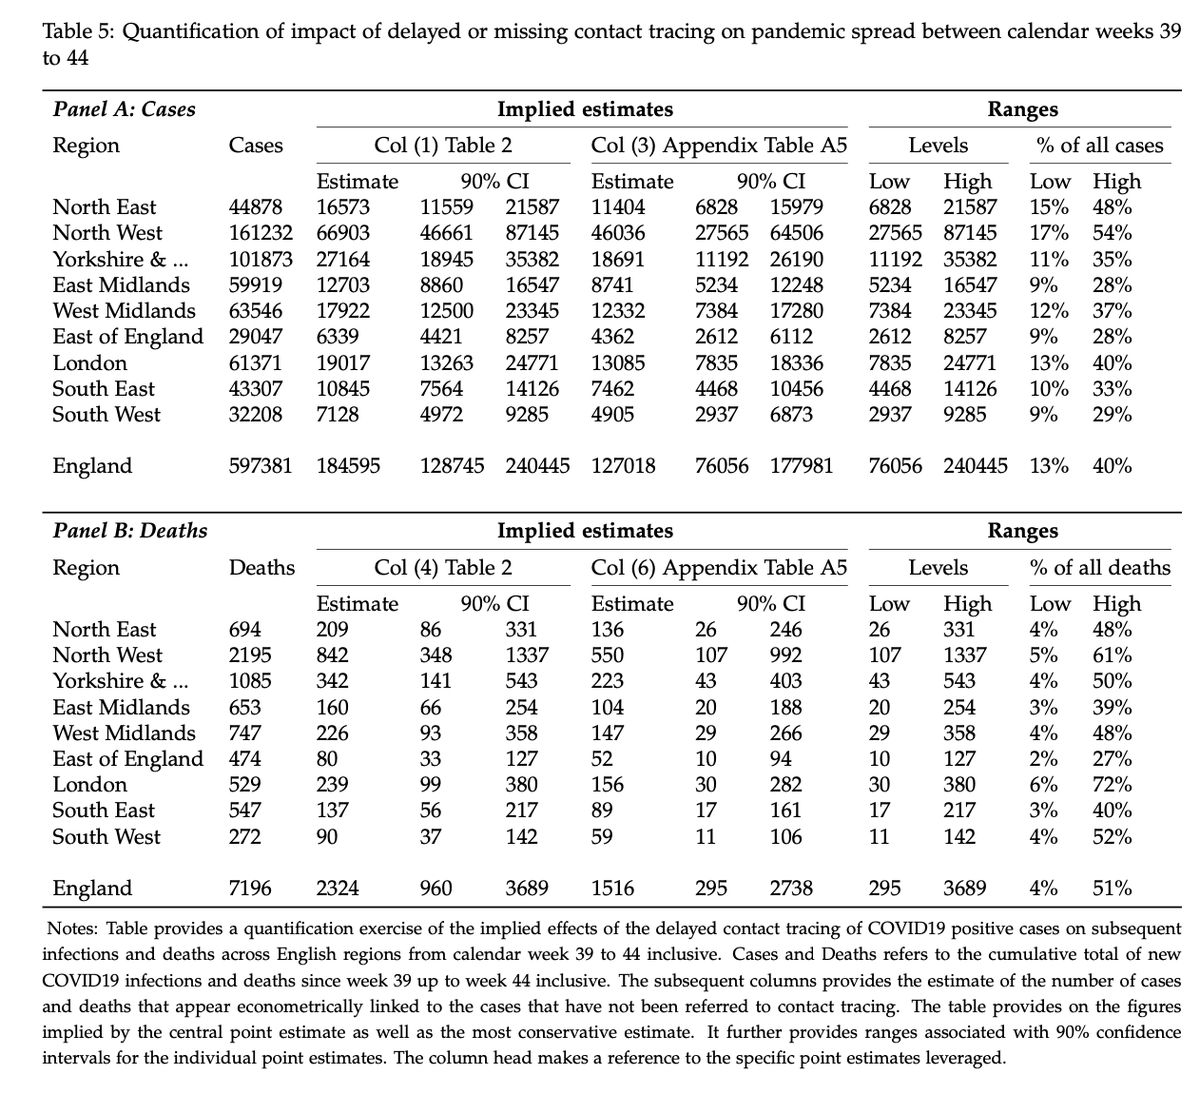
Taking together we find 120k #COVID19 cases & 1500 deaths linked to those cases that were not referred to #ContactTracing in time. This represents ~ 20% of all new COVID19 cases during weeks 39-44. 9/N
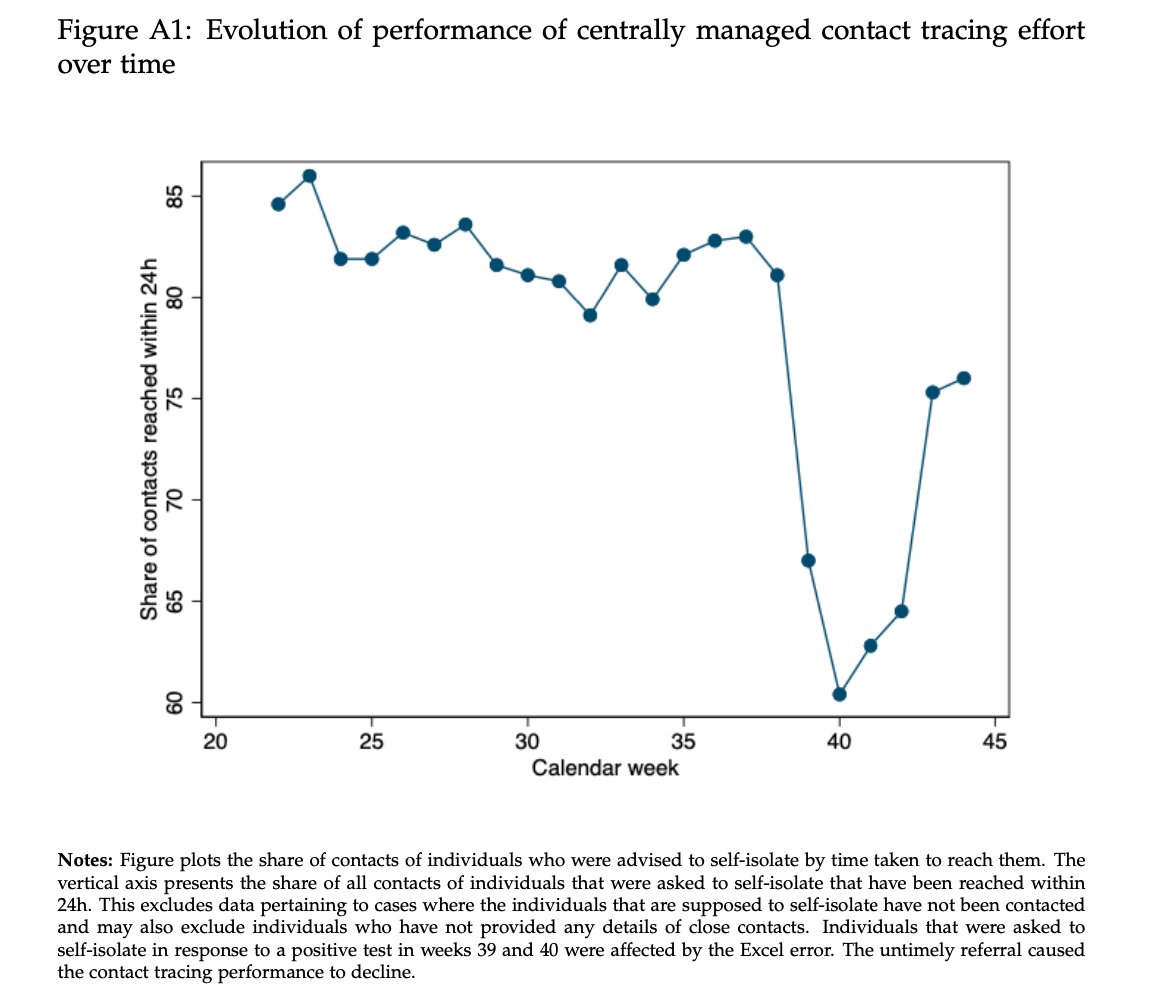
We also find some evidence that suggests that the deluge of cases to be traced from Oct 3 may have resulted in a worsening of contact tracing performance. We also find that the test positivity rate and testing appears to increase -- which is not surprising. 10/N
These results are v robust to: a matching refinement zooming in on districts that have very similar pandemic situation (positive test rate, number of tests, number of infections) prior to glitch; its not sensitive to any one region; measurement; functional form, placebos.... 11/N
Have a look at the paper ➡️ bit.ly/394Ebuo -- I must admit I never thought I am able to study a public intervention through the window of such a bizarre Excel spreadsheet error -- but there is always a first 12/N
I do hope the govt releases more useful data on #TestandTrace in a timely fashion (plus there is a FOIA to back that up). Public spending on the scheme is huge, & I personally think the govt should leverage the many world leading academics in UK when it comes to evaluating . 13/N
Also as @ben_moll @toxvaerd1 et al can confirm, EPI/Econ academics actually can & do work well together. We just have to overcome challenges with different language and toolboxes - but we share the common goal to figure out what works to suppress #COVID19 & aid the economy. ENDS
I will make sure to have a Github repo up in the coming weeks with the data & code used. Btw. I should also add @EdConwaySky did a nice explainer video on the data sources, terms, projections & who publishes what data & why some data is not public

• • •

Missing some Tweet in this thread? You can try to force a refresh
 

Keep Current with Thiemo Fetzer

Thiemo Fetzer Profile picture

Stay in touch and get notified when new unrolls are available from this author!

Read all threads

This Thread may be Removed Anytime!

PDF

Twitter may remove this content at anytime! Save it as PDF for later use!

Try unrolling a thread yourself!

how to unroll video
  1. Follow @ThreadReaderApp to mention us!

  2. From a Twitter thread mention us with a keyword "unroll"
@threadreaderapp unroll

Practice here first or read more on our help page!

More from @fetzert

30 Oct
Today I m sharing another paper on unintended consequences of a UK policy which makes me cringe at how my tax money is spent all the while debating #FreeSchoolMeals "Subsidizing the spread of COVID-19: Evidence from the UK’s #EOHO scheme". ➡️ bit.ly/3ed5Slo a thread🧵⬇️
The EOHO scheme was conceived to help the hard-hit restaurant businesses in the UK in the wake of 1st #COVID19 wave. The scheme cut the cost of meals & non-alcoholic drinks by up to 50% across tens of thousands of participating restaurants in the UK from 3 to 31 August 2020. 1...
The research leverages data from #HMRC’s own #EOHO restaurant finder app which was the go-to platform for people searching for EOHO restaurants in their neighbourhood, together with weekly data on new #COVID-19 infections measured at the granular MSOA level (5-10k residents) 2...
Read 12 tweets
16 Jul
Happy to see my new paper "Measuring the Regional Economic Costs of #Brexit: Evidence up to 2019" feature in @FinancialTimes. For interactive map ➡️ brexitcost.org, the FT article ➡️ ft.com/content/90e988…, the paper ➡️ bit.ly/2C9BOIg a short summary ⬇️ 1...
We use the synthetic control method previously used by @JohnSpringford @bornecon @MSchularick studying #Brexit-vote economic impact on the UK as a whole, just that we study regional economic output. The UK wide exercise is published in the @EJ_RES bit.ly/3j2zt2V 2...
We apply (a lot of variations) on regional quarterly GDP as well as annual district-level Gross-value added data for the UK. In total, for districts we construct a total of 100+ synthetic control estimates to assess concerns of overfitting - below plot is the case of Lewisham 3..
Read 10 tweets
8 Dec 19
I want to share a new paper. Its relevant to #GE2019. The findings are quite exemplary of the misguidedness of much of economic & social policy under the #ConservativeParty. It should be a harbinger to wary voters: there is more of the same under the Tories & with #Brexit. 1/..
The short summary: the reform to housing benefit from 2011 onwards was intended to save the public purse hundreds of millions. But quite the reverse happened: not only did it create huge amounts of misery and agony, it also ended up not saving the public much money at all. 2/..
What happened? From April 2011 onwards, local housing allowance was massively cut from covering up to the median level of rents, to only cover up to the 30th percentile of market rents. Here is a map of how this affected households in terms of expected losses per week. 3/..
Read 17 tweets
29 Nov 19
So why I think the #GE2019 is really not done yet. A short thread. The summary: I think a hung parliament is still a very likely and a desirable outcome for the UK. I first present some evidence on the former, and then my view on the desirability on the latter. #Brexit
1. Most opinion polls now point to a #Cons maj, including yesterday's @YouGov MRP. MRP is great in the tool box, but still relies on raw polling data. Here, bit.ly/2q0iSFW, I argue here that YouGov samples for BES do appear structurally different and potentially biased
2. Opinion polls are still mostly conducted at national level, ignoring constituency-level factors. My PhD student @EleAla shows that in UK, turnout tends to be systematically lower the "safer" a seat is. And this effect is increasing in the poll national lead of the incumbent..
Read 18 tweets
31 Oct 19
On my way to Berlin for the launch of @ForumNewEconomy. I ll be talking about "Why #Brexit votes happen: An evaluation of the impact of #austerity".
Unfortuantely, there is much more I would like to say... but can't within 10 minutes. So here is what's missing out...
In the run up to 2016 #EURef, the UK was actually slowly and gradually becoming more pro European if you believe 30 @EurobarometerEU studies since 2000.
The 2016 #EURef is culmination of political developments with UK's electoral system playing a crucial role. Here a short thread why & how #austerity induced voter shifts affected election dynamics, pushing Cameron into holding #Brexit referendum:
Read 8 tweets
17 Jun 19
Super thrilled to announce that "Did #Austerity cause #brexit?" has just been accepted for publication at the @AEAjournals in the American Economic Review. Short thread on whole paper available here wrap.warwick.ac.uk/106313/...
The paper traces the rapid rise of #UKIP after 2010, and the developing of anti-establishment and growing polarisation along key socio-economic divides over time.
And highlights that #austerity policies, in particular, the hollowing out of the welfare state since 2010 induced many individuals to adopt anti-establishment sentiment -- these were successfully channeled into votes for #Leave and #UKIP
Read 9 tweets

Did Thread Reader help you today?

Support us! We are indie developers!


This site is made by just two indie developers on a laptop doing marketing, support and development! Read more about the story.

Become a Premium Member ($3/month or $30/year) and get exclusive features!

Become Premium

Too expensive? Make a small donation by buying us coffee ($5) or help with server cost ($10)

Donate via Paypal Become our Patreon

Thank you for your support!

Follow Us on Twitter!