
DISCLAIMER : This is for educational purpose and not financial advise.
Monthly market analysis Sep 30, 2022
#StockMarket Worst week, worst month, and worst quarter of the year since Financial crisis and dot-com bubble. Why it happened?
Let's look at more closely 🧵👇
Monthly market analysis Sep 30, 2022
#StockMarket Worst week, worst month, and worst quarter of the year since Financial crisis and dot-com bubble. Why it happened?
Let's look at more closely 🧵👇
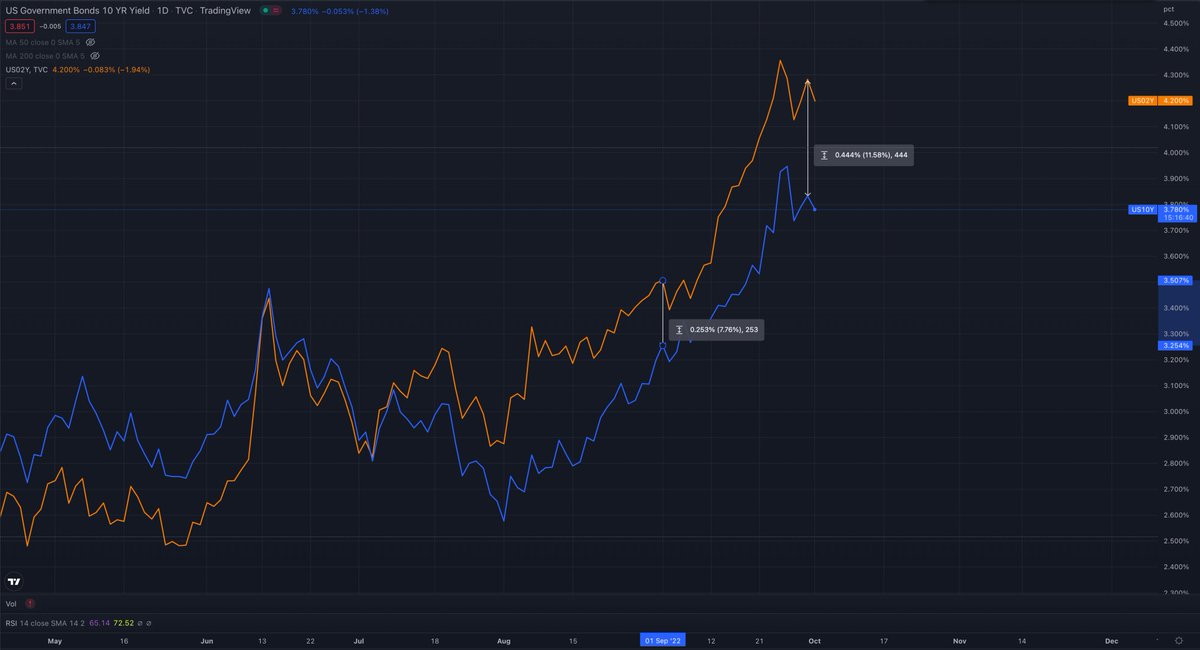
1. After making reversal at H/S neckline in early Aug, US 10Y Yield #bond broke out from Feb'11 high 3.73% and have held up strongly for about a week. This month, yield has gone up +20%, bad for risk and long duration assets
#StockMarket
#StockMarket

2. US 02Y Yield #bond broke out resistance 3.7% and past 4% strongly after Fed Reserve hawkish announcement and never look back. This month yield has gone up more than +22%
#StockMarket
#StockMarket

3. Inverted yield curve between US 10Y Yield(blue) - 02Y Yield #bond (orange) is getting wider by the end of Sep. It's gone up from 0.25% to 0.44% this month alone.
#StockMarket
#StockMarket
4. The speed and rate of change GB 10Y #gilt gone up in Sep (+46%) was unprecedented. At one point, it broke above Feb'99 bottom and blew off top 4.6% until @bankofengland #BOE had to interfere before pension fund margin call.
#StockMarket
#StockMarket

5. The spread between #Italy 10Y Yield(blue) and German #bund (orange) getting wider at the end of Sep compare to beginning of 2022 and the pandemic low of Mar'20
#StockMarket
#StockMarket

6. Similarly the spread between #France 10Y Yield (blue) and German #bund (orange) also getting wider at the end of Sep compare to beginning of 2022 and pandemic low Mar'20
#StockMarket
#StockMarket

7. Coming back to US @iShares Corporate High Yield #Bond #ETF $HYG made new low at the end of Sep and broke down below Jun'22 low. It's down 4% this month alone. At the intraday low last week, it was almost down 5% in Sep
#StockMarket
#StockMarket

8. Similarly US SPDR High Yield Junk #Bond $JNK also made new low at the end of Sep and broke below Jun'22 low. It's down 4% in Sep and it's down 4.6% intraday low in the last week of Sep
#StockMarket
#StockMarket

9. To put things in context, the number of >28K #Bond, 56 Trillion of Asset value, 2022 YTD has lost 20%.
#StockMarket
#StockMarket
https://twitter.com/biancoresearch/status/1576554701692162049?s=20&t=iZb3OsxLEhJ2oCGWf4IV0w
10. Now looking at $DXY ( #USD Index) it had made all times high in Sep since 2002. It's up 2.3% in Sep. At one point, it was up to 115 level (almost 5%) intraday high last week before huge reversal
#StockMarket
#StockMarket

11. #EURUSD made new low at the end of Sep and down 2.5% this month. At intraday low last week, it broke down below June 1989 low of 0.95
#StockMarket
#StockMarket

12. #GBPUSD made new low at the end of Sep and down more than 4%. At intraday low last week, it broke below Feb 1985 low and down 11% before @bankofengland #BOE interfered
#StockMarket
#StockMarket

13. #USDJPY made all times high since 1998 by the end of Sep and up more than 4% this month. Japanese #Yen is considered safe-haven, but US Fed Reserve has "out-hawked" the market expectation
#StockMarket
#StockMarket

14. $VIX ( $SPX Fear Index) was very volatile at the last week of Sep and ended up 22% this month. Intraday high from last week of Sep was up almost 35% before huge reversal.
#StockMarket
#StockMarket

15. NYSE Advance/Decline Daily Chart shows the last week of Sep made low several times but it did not broke below Jun'22 low
#StockMarket
#StockMarket

16. #AAII Bear Sentiment Idx Weekly Chart shows all times high in Sep month and broke above Apr and Jun'22 high in 1 year. >60% participants were bearish.
#StockMarket
#StockMarket

17. #AAII Bull Sentiment Idx Weekly Chart shows lower than Jun'22 bottom with < 18% participants were bullish in Sep month
#StockMarket
#StockMarket

18. NYSE percent stocks > 200MA was the lowest since Jun'22 bottom but it did not break below Jun low of this year. Only 15% of stocks were > 200MA which was very oversold.
#StockMarket
#StockMarket

19. $SPX Put/Call ratio was the highest (1.71) on Sep 21th and 2nd highest (1.69) on Sep 27 since Jun 16 high during market bottom of Jun'22.
#StockMarket
#StockMarket

20. The monthly survey of manufacturers in NY State conducted by Fed Reserve NY shows contraction.
NOTE: This survey was conducted a month ago so data is lagging indicator and it could be even slower
(Source: newyorkfed.org)
#StockMarket
NOTE: This survey was conducted a month ago so data is lagging indicator and it could be even slower
(Source: newyorkfed.org)
#StockMarket

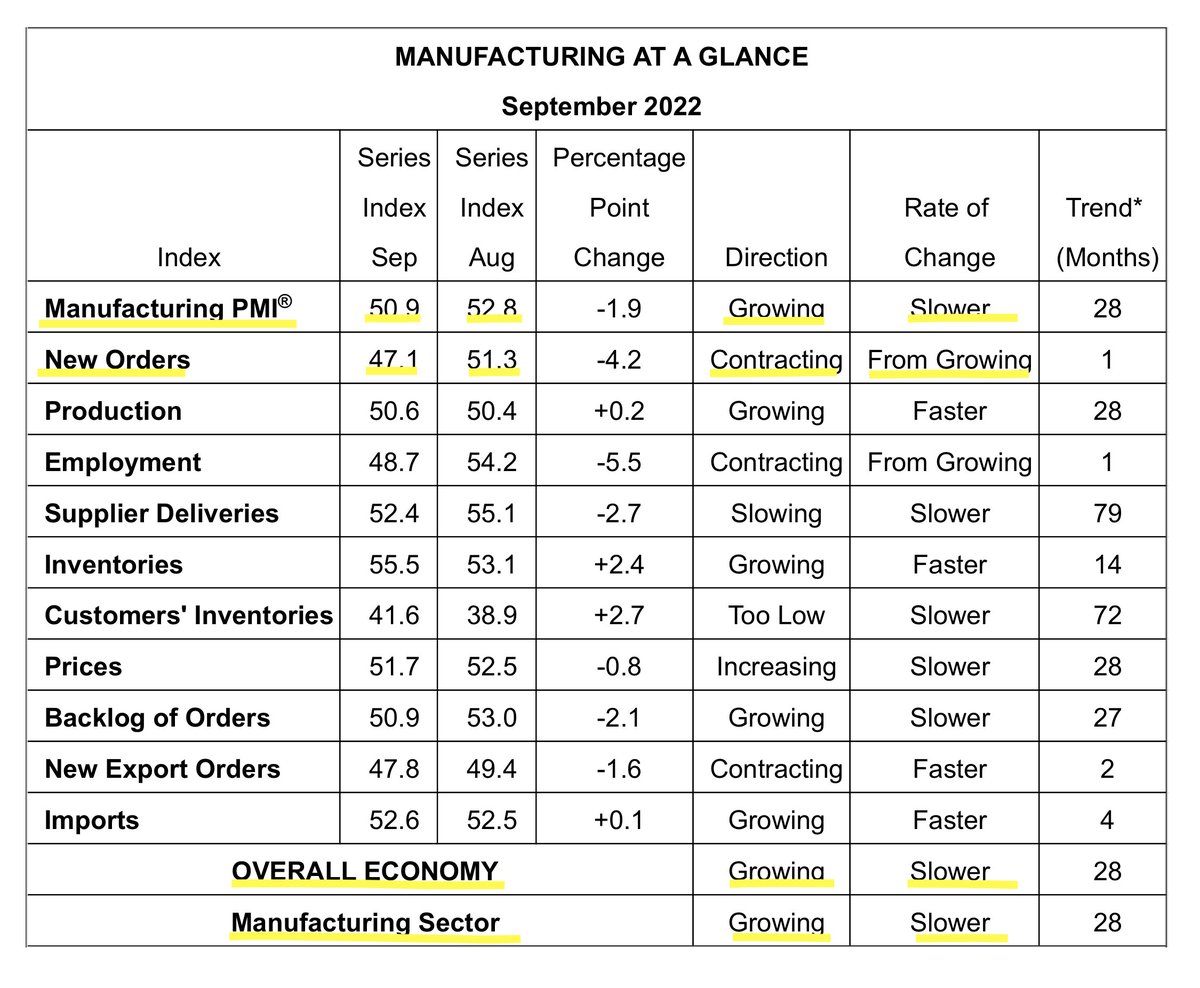
21. US #ISM Manufacturing report for Sep 2022 shows contraction and almost below 50 key level. Overall economy still growing albeit slower which means Fed Reserve will continue hiking rate until growth keeps getting slower and unemployment rate going up.
#StockMarket
#StockMarket
22. US Small Business Optimism Index keeps trending lower and expecting lower number for Sep 2022 month too.
NOTE: This is lagging data from Aug 2022.
(Source: nfib-sbet.org)
#StockMarket
NOTE: This is lagging data from Aug 2022.
(Source: nfib-sbet.org)
#StockMarket

23. US #ISM Non-Manufacturing report for Aug 2022 still shows growing at faster pace. Report for Sep 2022 is yet to be released. It is expected to show slowing growth, but how slow would be a good indicator
(Source: prnewswire.com)
#StockMarket
(Source: prnewswire.com)
#StockMarket

24. US Industrial Production: Manufacturing: Durable Goods: Motor Vehicles and Parts (NAICS = 3361-3) yet to show a slowdown. Currently its near its peak based on last month data. New report is yet to be released
NOTE: This is lagging Aug'22 data from Sep 15,2022
#StockMarket
NOTE: This is lagging Aug'22 data from Sep 15,2022
#StockMarket

25. US Unemployment Rate still shows almost near the low 3.7% based on last month data. New #JOLTS report is yet to be released.
NOTE: This is lagging Aug'22 data from Sep 2, 2022
#StockMarket
NOTE: This is lagging Aug'22 data from Sep 2, 2022
#StockMarket

26. US Gross Domestic Product (#GDP) is trending down at the end of Q2 2022.
NOTE: This report as of Sep 29,2022
#StockMarket
NOTE: This report as of Sep 29,2022
#StockMarket

27. US Real #GDP (Inflation Adjusted) already shows negative growth at the end of Q2 2022.
NOTE: This report as of Sep 29,2022
#StockMarket
NOTE: This report as of Sep 29,2022
#StockMarket

28. US M2 Money Supply has grown tremendously since 80-ish and grown exponentially when Fed Reserve rescue during pandemic 2020.
#StockMarket
#StockMarket

29. $SPX 500 Sector Chart YTD. The best sector is Energy (+30.71%) and the worst sector is Communication Services (-39.43%).
Overall SPX return YTD is -24.77%
(Source: Fidelity)
#StockMarket
Overall SPX return YTD is -24.77%
(Source: Fidelity)
#StockMarket

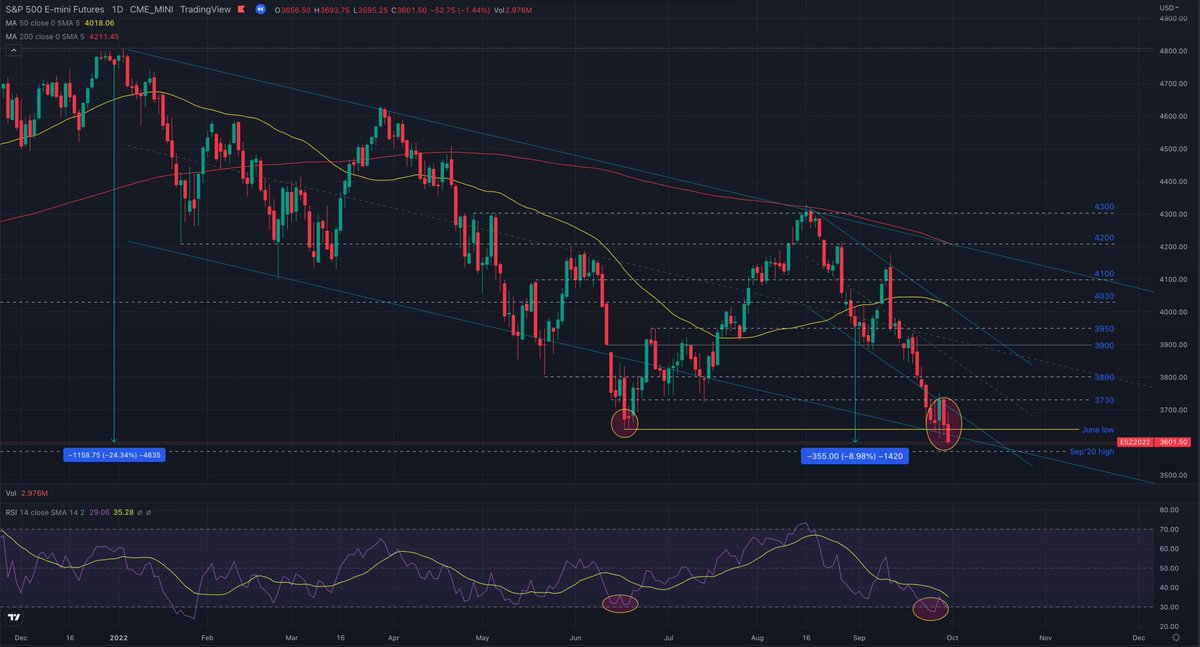
30. /ES ( $SPX Future) tried to rally last week of Sep, but failed at 3730 resistance. It broke Jun'22 low and ended the month at the new low (-9%). RSI was very oversold. It's down more than 24% YTD
#StockMarket
#StockMarket
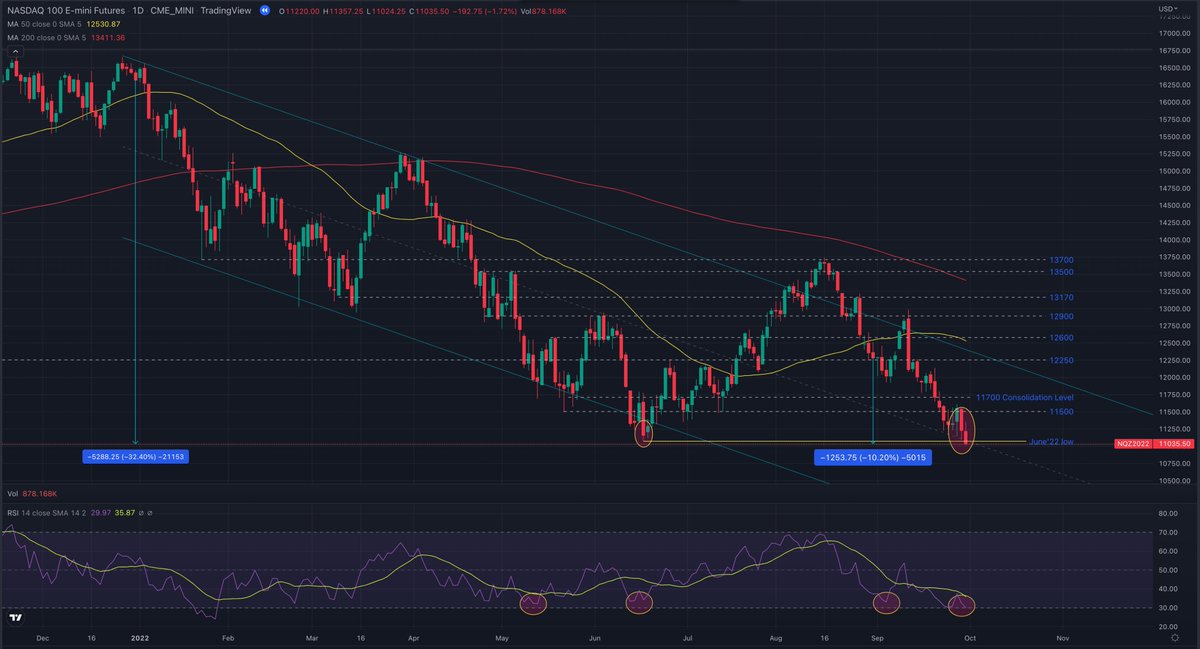
31. /NQ ( $NDX Future) also tried to rally last week of Sep and failed at 11.5K resistance level. It finally broke Jun'22 low and ended the month at new low (> -10%). RSI was oversold. It's down more than 32% YTD
#StockMarket
#StockMarket
32. /GC ( #Gold Future) hit new low last week of Sep and able to rebound from the bottom. It's down about 3% and down 5.6% at intraday low in Sep. It's rebound after RSI was oversold. It's down more than 9% YTD
#StockMarket
#StockMarket

33. /CL ( #oil Future) hit new low last week of Sep and able to rebound from July'21 high support level after RSI hit oversold level. It's down more than 10% and down almost 14% at intraday low in Sep. At the intraday low, It's almost wipe out the whole gain of 2022
#StockMarket
#StockMarket

34. @vaneck_us Semiconductor #ETF $SMH made new low on last week of Sep and broke below Jun'22 low. It's down almost 14% in Sep month and it's been down 40% YTD
#StockMarket
#StockMarket

35. Another staggering chart is, comparing @iShares MSCI Emerging Index #ETF $EEM since Jan 2020 with $DXY ( #USD Index). The peak of $EEM was early 2021 #USD almost at the low. Once USD keeps rising, emerging stock keeps falling. It's down 29% YTD
#StockMarket
#StockMarket

36. Looking at $BTC, it's outperformed the market for Sep month (-3%). It made new low in the 3rd week of Sep, but able to defend 18.6K level and did not breach June low. RSI was neutral and approaching 50MA(yellow). It could go either way now.
#cryptomarket #Bitcoin #BTC
#cryptomarket #Bitcoin #BTC

37. $ETH is much worse performance compared to $BTC in Sep (> -14%). It made new low in 3rd week of Sep but it was able to defend this support 1275 level and bounced back. It performance got worse after #EthereumMerge major milestone. It's down 64% YTD
#cryptomarket #Ethereum
#cryptomarket #Ethereum

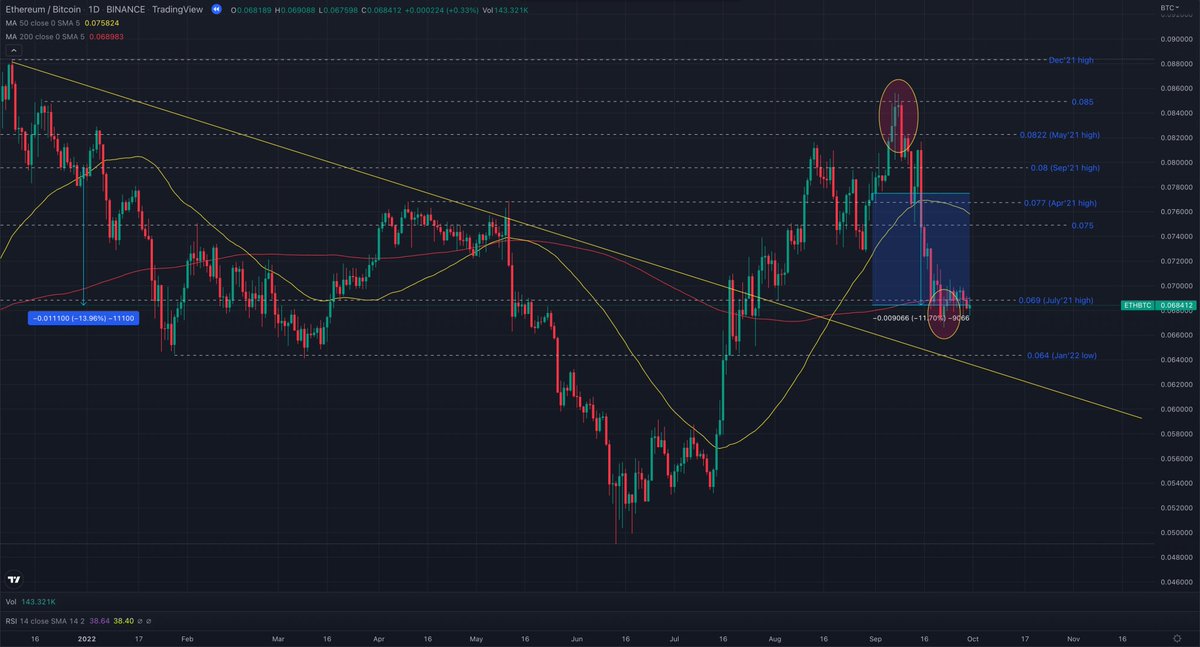
38. Looking at ETH/BTC ratio, it made new high early Sep during anticipation of #EthereumMerge, but it fell down at the end of Sep (-11.7%). The ratio did not reach June'22 low. it's down 14% YTD
#cryptomarket #Ethereum #Bitcoin
#cryptomarket #Ethereum #Bitcoin
39. Comparing one year chart of $BTC $ETH $DXY ( #USD Index) and US 10Y Yield #Bond.
US 10Y #Bond is the worst performance as yield (+157%) is inverse relation with its price. $DXY is the best performance +19% up to Sep
#cryptomarket #StockMarket #Ethereum #Bitcoin
US 10Y #Bond is the worst performance as yield (+157%) is inverse relation with its price. $DXY is the best performance +19% up to Sep
#cryptomarket #StockMarket #Ethereum #Bitcoin

40. Comparing one year chart of $BTC $ETH $SPX Future and $NDX Future. $ETH and $BTC is the worst performance up to end of Sep -56%. $SPX Future is best performance up to end of Sep -16%; even though it is negative
#StockMarket #cryptomarket #Ethereum #Bitcoin
#StockMarket #cryptomarket #Ethereum #Bitcoin

41. Summary:
1. #StockMarket was very oversold in Sep especially the last week of the month.
2. Most global macro indicators were also very oversold and one-sided especially with $DXY and #Bond capitulation during last week of Sep
...
1. #StockMarket was very oversold in Sep especially the last week of the month.
2. Most global macro indicators were also very oversold and one-sided especially with $DXY and #Bond capitulation during last week of Sep
...
3. Economy indicators were starting to show slow down, but not contraction yet. In order for Fed Reserve to slow down or pause QT, economy data have to keep getting worse or show contraction especially #CPI, #ISM, and #Unemployment Rate.
4. #StockMarket and #cryptomarket have been getting used to quantitative easing since '08. As Fed Reserve sells #Bond monthly and tighten #MonetaryPolicy, our chance of V-recovery is very unlikely
5. Bad news are good news for #StockMarket now; to give a chance for Fed Reserve to pivot or at least pause raising rate. But if we were going into hard landing #recession, then rally would be short term after the initial knee jerk reaction
6. As long as US 10Y / 02Y Yield #Bond and $DXY keep stubbornly higher, then risk asset (e.g. #cryptomarket , tech) and long duration asset would be underperformed including international big large cap companies
7. It is normal to have 10% or more #StockMarket rally during bear market. As long as it's making lower high and lower low, we have not reached an absolute bottom
8. Bottoming is a process. it could takes months or year before an absolute bottom due to tight money supply
8. Bottoming is a process. it could takes months or year before an absolute bottom due to tight money supply
9. Trade carefully and pay attention to every important resistance and support levels. Always pay attention to #USD and US 10Y / 02Y Yield for #StockMarket direction
10. Be mindful. “Markets can stay irrational longer than you can stay solvent." Cheers.
10. Be mindful. “Markets can stay irrational longer than you can stay solvent." Cheers.
@threadreaderapp unroll
• • •
Missing some Tweet in this thread? You can try to
force a refresh


