, 28 tweets, 5 min read Read on Twitter
Latest Census data on inequality and poverty were just released. Tweetstorm coming...
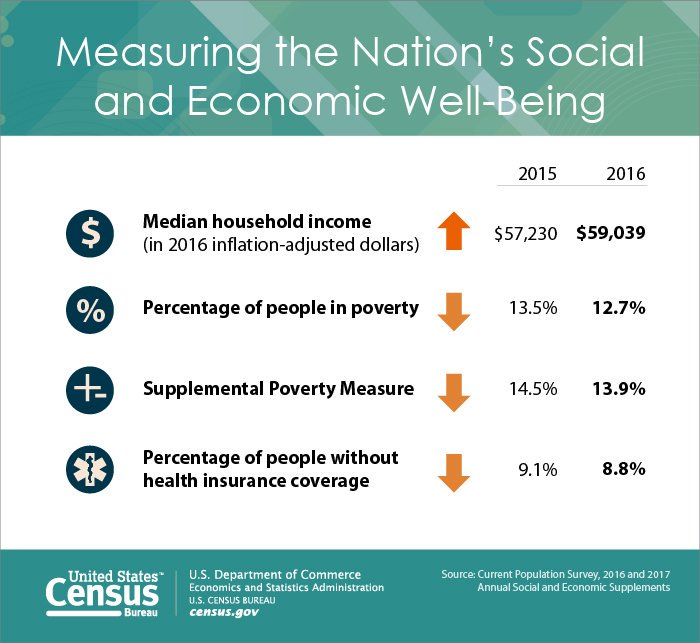
It looks like 2016 was a good year. Real median household income (yes, this adjusts for inflation) rose +3.2% to $59,039.
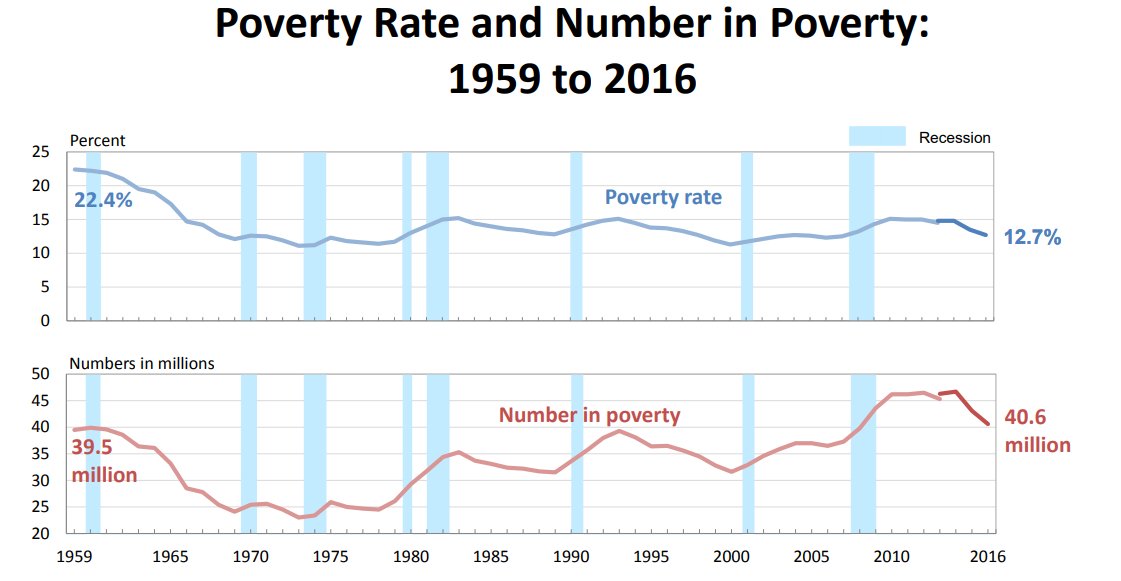
Poverty took a healthy step down in 2016. It fell from 13.5% to 12.7% on the official measure; from 14.5% to 13.9% on the supplemental.
Share of people without health insurance fell from 9.1% to 8.8%.
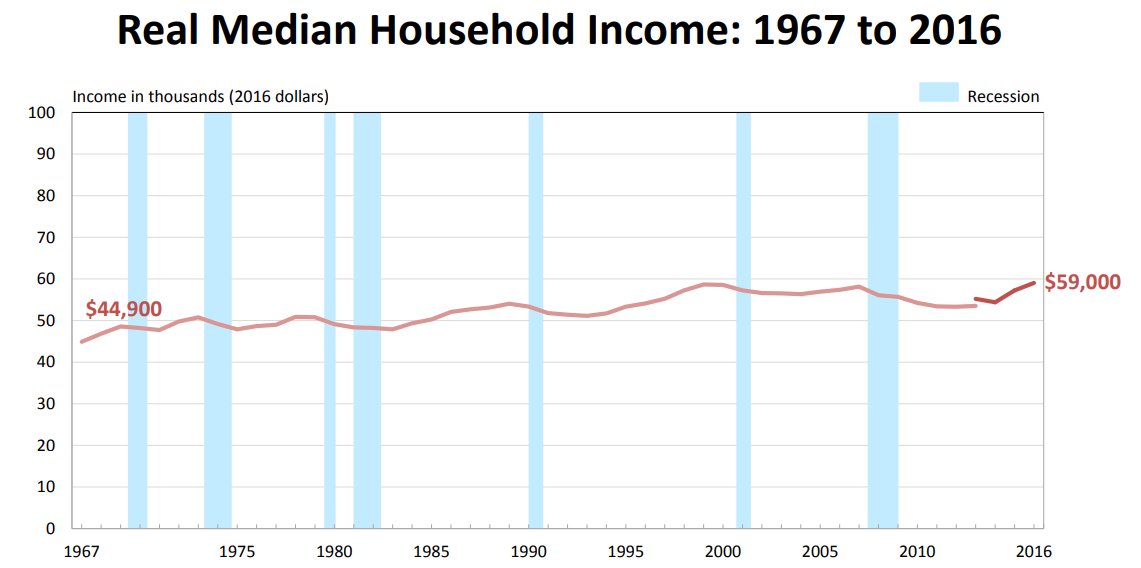
Here's the graph showing that middle class incomes really started to grow strongly in the late Obama years.
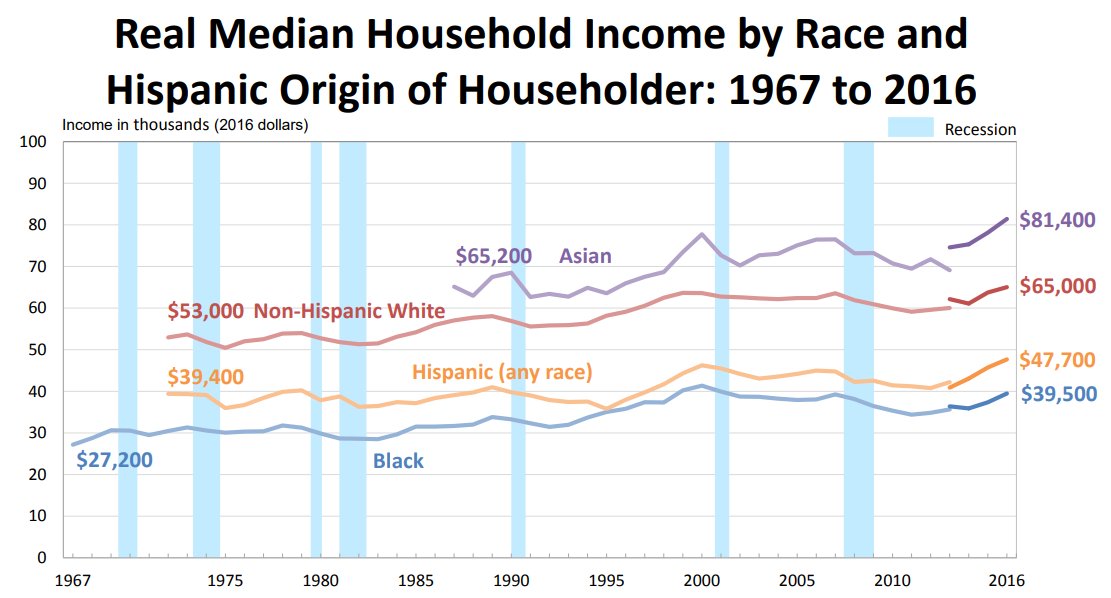
Those income gains were felt across demographic groups.
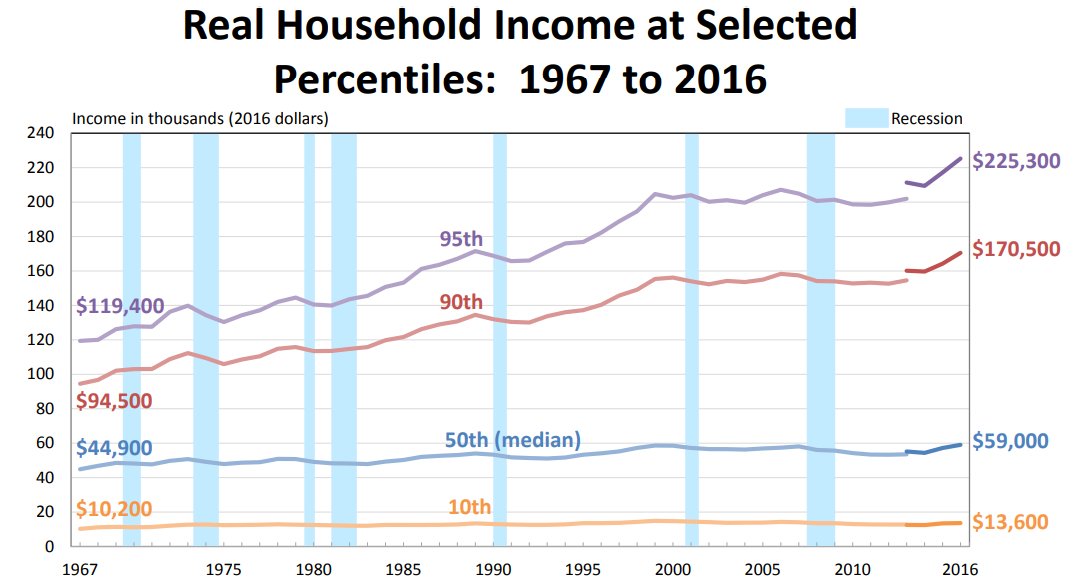
While middle class incomes grew, it really has been a great few years for the rich.
Real income growth from 2008 to 2016:
10th percentile (ie the poor): +0.4%
Median: +5.3%
90th percentile: +10.6%
Zooming in on the change in real incomes over the past year:
10th percentile: +1.3%
Median: +3.2%
90th percentile: +3.8%
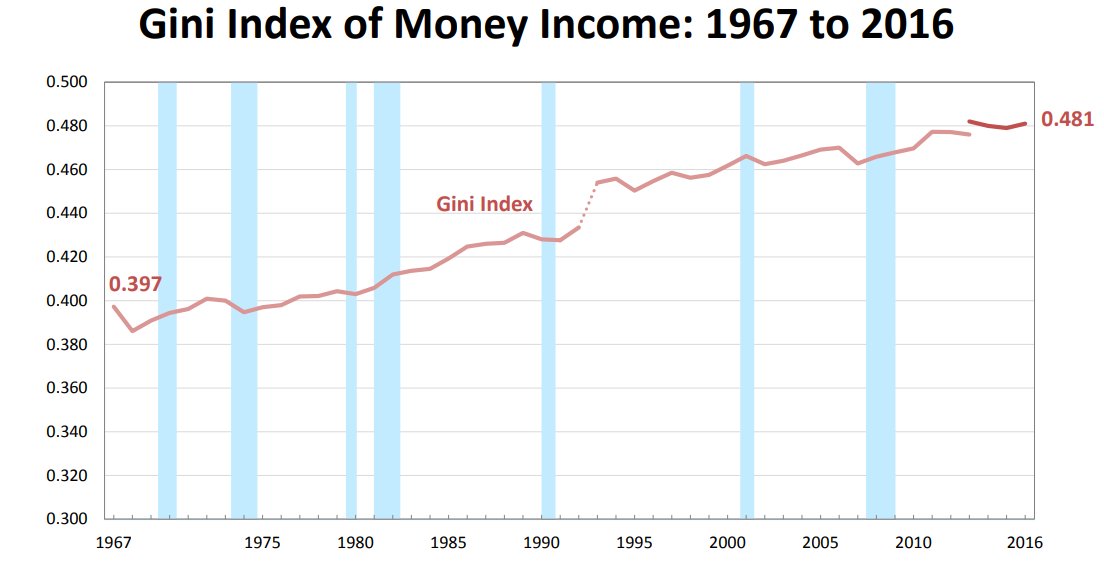
The Gini index summarizes inequality.
Pessimists reading: It just keeps rising over time!
Optimist: It barely moved over the past few years.
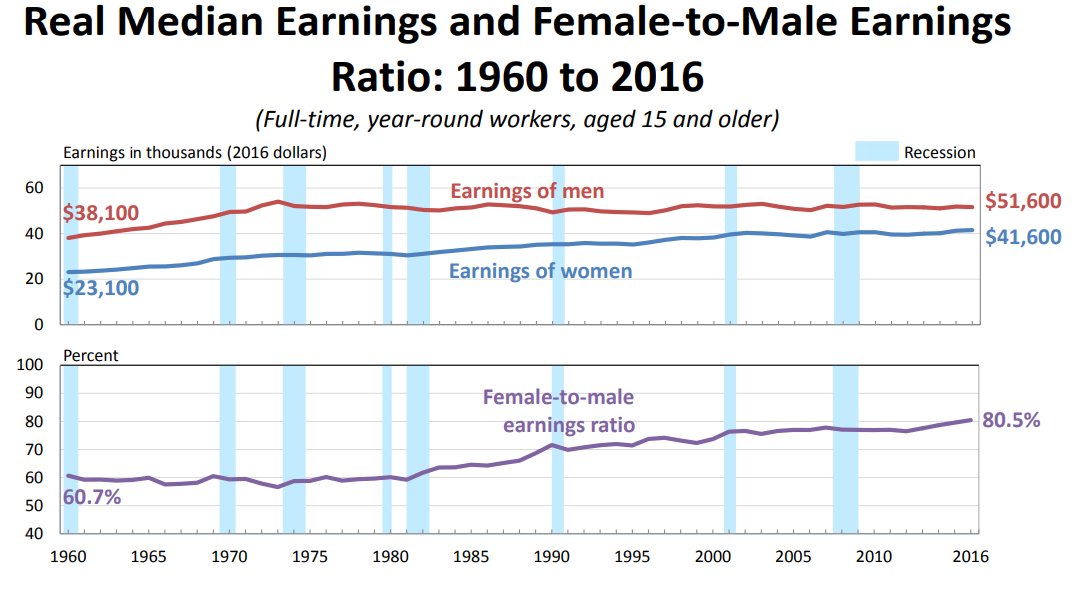
Women's earnings are slowly catching up to men's. Today the median woman (who works full-time) earns four-fifths that of the median man.
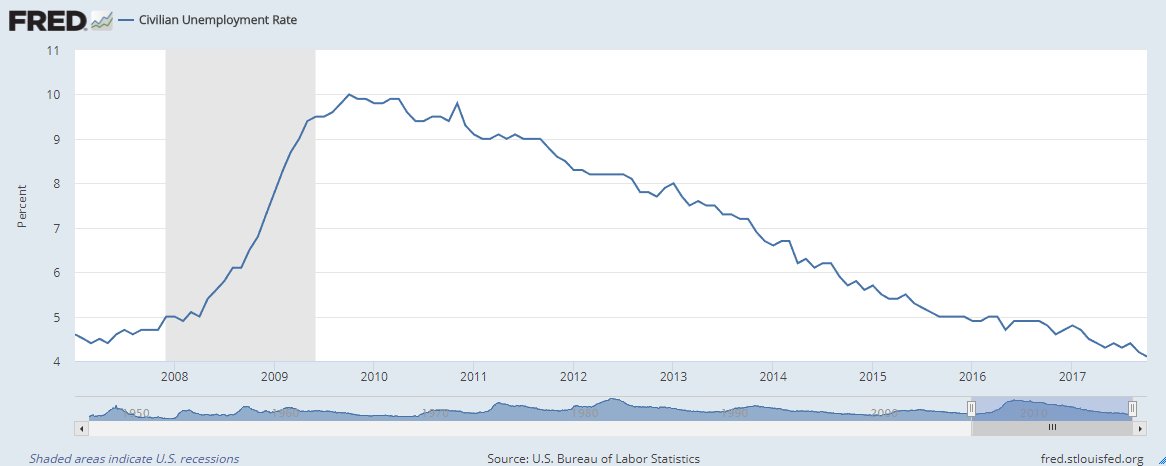
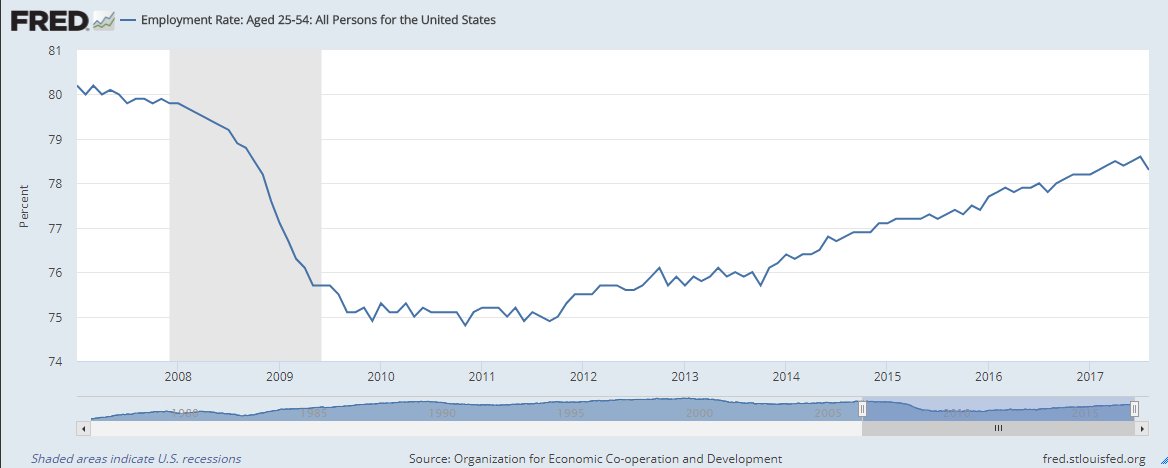
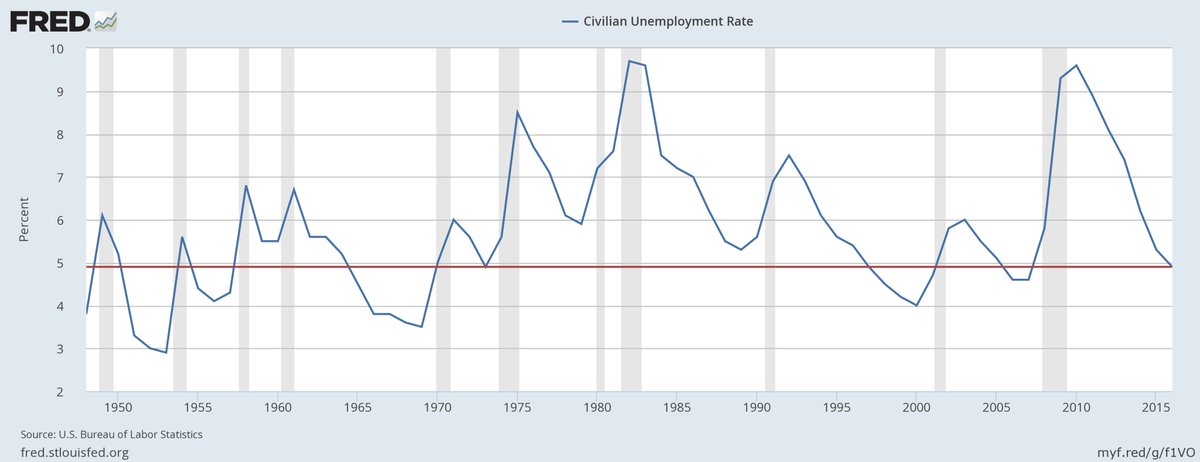
There's no missing the substantial decline in poverty. A declining unemployment rate is the greatest anti-poverty program we know.
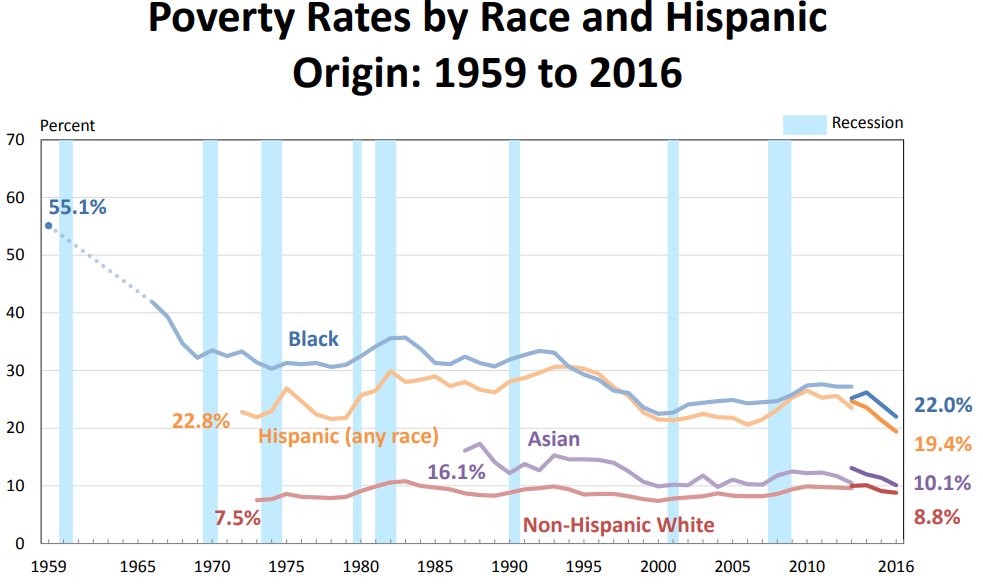
The poverty rate has fallen particularly dramatically for African-Americans.
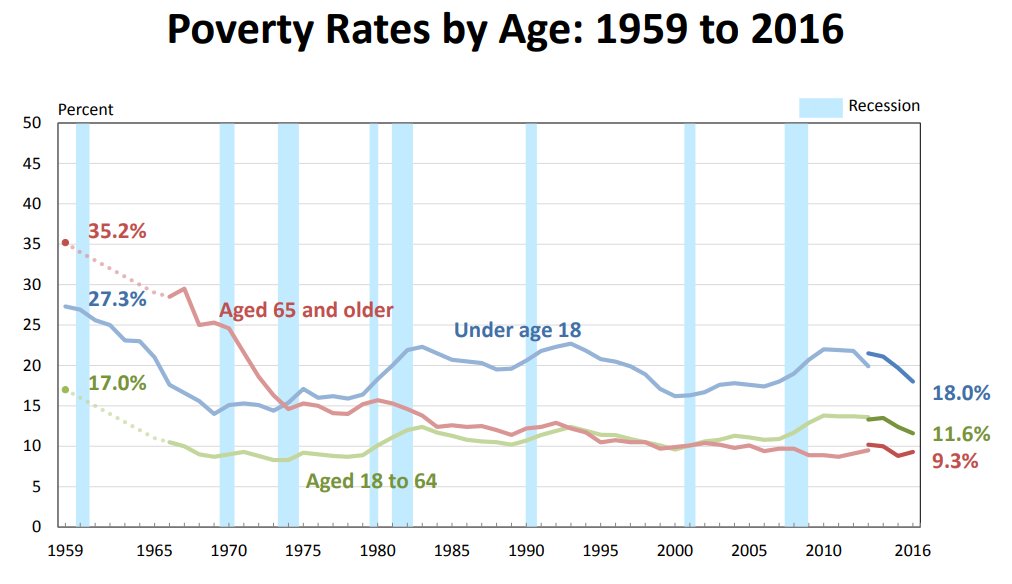
A little surprising to see elderly poverty rate up. Could be a blip, but it bears watching.
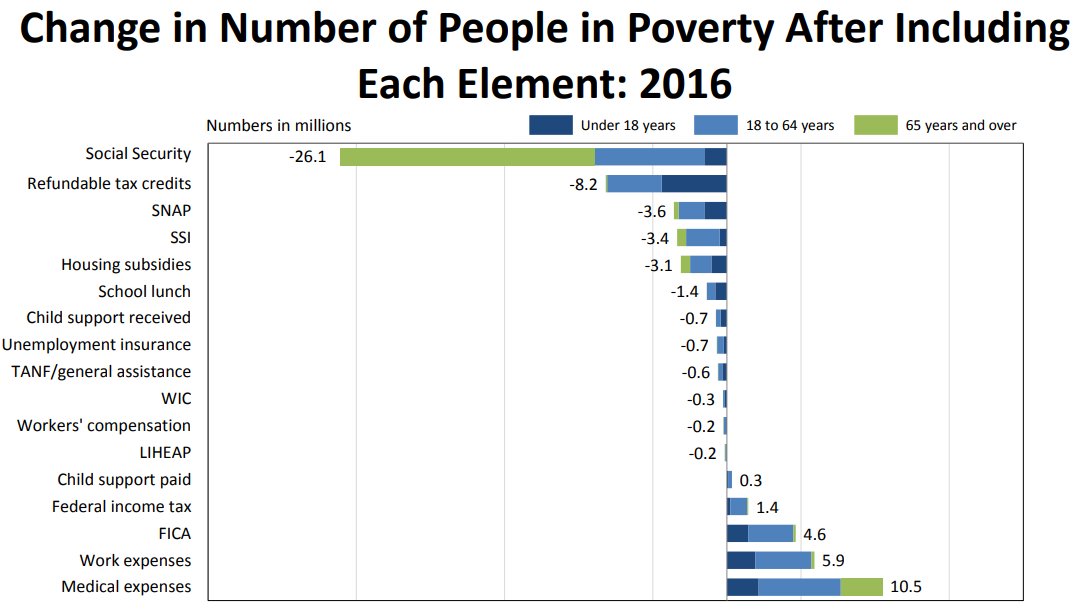
Lemme make an obvious point: What keeps the poverty rate down? The social safety net.
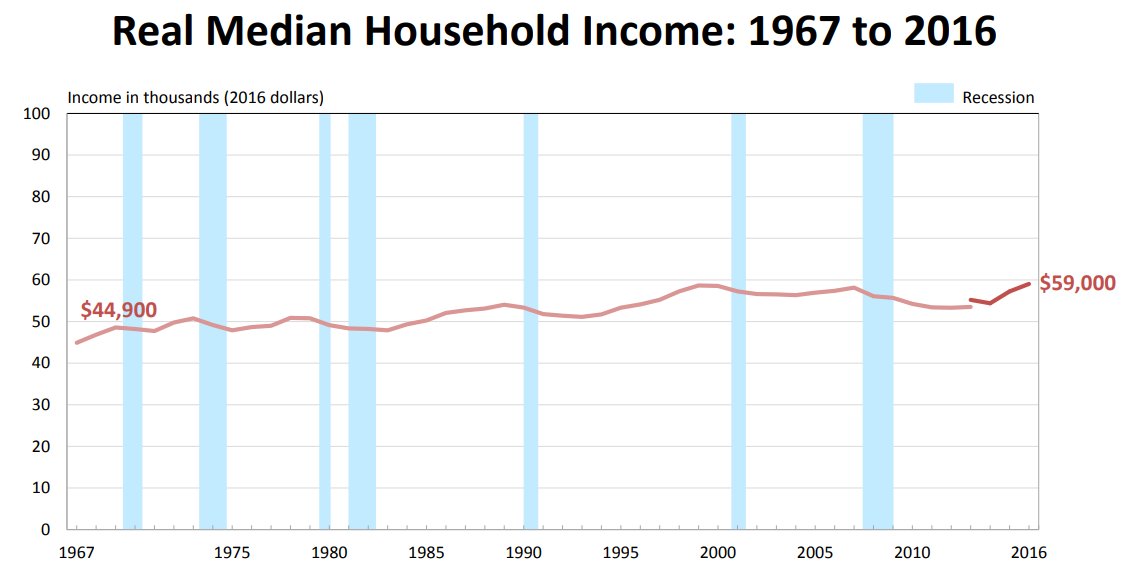
The most amazing fact remains that Real Median Household income in 2016 ($59,039) is barely above that in 1999 ($58,544).
Point is, for the American middle class, it hasn't just been a lost decade. It's pretty much a lost two decades. An urgent economic crisis.
Household income shares:
- Poorest fifth: 3.1%
- 2nd quintile: 8.3%
- Middle quintile: 14.2%
- 4th quintile: 22.9%
- Richest fifth: 51.5%
Shorter version: The richest fifth of households enjoy more than half the income.
And the richest twentieth enjoy nearly a quarter of income
Share of households with income >$200,000:
1967 (initial data): 1.0%
1976: 1.3%
1986: 2.7%
1996: 3.7%
2006: 5.4%
2016: 7.0%
As you think about the income distribution, realize there are *roughly* as many households getting by on <$35,000 as enjoying >$100,000.
Comparing income from 2006 to 2016
10th percentile: $14285 -> $13608 (a decline!)
Median: $57,379 -> $59,039
90th percentile: $158k -> $171k
Income change over the past decade:
Poorest fifth -$571
2nd quintile +$248
Middle fifth +1744
4th quintile +$4315
Richest fifth +$13749
Finally, a few tips for journos covering today's income and poverty data...
Census emphasizes that annual change are rarely statistically significant. But many insignificant rises often add up to a significant trend.
It's true that many year-to-year changes are noise, so it is worth focusing on longer trends.
If you want to make a comparison that adjusts for the state of the business cycle, it's not a bad idea to compare 2016 to 2006 or even 1996.
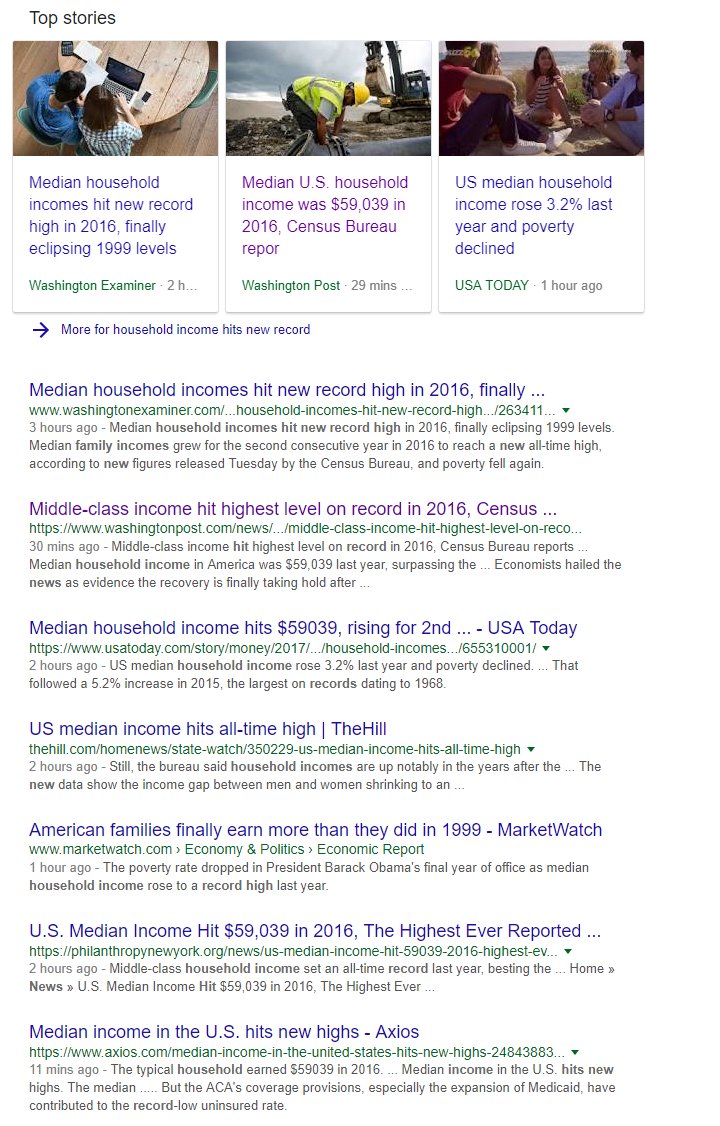
"Household Incomes Hit New Record" is a strange framing, given that through most of U.S. history, they hit a new record nearly every year.
Missing some Tweet in this thread?
You can try to force a refresh.

Like this thread? Get email updates or save it to PDF!

Subscribe to Justin Wolfers
Profile picture

Get real-time email alerts when new unrolls are available from this author!

This content may be removed anytime!

Twitter may remove this content at anytime, convert it as a PDF, save and print for later use!

Try unrolling a thread yourself!

how to unroll video

1) Follow Thread Reader App on Twitter so you can easily mention us!

2) Go to a Twitter thread (series of Tweets by the same owner) and mention us with a keyword "unroll" @threadreaderapp unroll

You can practice here first or read more on our help page!

Did Thread Reader help you today?

Support us! We are indie developers!


This site is made by just three indie developers on a laptop doing marketing, support and development! Read more about the story.

Become a Premium Member and get exclusive features!

Premium member ($3.00/month or $30.00/year)

Too expensive? Make a small donation by buying us coffee ($5) or help with server cost ($10)

Donate via Paypal Become our Patreon

Thank you for your support!