Profile picture
James Jesus Angleton @JamesAngleton75
, 3 tweets, 1 min read Read on Twitter
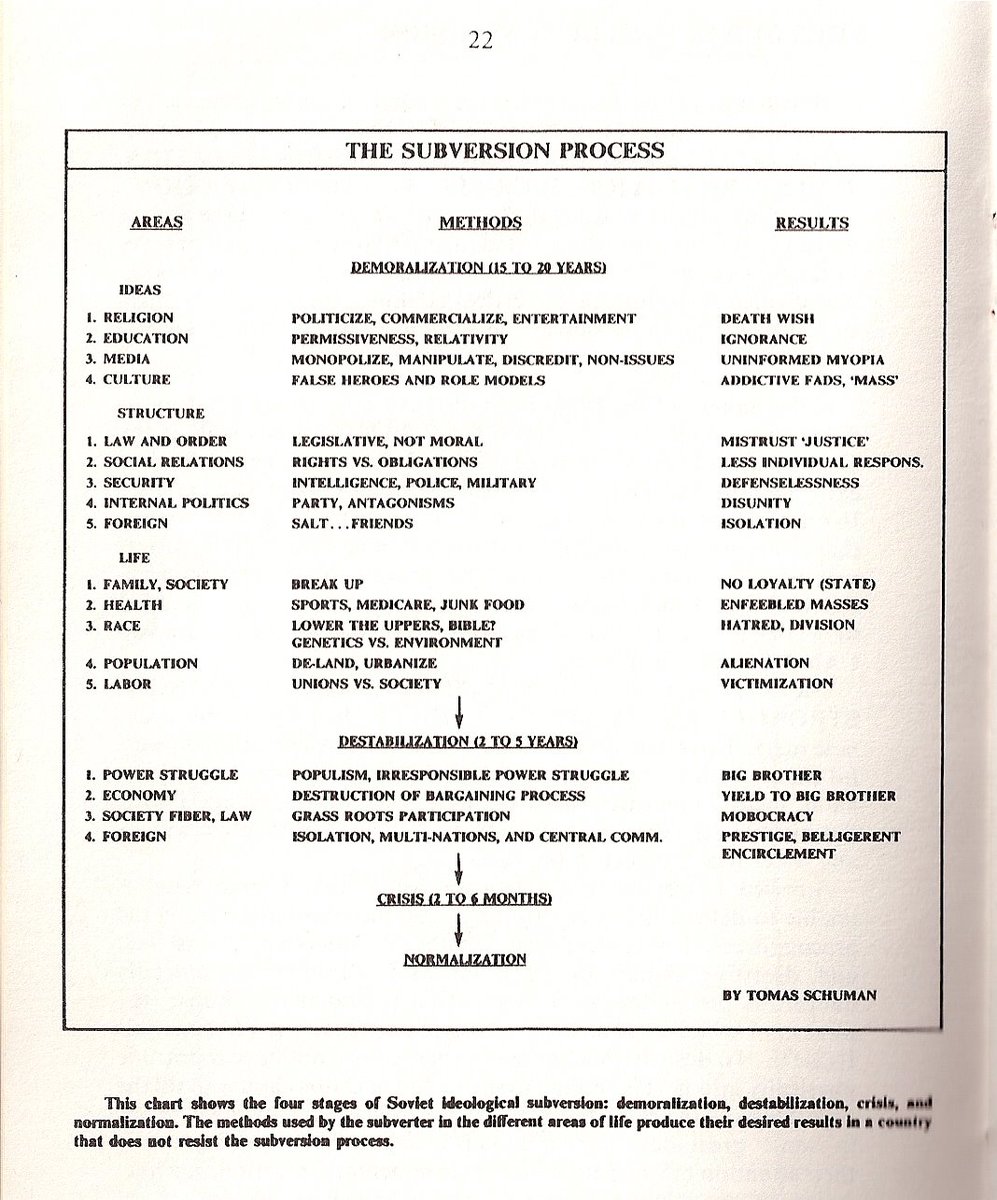
Here is the chart of how the subversion process works as it was in 1970. Since things change over time, there have been slight variances in how this played out over time, particularly in the original timeframe projection.
Here is a more recent chart that myself and several colleagues worked on and finished in Feb 2004.
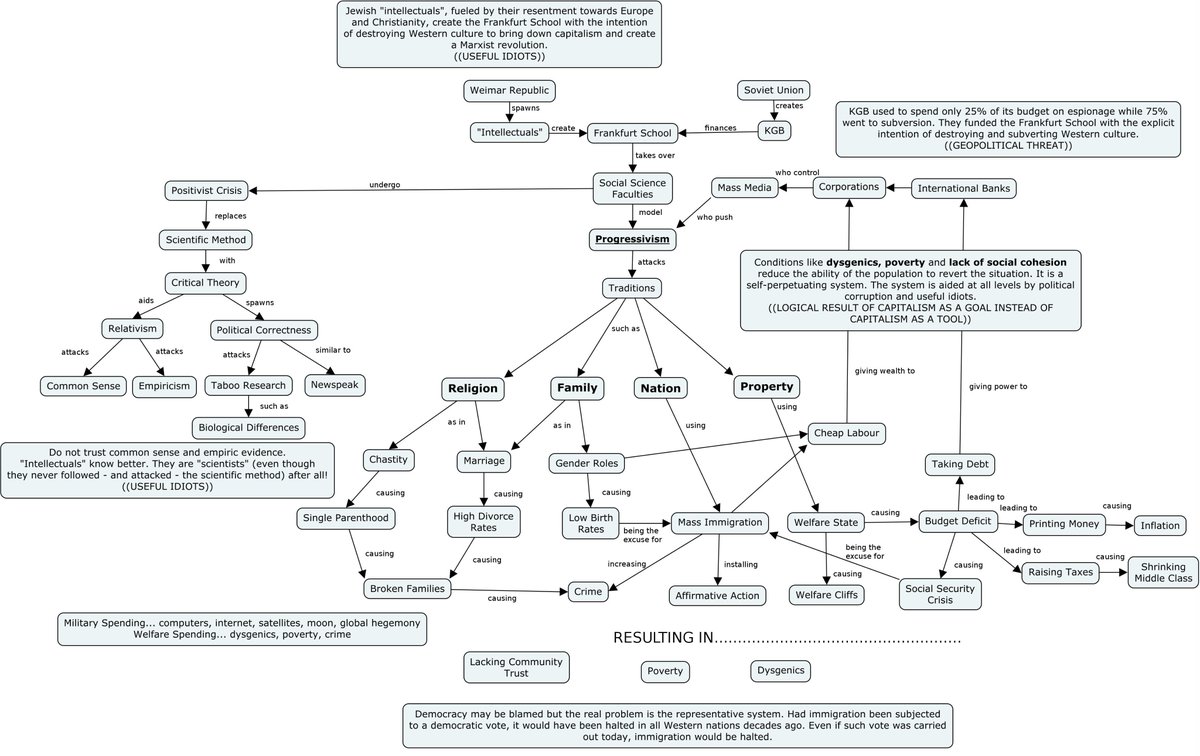
Note, my flowchart generation skills have improved markedly since then. After the election season is over, I should have time to sit down and make another updated version more current as a lot has happened since 04.
Missing some Tweet in this thread?
You can try to force a refresh.

Like this thread? Get email updates or save it to PDF!

Subscribe to James Jesus Angleton
Profile picture

Get real-time email alerts when new unrolls are available from this author!

This content may be removed anytime!

Twitter may remove this content at anytime, convert it as a PDF, save and print for later use!

Try unrolling a thread yourself!

how to unroll video

1) Follow Thread Reader App on Twitter so you can easily mention us!

2) Go to a Twitter thread (series of Tweets by the same owner) and mention us with a keyword "unroll" @threadreaderapp unroll

You can practice here first or read more on our help page!

Did Thread Reader help you today?

Support us! We are indie developers!


This site is made by just three indie developers on a laptop doing marketing, support and development! Read more about the story.

Become a Premium Member and get exclusive features!

Premium member ($3.00/month or $30.00/year)

Too expensive? Make a small donation by buying us coffee ($5) or help with server cost ($10)

Donate via Paypal Become our Patreon

Thank you for your support!