Profile picture
Dan Quintana @dsquintana
, 20 tweets, 7 min read Read on Twitter
Funnel plots are often used to assess publication bias in meta-analysis, but these plots only visualise *small study* bias, which may or may not include publication bias. Here's a guide on making contour-enhanced funnel plots in #Rstats, which better visualise publication bias
First, some background.... Publication bias is a well-known source of bias. For instance, researchers might shelve studies that aren’t statistically significant, as journals are unfortunately less likely to publish these kind of results.
Researchers might also use questionable research practices — also known as p-hacking — to nudge an effect across the line to statistical significance
Two interrelated approaches are typically used to assess the risk of publication bias in meta-analysis. First, the risk of publication bias is often visualised by constructing a funnel plot, which visualizes a measure of effect size against a measure variance
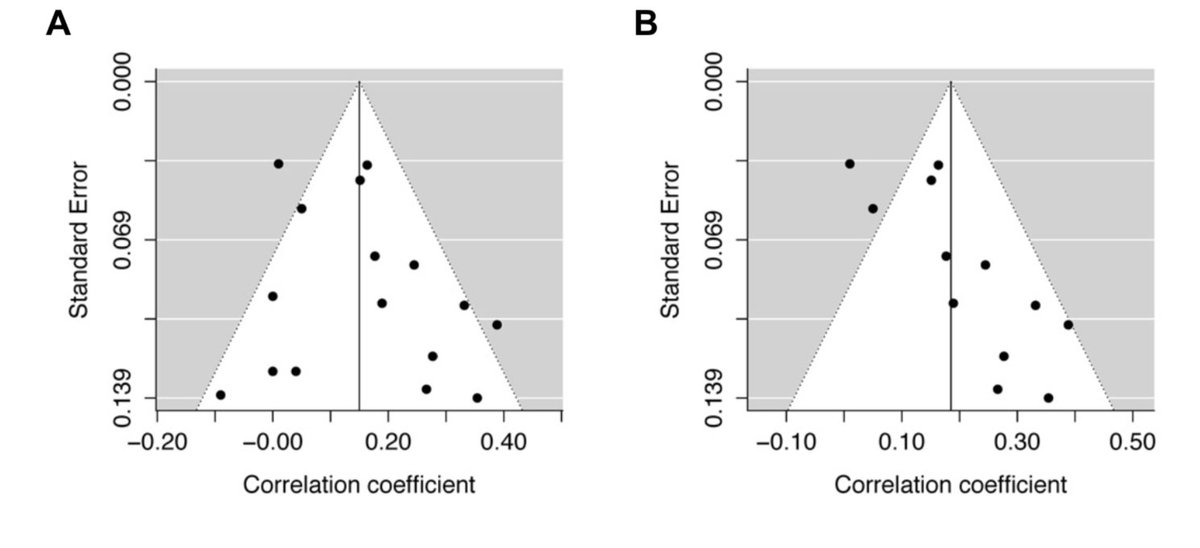
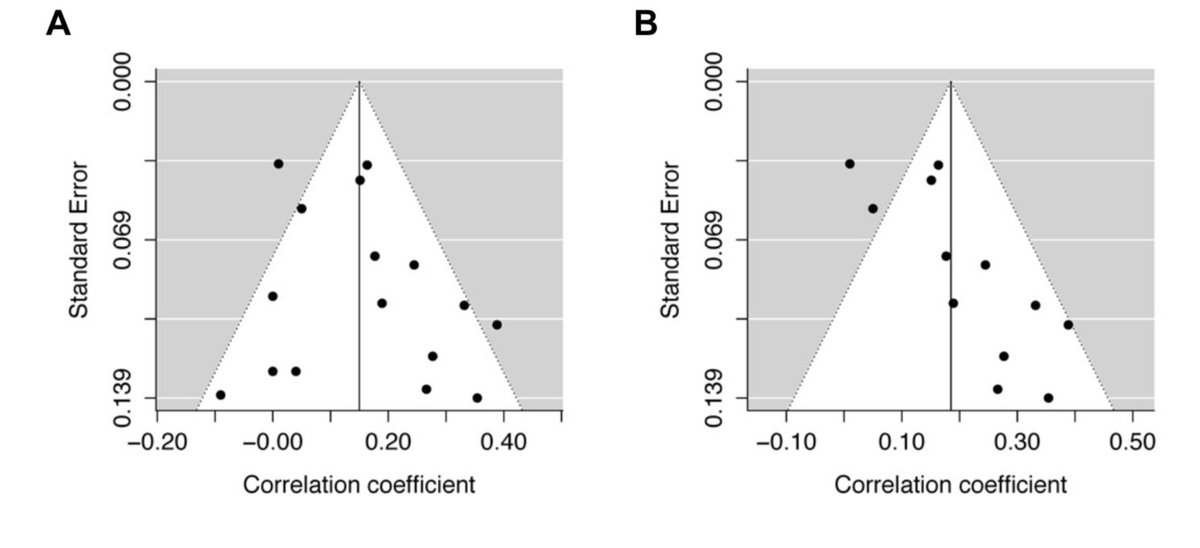
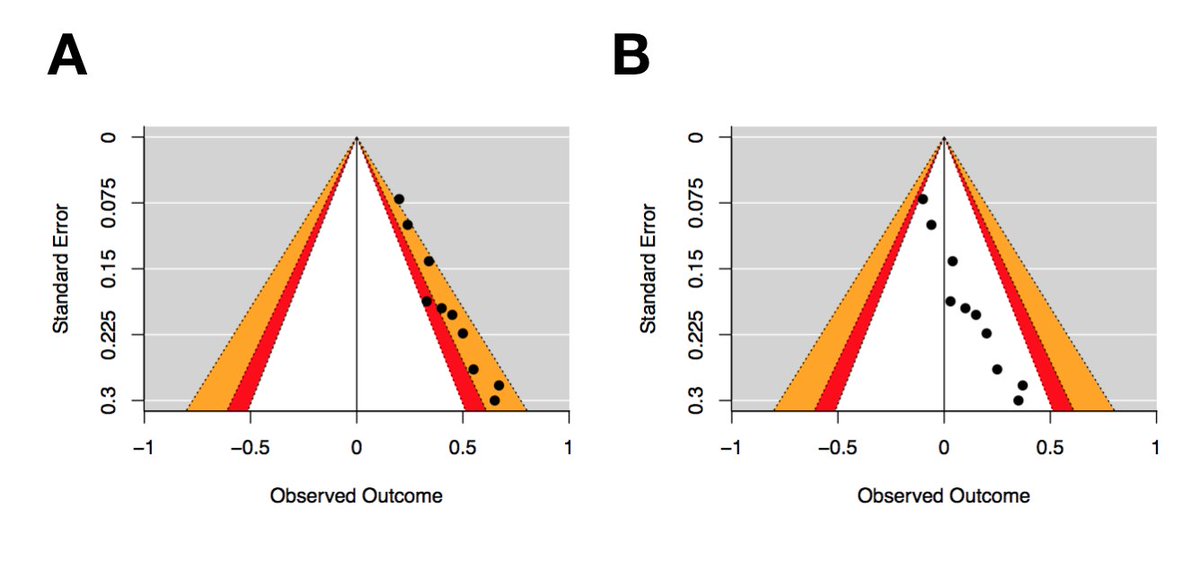
Let’s consider these two funnel plots. Plot A seems to be fairly symmetrical, with roughly the same number of studies either size of the summary effect size. Studies with greater variance have a larger spread around the summary effect size, near the bottom of the plot.
In contrast, Plot B is not symmetrical. It seems that the studies with more variance (i.e., studies with fewer participants) only fall to the right of the summary effect size. Many researchers would conclude that plot B is indicative of publication bias, due to the asymmetry.
Second, Egger’s regression test is often used as an objective measure of funnel plot asymmetry, as it assesses the relationship between the effect size and a measure of variance. A statistically significant effect is indicative of funnel plot asymmetry bmj.com/content/315/71…
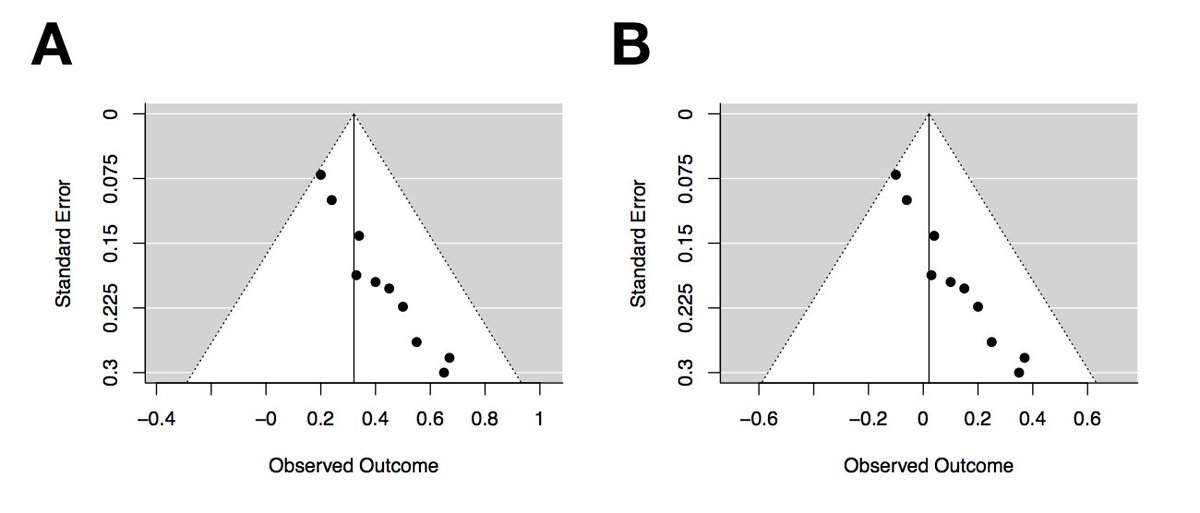
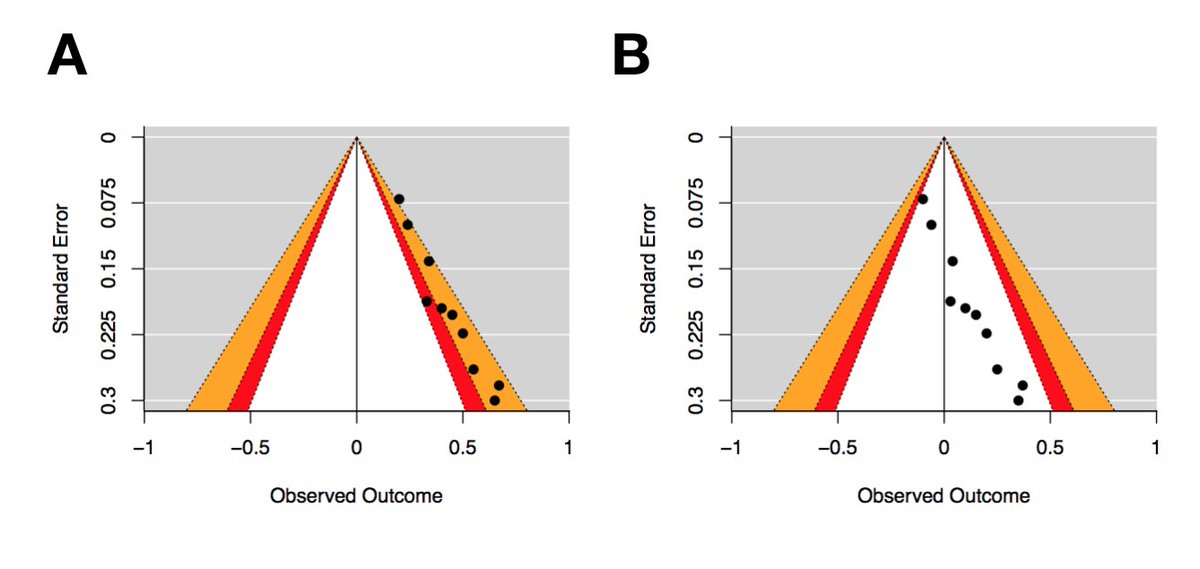
Now let’s consider the two new funnel plots, each with ten effect sizes. Both plots demonstrate asymmetry, but note the differences in observed outcomes (i.e., effect sizes). The effect sizes in Plot A range from .2 to .65, whereas the effect sizes in plot B range from -.1 to .35
For a given range of effect sizes and variances, it’s possible to calculate statistical significance for any combination of these two variables. This means you can easily superimpose a set of significance thresholds on a traditional funnel plot.
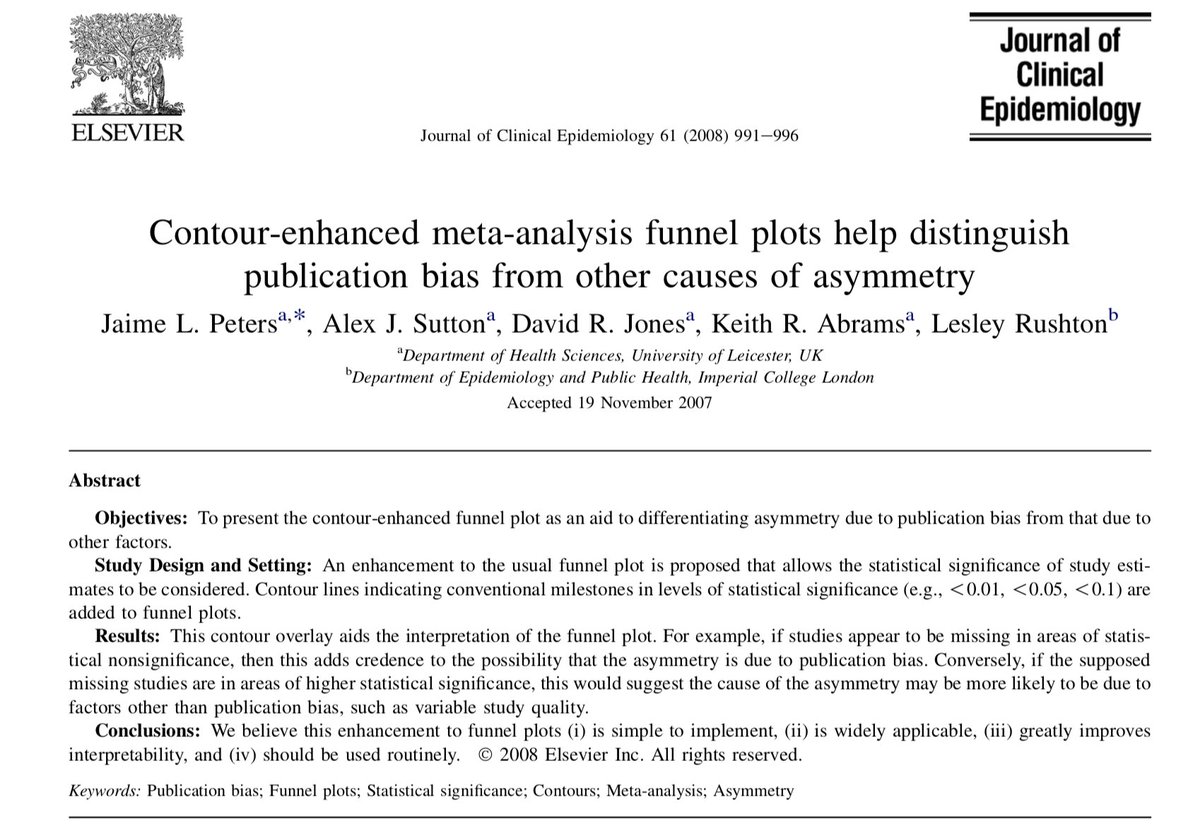
These plots are called contour-enhanced funnel plots, and were first described by Peters and colleagues in 2008 ncbi.nlm.nih.gov/pubmed/18538991
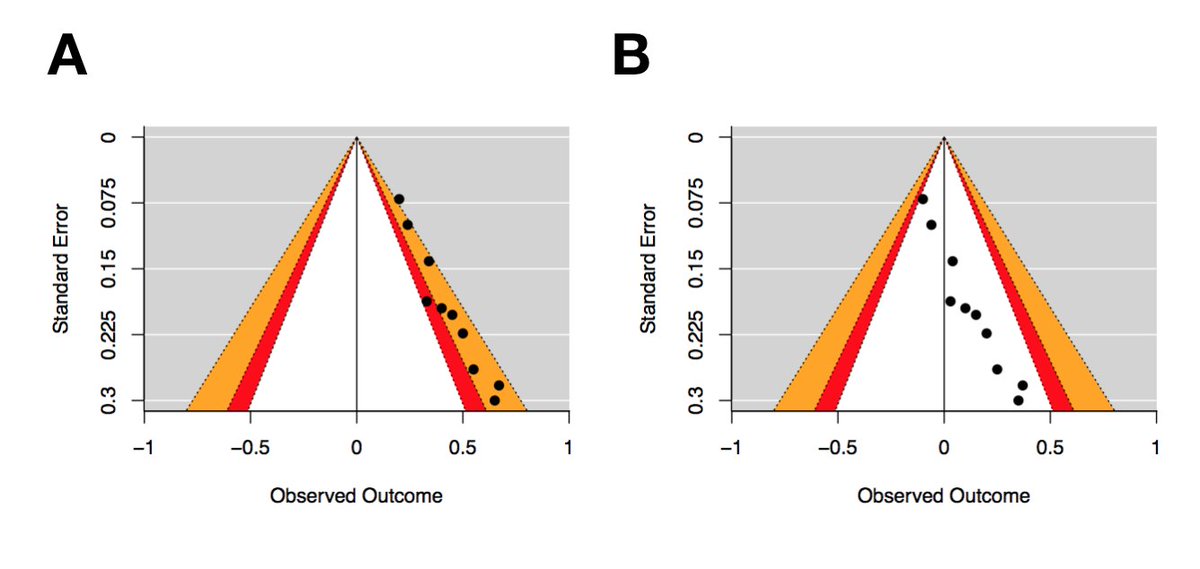
These funnel plots are a duplicate of the previous plots, except key areas of statistical significance have been added to the funnel, and the plot is now centred at zero. The red zones show effects between p=.1 & p=.05, and the orange zones show effects between p=.05 & p=.01
Egger’s regression test for both of these plots yield identical outcomes (z = 2.78, p = 0.01), which are suggestive of asymmetry. However, there’s a clear pattern in plot A, with studies falling into the statistical significance channel on the right of the funnel.
Plot B displays clear asymmetry, but none of the studies are statistically significant. So despite this asymmetry, it's likely that factors other than publication bias are contributing to this funnel plot asymmetry.
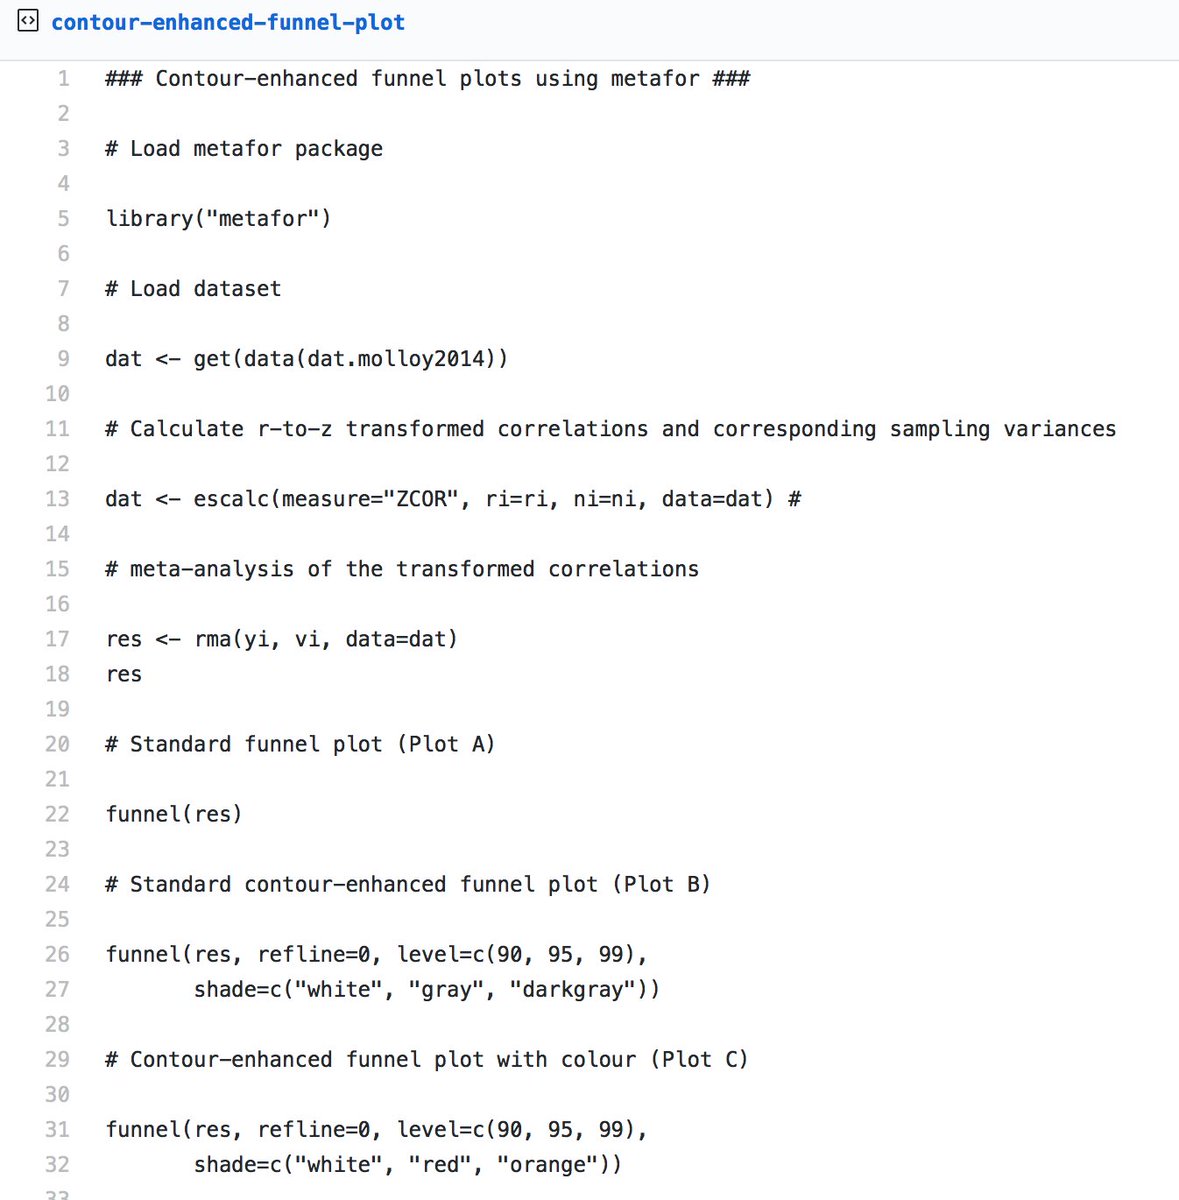
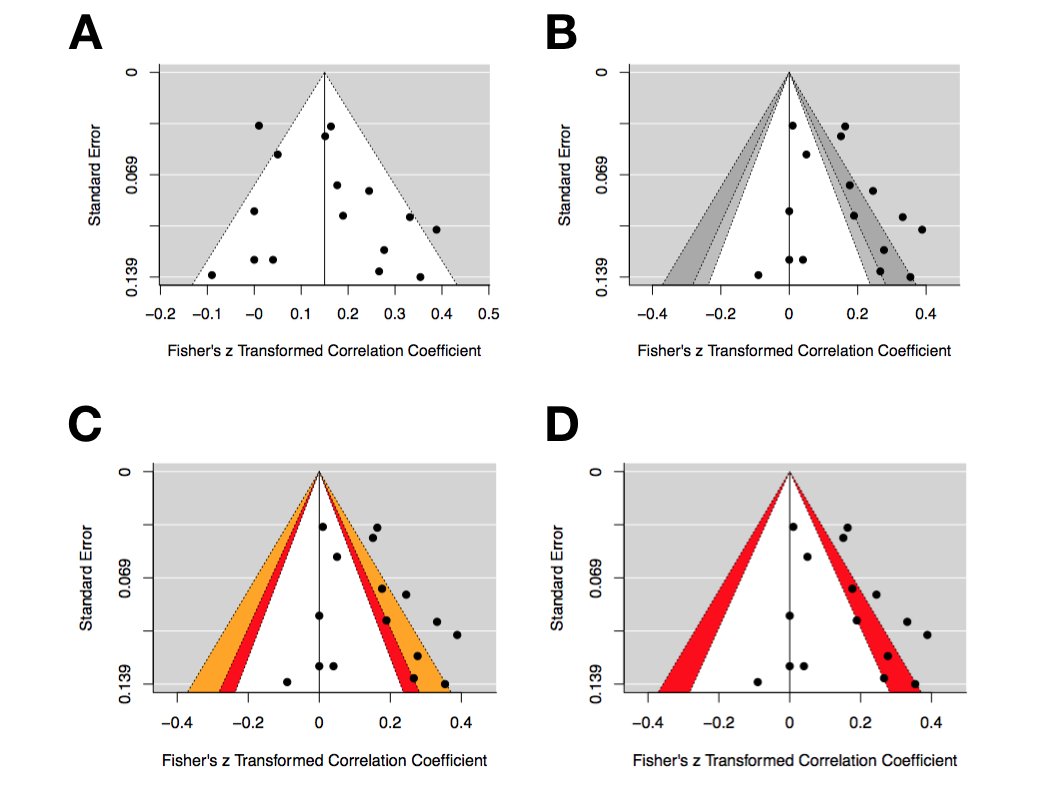
To make your own contour-enhanced funnel plots, you can use this R script gist.github.com/dsquintana/b4a… This script will generate a standard funnel plot and three different contour-enhanced funnel plots, using the metafor package
Plot A is a standard funnel plot. Plot B is a contour enhanced funnel plot — note that the vertical reference line is now at zero. Plot C has added a little colour, and Plot D has adjusted the contour lines to a single contour between p=.05 & =.01
While contour-enhanced funnel plots are handy, they cannot be used to objectively assess the risk of p-hacking, or the degree of effect size inflation. Despite these limitations, funnel plots can still provide a valuable addition to the visualisation of meta-analyses.
If you’re new to R, you should check out my step-by-step tutorial paper for performing your own correlational meta-analysis frontiersin.org/articles/10.33… I also put together a companion video, if that’s more your thing
One of the many benefits of using R for your analysis is that you can easily share the analysis script with your manuscript.
Open materials are usually promoted for the purpose of other scientists to reproduce your analysis. However, you’ll quickly learn that one of biggest beneficiaries of open materials is your *future-self*, for when you need to revisit analyses.
Here’s the blog post version of this thread medium.com/@dsquintana/co…
Missing some Tweet in this thread?
You can try to force a refresh.

Like this thread? Get email updates or save it to PDF!

Subscribe to Dan Quintana
Profile picture

Get real-time email alerts when new unrolls are available from this author!

This content may be removed anytime!

Twitter may remove this content at anytime, convert it as a PDF, save and print for later use!

Try unrolling a thread yourself!

how to unroll video

1) Follow Thread Reader App on Twitter so you can easily mention us!

2) Go to a Twitter thread (series of Tweets by the same owner) and mention us with a keyword "unroll" @threadreaderapp unroll

You can practice here first or read more on our help page!

Did Thread Reader help you today?

Support us! We are indie developers!


This site is made by just three indie developers on a laptop doing marketing, support and development! Read more about the story.

Become a Premium Member and get exclusive features!

Premium member ($3.00/month or $30.00/year)

Too expensive? Make a small donation by buying us coffee ($5) or help with server cost ($10)

Donate via Paypal Become our Patreon

Thank you for your support!