,
34 tweets,
10 min read
Read on Twitter
something I'm trying to think through... People analogizing today to end of the tech bubble period. I think there are huge differences, but worth considering. so this is just a collection of stuff I'm pulling together, any thoughts or additional data appreciated.
The bubble was two parts: there was the internet/new economy nuttiness, and the telecom/fiber buildout. One couldn't happen without the other. But they were different. Internet stuff was equity financed, telecom was debt. Today, closest analogy I can think of is cloud buildout.
So that's ultimately where I want to end, comparing cloud to telecom buildout, but first want to think through at a higher level, what the comparisons look like.
The market in 2000 traded at over 30x earnings, and tech stocks traded at a 150% premium. Things were expensive!
This is year end 1999. Microsoft traded at 78x trailing earnings. Today it trades at 24x. Look at Cisco. And Alcatel. And Oracle. 

Here are some stats on IPOs
Ok, so we established the internet stuff was nutty. And P/E's were high. The market basically collapsed upon itself. But I think the bigger impact was from the decline in investment spending from the telecom collapse, which actually came later. I wanted to find stats on that.
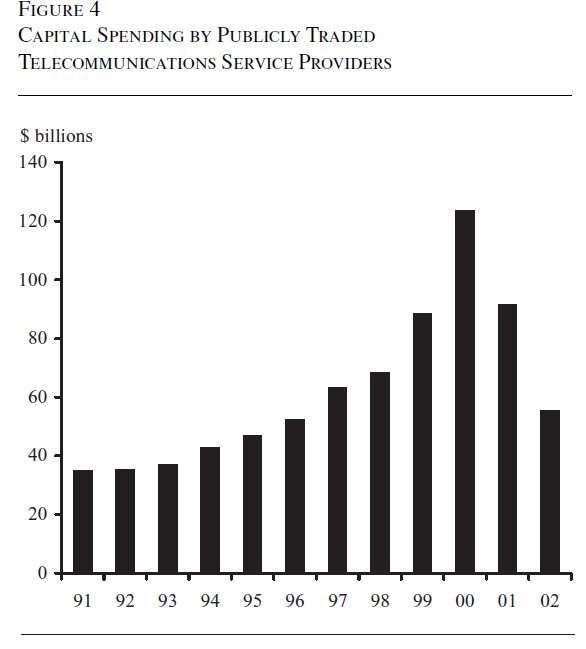
I found a Fed paper showing capex of publicly traded telecom companies. Capex reached $120B in 2000. And fell 50% in 2 years. Again, this was funded by debt. That's important, as we'll come back to.

The 2001 recession has always been a bit of a strange one. Real Personal Consumption Expenditures grew right through it. It was a business investment led recession. The hangover from all this investment.

So that's what I'm focused on. It strikes me that households are in good shape today. Savings rate higher than would think at this stage. MEW hasn't even begun. Credit never got crazy. So a recession would likely be business investment led. Where has the investment been?
we know tech has been the big driver of investment this cycle. capex has been muted almost everywhere else since energy collapsed
You can see that capex has lagged earnings growth this cycle
And more recently a huge percentage of the growth in capex has been FANG.
So here's where we get to the cloud buildout. AMZN, MSFT, GOOG have spent $49B in capex and $62B in R&D TTM. But they have $136B in net cash and generated $79B in FCF. If you add in FB and AAPL, you get another $25B in Capex, $23B in R&D, but also $163B in cash and $77B in FCF.
So this time, the main spending has been driven by companies that not only have tens and hundreds of billions in cash, but also in cash flow. So they will not be the problem. The problem would obviously be downstream. That's where we have to think about.
It would likely be data centers, and semiconductor co's that sell into data centers. What about SAAS co's? Now that so many have shifted to subscription models turning capex into opex, do you stop paying? I don't know.
But I am all ears for what the economic ramifications of a slowdown in cloud spending means. Because a) it is definitely going to slow next year b) I have problems analogizing it to telecom because magnitude isn't as great and it's being funded out of cash on hand and cash flow
Good point. AWS would seem more exposed to a downturn since most/all VC backed startups choose them vs Azure being much more Enterprise. But without knowing magnitude of startups relative to AWS revs hard to know impact.
One follow up, idea here is what the hit to the economy will be. Whether semi stocks or whatever have priced in a downturn in data center buildouts is relevant to the extent it impacts mgmt spending decisions. I'm trying to think where capex/opex gets cut enough to hurt real econ
Ok, so gonna try to put the spending into context. Thanks to @teasri for helping me find certain expenditure series and who will correct me if I'm doing this wrong. Think i'm using Nominal dollars here in all cases, to be able to compare to company level data.
First, here is private non residential investment in nominal dollars and Y/Y change. Can see the large declines in 01/02 and 08/09, but also the "mini recession" of 15/16.


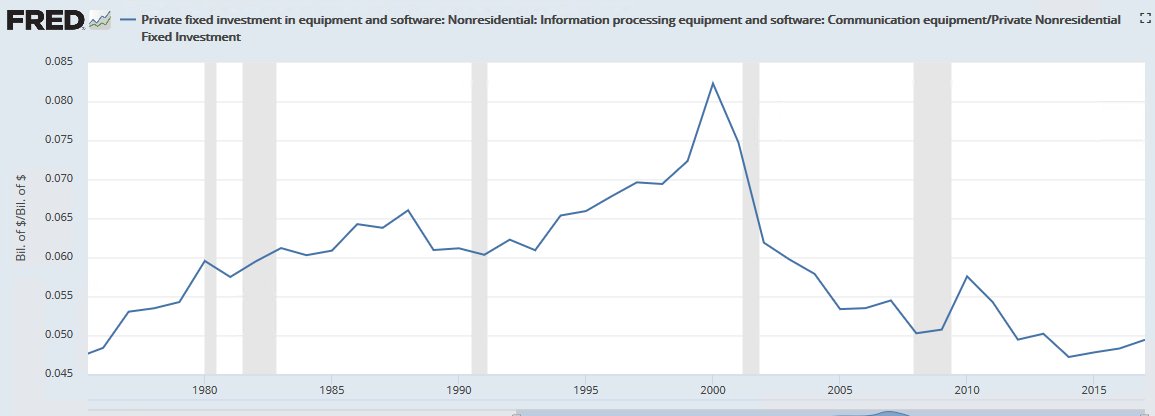
Here is investment in communications equipment and the Y/Y change. You can see a couple things. 1) it took 17 years to get back to the 2000 level 2) spend fell almost 2x as much during the tech collapse then during the GFC


I tried to calculate what the decline in private non res investment ex communications equipment spend was, and it looks like instead of an almost 10% aggregate decline, non telecom fixed investment fell closer to 6%.

A more interesting way to look at this is what did investment in communications equipment as a percent of private non res fixed investment get to. Here's where this is hopefully appropriate series to compare. In 2000, comm equipment hit 8.5% of non res investment.
I was curious how did this compare to energy investment, i.e. the fracking boom. Here is $ investment in mining and as percent of private non res fixed. Even at it's peak in 2014, energy investment only hit 8.2%. Also new heuristic, if something hits 8% of investment, watch out?


Software does appear to be eating the world. Based on the modest y/y declines in spend in tech crash, and basically flat spend in the GFC, it would appear that software spend is much less likely to be cut than capex.


Recessions in the US are usually autos and housing, again why the 01 recession sticks out. Housing is def weak right now, I think it will pick up mid to late next year, but even if not, it never recovered!
Autos have been sideways for years. Definitely downside risk here so worth watching, but not like there's been a huge boom either.
corporate debt is elevated, but it's the least levered companies lightly levering up, rather than heavily levered companies adding more
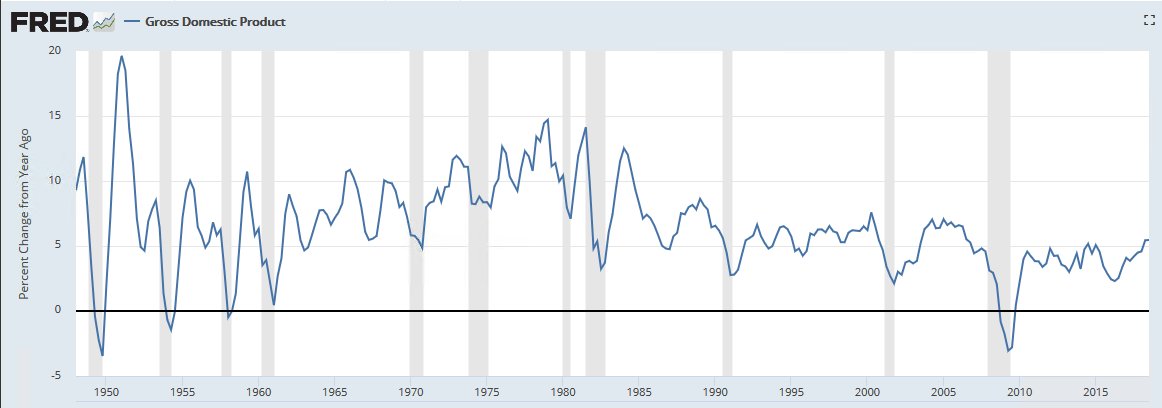
We can have a recession where RGDP goes negative for a couple quarters since Inflation is now running closer to 2 than 1. But looking at NGDP, what's striking to me is that Y/Y growth was lower in late 15/early 16 than most of the 01/02 except Q4 after 9/11.
Sorry one more then I'll stop clogging the feed. I quickly pulled TTM capex for:
FAAMG = $74B
Big 4 wireless + CHTR/CMCSA = $77B
Towers/EQIX/DLR/ZAYO/CTL/FTR/GLW = $12B
So all in $163B or 5.8% of non res fixed investment. In 2000 telecom capex was 8.4%.
FAAMG = $74B
Big 4 wireless + CHTR/CMCSA = $77B
Towers/EQIX/DLR/ZAYO/CTL/FTR/GLW = $12B
So all in $163B or 5.8% of non res fixed investment. In 2000 telecom capex was 8.4%.