,
25 tweets,
5 min read
Read on Twitter
1 The word “statistics” is derived from the Latin status, which led to the Italian word statista, first used in the 16th century, referring to a statist or statesman – someone concerned with matters of the state.
2 It was the Scottish landowner and first president of the Board of Agriculture, Sir John Sinclair (1754–1834), who introduced the word “statistics” into the English language in 1798 in his Statistical Account of Scotland.
3 Mathematical statistics encompasses a scientific discipline that analyses variation, and is often underpinned by matrix algebra. It deals with the collection, classification, description and interpretation of data from social surveys, scientific experiments and clinical trials.
4 There are different approaches to probability:
1. Subjective
2. Games of chance
3. Mathematical
4. Relative frequency
5. Bayesian
1. Subjective
2. Games of chance
3. Mathematical
4. Relative frequency
5. Bayesian
5 Six main probability distributions: 1. Binomial distribution
2. Poisson distribution
3. Normal distribution
4. Chi-square distribution
5. t distribution
6. F distribution
2. Poisson distribution
3. Normal distribution
4. Chi-square distribution
5. t distribution
6. F distribution
6 There are two types of statistical distributions: probability distributions, which describe the possible events in a sample and the frequency with which each will occur; and frequency distributions.
7 Frequency distributions transform very large groups of numbers into a more manageable form and show how frequently a particular item or unit in a group occurs.
8 Variables are characteristics of an individual or a system that can be measured or counted. These can vary over time or between individuals.
Normal Distribution
To a statistician it is a theoretical construct used to express what might be true of the relation between data that one collects and the probability of those values occurring by chance.
To a statistician it is a theoretical construct used to express what might be true of the relation between data that one collects and the probability of those values occurring by chance.
10 The normal curve has three mathematical properties: 1. It is a bell-shaped symmetrical curve, which is continuous and ranges from negative infinity to positive infinity. 

11 The mean and the standard deviation define its shape; the theoretical normal distribution has a population mean of zero and a standard deviation of 1. Different standard deviations will produce slightly different shapes.

12 The skewness of the normal curve is zero, because it is symmetric around the mean. If the distribution were skewed to the left side, a measure of skewness would produce a negative value; if skewed to the right, this would result in positive value.
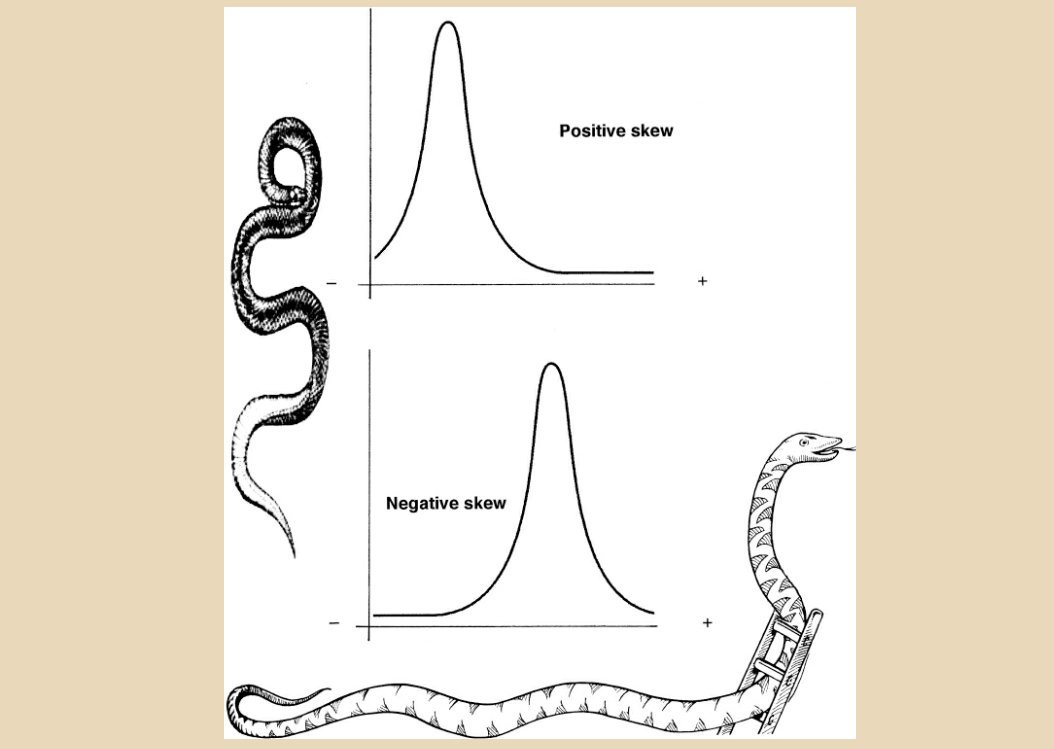
13 The direction of the tail indicates if it is positively or negatively skewed.
14 For statisticians there are three kinds of averages:
the arithmetical mean,
the median and
the mode.
the arithmetical mean,
the median and
the mode.
15 The mean is what most people are accustomed to calling an average. It involves adding up all of the values in a set of data (X) and then dividing by the total number (N) of cases.
16 The Median is the point that divides the distribution into a lower half and an upper half so that 50% of the values are in one half and 50% are in the other.
17 The mode is a point of maximum frequency; it is used most often to look for typical cases.
18 The advantage of using the mean is that the calculation is straightforward and it uses all the data in a group. However, if some items are of very low or very high values, this will distort the mean value.
19 The median, however, is unaffected by extreme values. For example, if one were to locate the median salary in this group of figures: €40,000; €60,000; €120,000; €160,000; €820,000-the median would be the middle figure of €120,000.
20 The Standard Deviation
Pearson introduced the standard deviation in his Gresham lecture of 31 January 1893, referring to it initially as the “standard divergence”. John Venn had used the term “divergence” a couple of years earlier when referring to deviation.
Pearson introduced the standard deviation in his Gresham lecture of 31 January 1893, referring to it initially as the “standard divergence”. John Venn had used the term “divergence” a couple of years earlier when referring to deviation.
21 The standard deviation is a measure of variation. It indicates how widely or closely spread the values are in a set of a data, and shows how much each of these individual values deviate from the average (i.e. the mean).
22 The covariance is the measure of how much two random variables move together. If two variables tend to move together in the same direction, then the covariance between the two variables will be positive.
23 If two variables move in the opposite direction, the covariance will be negative. If there is no tendency for two variables to move one way or the other, then the covariance will be zero.
24 Correlation one of the most widely used statistical methods, indicates the extent to which two variables go together (e.g., height and weight). The most common type measures a linear relationship between two variables, and refers to how well they go together in a straight line