
Financial economics vs accounting = NPV vs gross profit, an example: 

Management communication of positive NPV project and gains for existing vs new shareholders:

"In a famous survey, Graham, Harvey, and Rajgopal found that 80% of CFOs would cut spending on discretionary future-oriented activities such as marketing and R&D to meet short-term earnings targets." nber.org/papers/w10550
Earnings growth is comprised of two components: investment and efficiency growth:

Beware of the old plant trap!

Inflation-Adjusted Gross Investment:
The inflation-adjusted gross investment (IAGI) represents the total capital invested in the firm:
The inflation-adjusted gross investment (IAGI) represents the total capital invested in the firm:


Inflation adjustment vs Fair Value:

"Approximately 90% of U.S. companies lease equipment. Of the more than $2 trillion spent by U.S. companies in 2016 on productive assets, 10% of these assets were procured through operating lease contracts."

What is the present value of a constant pile of cash held forever?

Calculating asset life:


Gross cash flow (GCF) estimates the gross after-tax cash flow generated from the firm’s operating assets:

Book vs Cash taxes:

As debt increases, the firm’s risk increases, and this is recognized in part through a leverage risk factor in the company’s discount rate.

FIFO Profits:
In a period of rising inflation, firms using the FIFO method to quantify inventory reportmore accurate balance sheet accounts but less accurate cost of goods sold.
In a period of rising inflation, firms using the FIFO method to quantify inventory reportmore accurate balance sheet accounts but less accurate cost of goods sold.
Stock compensation expense:

"Pension debt is added to debt-equivalents for valuation purposes.However, in the case of a pension surplus, this is not added to the value of the company, since these funds belong to the pension holders."
"Minority interest is added back to net income since we are interested in the return to all capital providers."
"Special items are added back to net income (reversed) since CFROI is attempting to capture the normalized cash return on invested assets."
"Because it represents a premium over the book value of the assets, it can only be a drag on the operating returns of the business. This does not mean that senior executives and corporate boards should not be held responsible for acquisition goodwill."

Estimating gross plant recaptured:

the sign of FCFF tells us nothing about the quality of the company and its investments:

Flowchart to determine how long an explicit forecast period should last and how best to estimate the terminal value:


A fatal error in terminal value:


Economic profit:

Implied Competitive Advantage Period of Blockbuster:


Price/Book versus forward spread for different CAPs (in years):

"If you understand the competitive advantage period implied in a company’s share price, you can quantify the impact on the stock price and its price multiples if investors’ expectations about the firm’s competitive advantage
period change."
period change."
Strategic Resources and Consequences Report proposed by Professors Lev and Gu:

Yes MM, Firm Value = Value of Existing Business + NPV of Future Investments, but we need to distinguish between the CAP of the existing business vs the CAP of the incremental investments:

Forward spread decay at different fade rates: the greater the spread the more spread matters. The fade rate can also be interpreted as the probability of the economic spread (ROIC – r) irreversibly jumping to zero in any given year.


If there is no decay in profitability, f equals 0% and we arrive at MM’s famous formulation (under assumption of g = 0 and no reinvestment opportunities, the value of the existing business equals NOPAT/r) but if ROIC = r, then we also arrive at MM’s simple perpetuity.

From a value driver perspective, decay in profitability can be due to a decrease in asset turns: obtaining less revenue per unit of capital, or a decrease in profit margin, that is, a drop in operating margin:


Fade vs growth and profitability:


Value driver tree.
"Revenue or earnings growth is the growth driver in most valuation models. Revenue is not a control variable and input but rather the output resulting from investments. The proper control variable and driver should be investment growth."
"Revenue or earnings growth is the growth driver in most valuation models. Revenue is not a control variable and input but rather the output resulting from investments. The proper control variable and driver should be investment growth."


"Because investment growth is our value driver, it is unnecessary for us to split the firm into separate existing and growth components" (shots fired at McKinsey):

"Earnings growth can result from growth due to investment or growth due to efficiency. Growth from efficiency gains is unsustainable. When these gains approach their limit, the related earnings growth will fall to zero. Growth from efficiency should be a central element..."
"...in an explicit forecast. The return on incremental investment growth most likely decays for maturing firms since marginal customers find the products and services less valuable, which is in line with our pricing model."

"On July 1, 2015, you had to believe that Macy’s CFROI of 12% would not fade to consider it a value stock; that is, its share price of $63 implied a fade rate of
between 0% and 5%, which suggests an almost impenetrable economic moat."
between 0% and 5%, which suggests an almost impenetrable economic moat."


The fallacy is wrong: "Although there is plenty of academic and HOLT research to suggest that corporate profitability reverts to the mean, it is impossible to prove that the mean is always the cost of capital. The assumption of mean-reversion to the cost of capital is...
...grounded in neoclassical economic theory and reasonable over the long run. However, this assumption can be troublesome for entrenched and highly successful companies in defensive industries that possess valuable intangible assets."
The unbearable lightness and absurdity of P/E ratios.

Assessing growth options:

The value drivers for change in economic profit are diagrammed in the flowchart. Investment growth comes from investing in positive NPV projects, and efficiency growth comes from improving operating margins and asset turns:

Investment in Project A consists only of non-depreciating assets; for example, production is outsourced, while the investment in Project B is solely in depreciating assets; for example, in-house production.

Both projects have an IRR and CFROI of 10%, and would appear equally attractive to investment decision makers. NPV tells another tale:

"Internal rate of return is a popular and treasured metric since it does not require an external cost of capital and all the squabbling that accompanies its quantification. NPV is a superior metric for assessing value but requires an explicit risk-adjusted discount rate."

"Investors must recover the cost of the depreciating assets whereas non-depreciating assets are fully recovered at the project’s conclusion. This is the basic distinction between earning a return on investment and recovering the principal invested, that is, return of investment."

Interesting, maybe companies that aren't part of an index should deserve a lower discount rate:

Reflexivity and the low-risk anomaly (ie companies with low beta and low volatility have done relatively better vis-à-vis CAPM predictions than riskier high beta and high volatility stocks.)

From market-implied clearing rate to company-specific discount rate:


Market leverage differential for U.S. Industrial/Service firms (value investors and the dot-com bubble).
Size differential for U.S. Industrial/Service firms.
Size differential for U.S. Industrial/Service firms.


life-cycle theory of the firm calls for using anticipated returns rather than historical returns in determining the discount rate. Another weakness of CAPM is the reliance on a historical average of the ERP. Mr. Market’s risk appetite can change suddenly from euphoria to panic.

"A common mistake is to assume a firm’s marginal cost of debt or yield-to-maturity (YTM) on its debt is the expected cost of debt. This assumption is valid for investment grade debt but fails when debt gets riskier. "

Do equity discount rates mean revert?


How Does the Monthly Change in the U.S. Discount Rate Behave?


Forward estimates of the discount rate can be generated by incorporating an error term in a simple predictive model:


The market-implied equity risk premium (ERP) can be estimated from the weighted-average discount rate:

"For investors who have to be invested in equities, or believe the market is approximately right in the aggregate, it is sensible to take a market-neutral approach and use the most current market-implied discount rate when valuing stocks."
A stylized view of the competitive life-cycle. Note importantly, that we do not assume firms evolve chronologically through the life-cycle.There is no evidence to support such a claim. Instead, corporations transition from one state to any other.

As an industry matures, excess incremental profits from a Star’s core offering become increasingly difficult to earn:

the only sustainable competitive advantage in a commodity-based industry is efficiency:

Honeywell International and its different life-cycle states:


Life-cycle transition probabilities and shareholder return: the payoff for correctly anticipating a transition can be enormous

Percent of publicly traded firms by life-cycle state:

we created two portfolios based on a company’s CFROI rank and placed the top 20% of firms in the highest CFROI portfolio and the bottom 20% in the lowest CFROI portfolio.
enduring profit makers make up less than 5% of all publicly traded
firms. Most firms revert to the mean
enduring profit makers make up less than 5% of all publicly traded
firms. Most firms revert to the mean

Let’s develop a simple test and place companies into quartiles (four rank-based groups) based on their starting CFROI level. In which quartile are firms after four years?
firms with above-average CFROI inQ3 had a 41% probability
of transitioning to a lower quartile after 4 years.
firms with above-average CFROI inQ3 had a 41% probability
of transitioning to a lower quartile after 4 years.

Industry Persistence: Does Industry Matter?
How often do firms within an industry transition between performance
quartiles?
How often do firms within an industry transition between performance
quartiles?

"What you are seeing is reversion to the mean in corporate profitability, not random chance. Corporate profitability is sticky (persistent) but tends to deteriorate for above-average companies"

CFROI as an AR(1):


Median annual CFROI persistence by U.S. Industry Groups
Annual CFROI persistence and the long-term CFROI by Industry Group
Annual CFROI persistence and the long-term CFROI by Industry Group


Largely overlooked by academia is the practical application of persistence research to forecasts of corporate profitability:


"Backtests with perfect knowledge demonstrate that companies with the highest g had better total shareholder performance than lower growth firms. This potential persuades many investors to pay large premiums for high-g stocks, but few firms actually deliver on these expectations"
"a firm’s forecast cash flows should be based on organic growth unless the cost of acquisitions is deducted. We have witnessed many forecasts that assume an acquisitive firm can continue to grow at the same rate but without any recognition of the cost of future acquisitions."
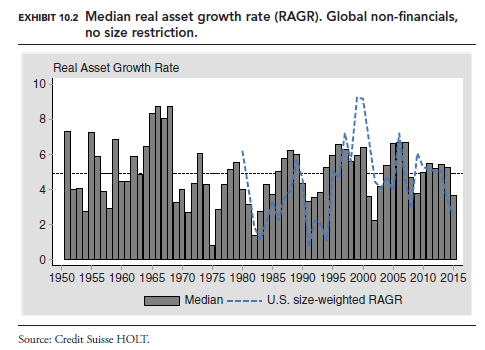
"Firms just entering the public record tend to grow at high rates: the average freshman experienced real asset growth averaging 16% in its first public year, but this level quickly converges toward 5%. Beyond 10 years, the average growth rate reverts toward 2.5%"

regarding previous exhibit: success bias, assets growth vs sales growth and valuation recommendations:

Is corporate growth a mean-reverting process, or is growth simply a random outcome?
persistent after one year, almost random after four.
percentage of firms that sustained growth above a given level for 1, 3, 5, and 10 years:
persistent after one year, almost random after four.
percentage of firms that sustained growth above a given level for 1, 3, 5, and 10 years:


SGR_firm = Plowback ratio × ROIC
rental expense is a contractual obligation and retirements, the estimated value of depreciating assets that must be replaced, are based on the firm's asset age and its historical growth rate.
rental expense is a contractual obligation and retirements, the estimated value of depreciating assets that must be replaced, are based on the firm's asset age and its historical growth rate.


for companies experiencing high growth or meaningful changes in capital structure, a modification is necessary to better predict their growth:


Elon Musk, thinks Tesla sales can sustain 50% annual growth for the next decade. Let’s assume an 8% sales growth thereafter for our terminal growth rate. This is obviously absurd. Instead, it makes sense to employ a sustainable growth rate that mirrors economic reality.


Macy's:
(1) how has the stock performed historically?
(2) how is it priced to perform prospectively?
(3) how is it likely to perform empirically?
(1) how has the stock performed historically?
(2) how is it priced to perform prospectively?
(3) how is it likely to perform empirically?


The power of the green dot and how investors can act on this information.


“It is not just high CFROI that delivers great shareholder returns; it is all across the CFROI spectrum.” (relative achievement = achieved CFROI_t+5 – expected CFROI_t+5)

FINAL REMARKS
We should never forget market prices are transient. What is expensive today can be cheap tomorrow and vice-versa. In January 2003 MCD was trading at a HOLT P/B ratio of 1.0. Investors had priced the stock to earn only its cost of capital into the hereafter.
We should never forget market prices are transient. What is expensive today can be cheap tomorrow and vice-versa. In January 2003 MCD was trading at a HOLT P/B ratio of 1.0. Investors had priced the stock to earn only its cost of capital into the hereafter.

"Bob spent time considering and looking for changes in a company’s operating drivers. If a new CEO was hired, he would ask if the CEO was an asset turns or margin guy."

Present Value of Growth Opportunities: "HOLT research shows that there is a well-heeled limit to what investors should typically pay for growth: Stocks with more than 40% of total value attributable to growth (PVGO) should be avoided."


We recommend that you take two perspectives:

"For high-quality companies with exceptional returns on capital, don’t forget the neglected value driver: the rate at which profitability fades to the cost of capital."
that being said: "Don’t waste time if you can buy a high-quality stock at an attractive price. Our studies indicate that companies with poor profitability tend to remain stuck in the mud."


