,
8 tweets,
5 min read
Read on Twitter
@rsroc2 In general there are 3 types of rallies:
1 Across the board
2 Short squeeze
3 FAANG market cap driven
#1 is real
#2, #3 can only be detected by breadth indicators's divergence:
a. most shorted stocks rally
b Equal-Weigh vs Market cap
c Tons of breadth indicators
See Below
1/7
1 Across the board
2 Short squeeze
3 FAANG market cap driven
#1 is real
#2, #3 can only be detected by breadth indicators's divergence:
a. most shorted stocks rally
b Equal-Weigh vs Market cap
c Tons of breadth indicators
See Below
1/7
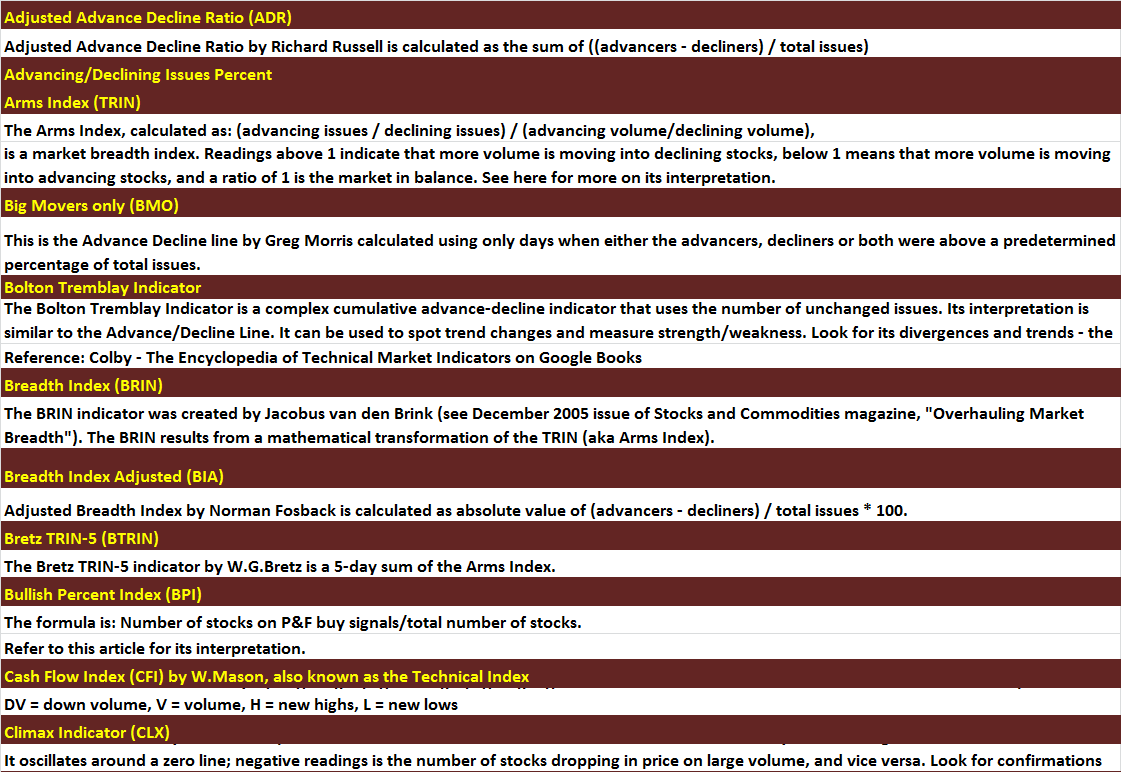
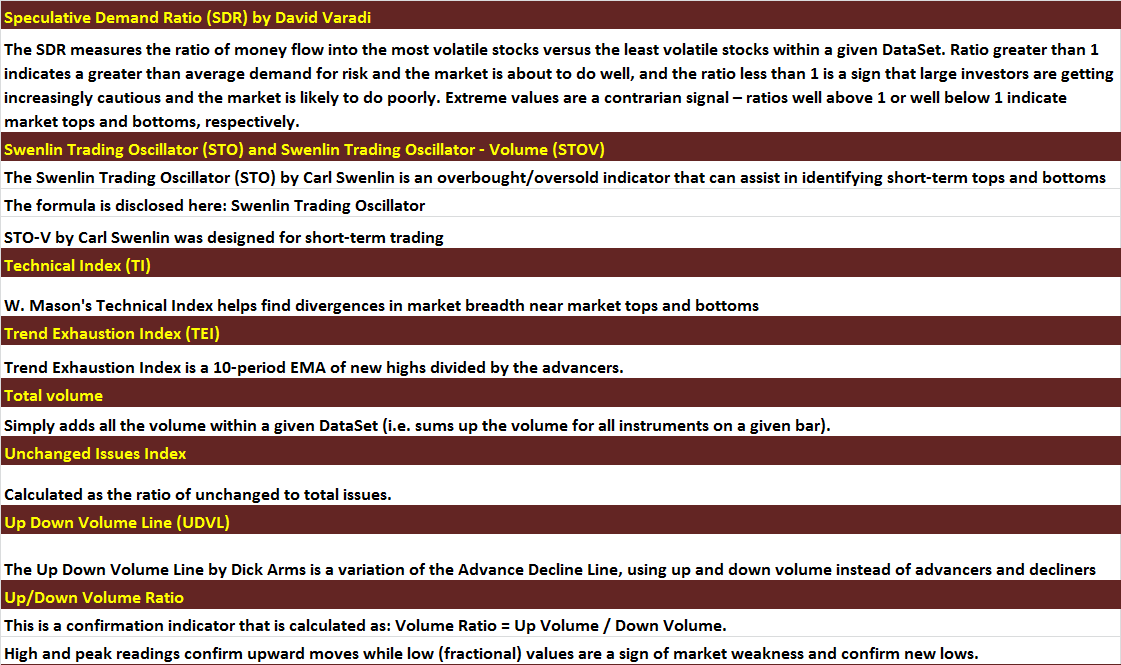
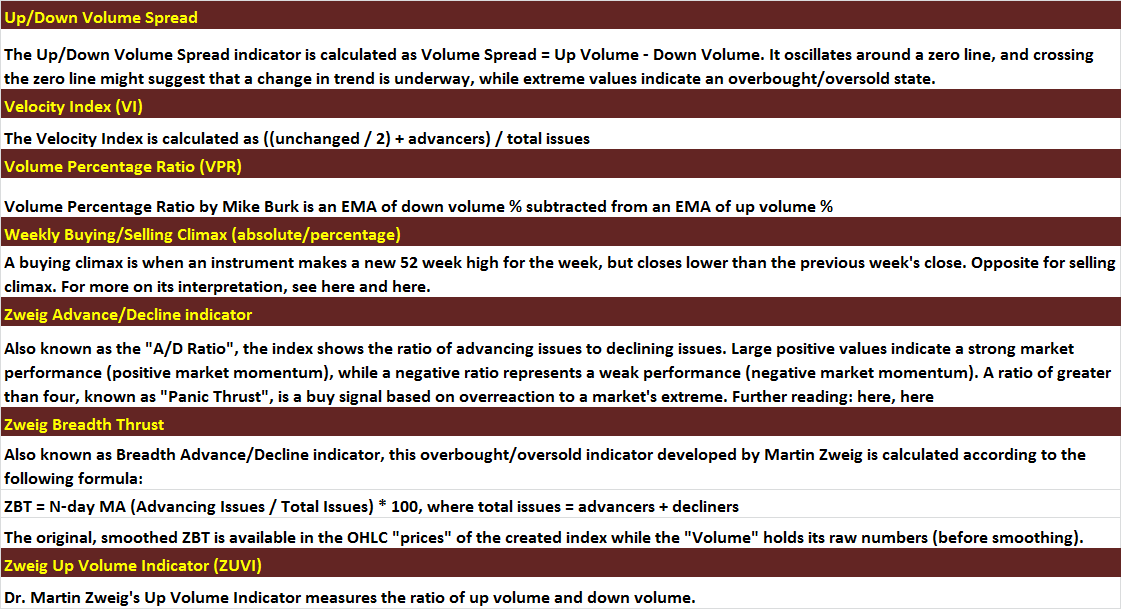
@rsroc2 These various breadth indicators taking into consideration of all component stocks of an Index, measuring the rally (plunge) strength under the hook based on many breadth measurements like adv volume, dec volume, up issues, down issues, etc.
2/7
2/7
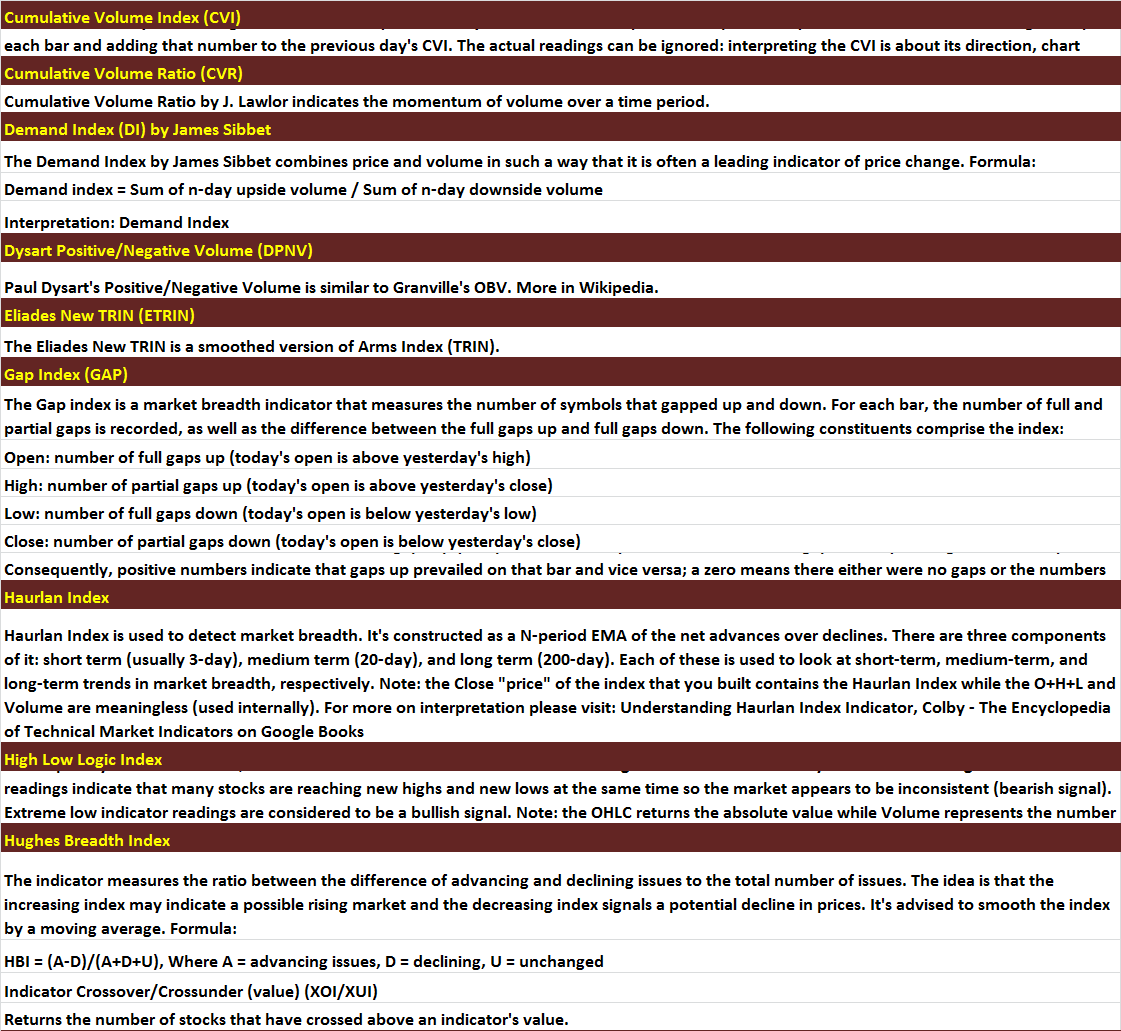
@rsroc2 Below book is a great summary of all available breadth indicators by Greg Morris.
Great read:
The Complete Guide to Market Breadth Indicators: How to Analyze and Evaluate Market Direction and Strength
by Gregory Morris (Author), Tom McClellan (Foreword)
Great read:
The Complete Guide to Market Breadth Indicators: How to Analyze and Evaluate Market Direction and Strength
by Gregory Morris (Author), Tom McClellan (Foreword)

@rsroc2 5/7
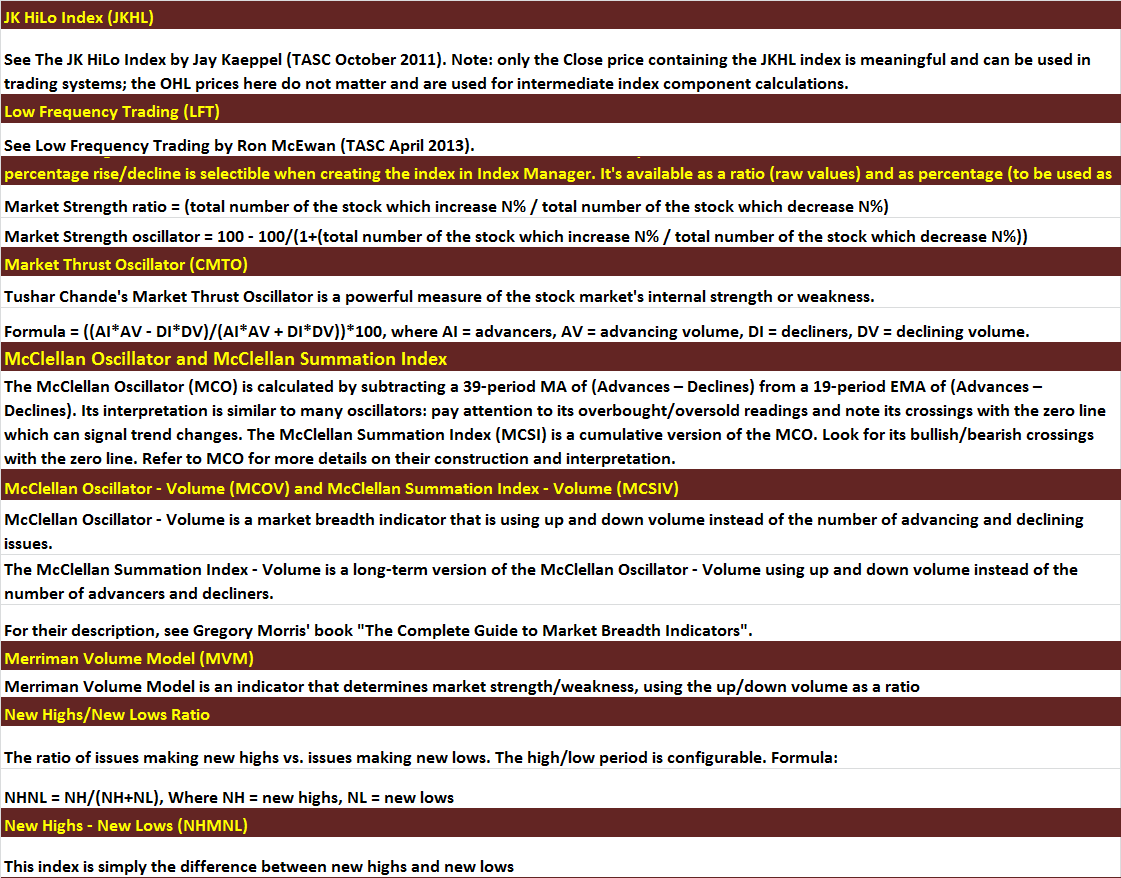
Others I have to implement myself.
The goal is to estimate and predict the breadth of all major Indexes and Sectors using all these indicators for market strength and weakness measurement; hence the divergence and convergence, etc
Others I have to implement myself.
The goal is to estimate and predict the breadth of all major Indexes and Sectors using all these indicators for market strength and weakness measurement; hence the divergence and convergence, etc
@rsroc2 6/7
All these breadth indicators can be implemented in such a way that it can be applied to a group of stocks (like SPY, RUT, NDX, MID, XLK, XLY, XLP components stocks), so as to measure the breadth strength & weakness from different perspective for major indexes and sectors.
All these breadth indicators can be implemented in such a way that it can be applied to a group of stocks (like SPY, RUT, NDX, MID, XLK, XLY, XLP components stocks), so as to measure the breadth strength & weakness from different perspective for major indexes and sectors.
@rsroc2 7/7
Greg Morris implemented hundreds of his breadth indicators described in his book with MetaStock charting and testing software.
Quite a collection of breadth indicators. You can see from my list
He is also the author of some popular "Candlesticks" chart patterns books.
Greg Morris implemented hundreds of his breadth indicators described in his book with MetaStock charting and testing software.
Quite a collection of breadth indicators. You can see from my list
He is also the author of some popular "Candlesticks" chart patterns books.