, 3 tweets, 2 min read Read on Twitter
Looking at new home sales, on a seasonally adjusted basis, 3 of 4 regions up y/y in Dec. Entirety of the decline is the West. Given South is > 50% of sales, big improvement there sticks out, Dec was 2nd highest of the year. Also revised nums speak to builders saying Dec > Nov.
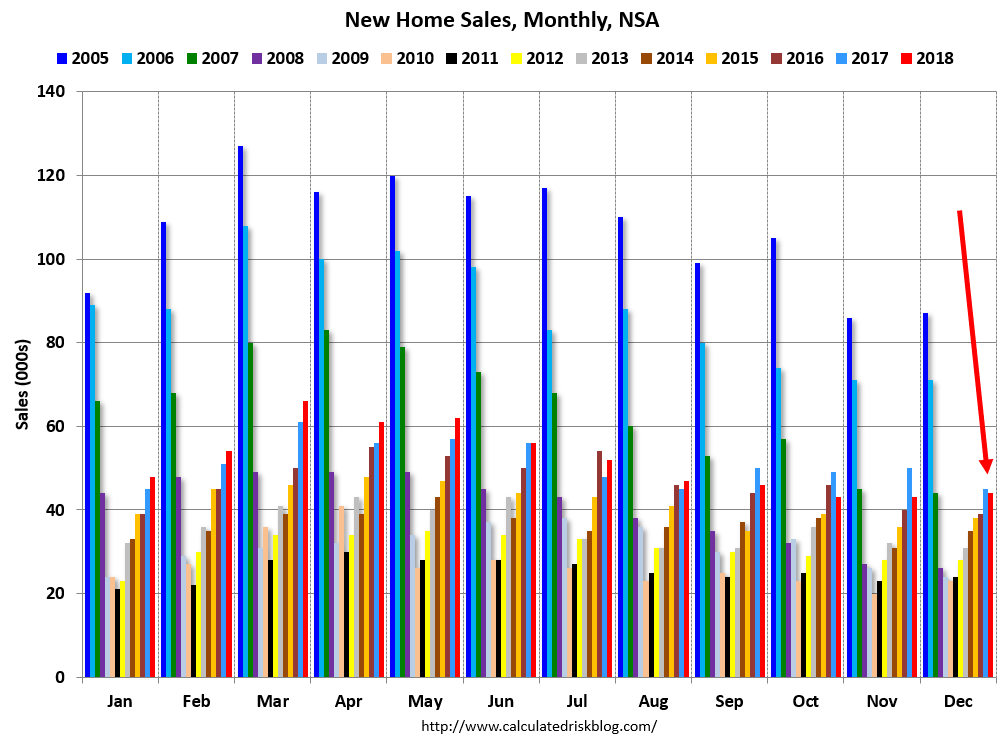
Love this chart from @calculatedrisk of non seasonally adjusted new home sales by month. Shows how bonkers 2005 was. But can 2018 started > 2017, then fell to down y/y in 2H. And can see Dec > Nov.
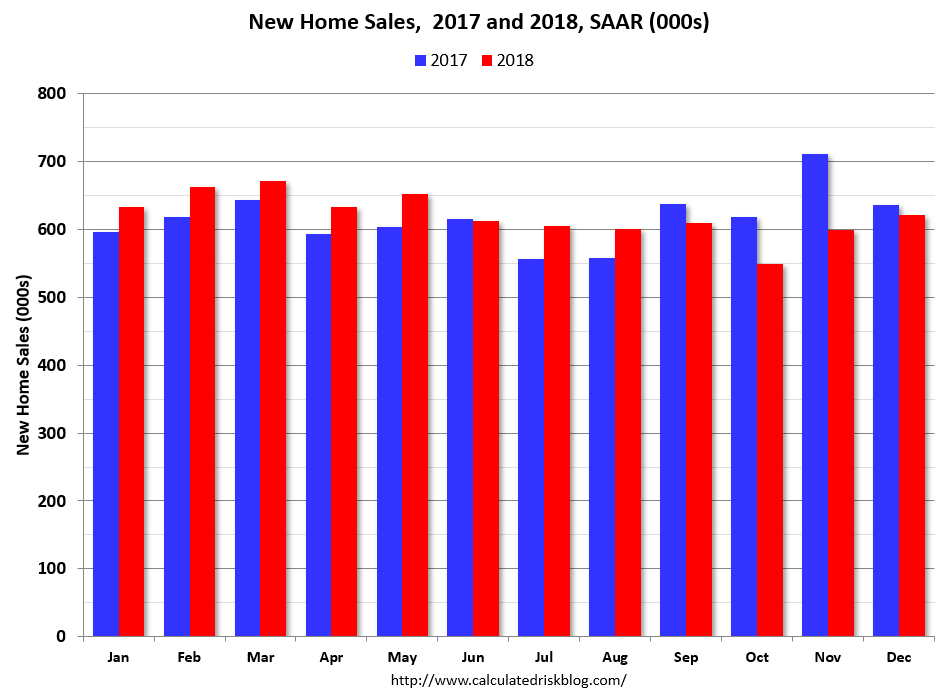
@calculatedrisk Another great chart from @calculatedrisk showing 2018 vs 2017 in new home sales SAAR by month
Missing some Tweet in this thread?
You can try to force a refresh.

Like this thread? Get email updates or save it to PDF!

Subscribe to modest proposal
Profile picture

Get real-time email alerts when new unrolls are available from this author!

This content may be removed anytime!

Twitter may remove this content at anytime, convert it as a PDF, save and print for later use!

Try unrolling a thread yourself!

how to unroll video

1) Follow Thread Reader App on Twitter so you can easily mention us!

2) Go to a Twitter thread (series of Tweets by the same owner) and mention us with a keyword "unroll" @threadreaderapp unroll

You can practice here first or read more on our help page!

Follow Us on Twitter!

Did Thread Reader help you today?

Support us! We are indie developers!


This site is made by just three indie developers on a laptop doing marketing, support and development! Read more about the story.

Become a Premium Member ($3.00/month or $30.00/year) and get exclusive features!

Become Premium

Too expensive? Make a small donation by buying us coffee ($5) or help with server cost ($10)

Donate via Paypal Become our Patreon

Thank you for your support!