
,
26 tweets,
9 min read
Read on Twitter
I’ve arrived in London for the World Rugby Law Review group meeting. A key role of laws is player welfare/injury prevention, so let me try give a run down of the key factors regarding injury - what, when, how - in a short thread ‘tutorial’ (1/)
First, we have to define an injury, because it could range from a ‘medical complaint’ to hospitalisation. Most of the studies (all of which are published/peer-reviewed) use a 1-day time loss - the player can’t play for a day. Then from this we can work out ‘incidence’ (or volume) 

“Incidence” is injuries per unit exposure. So you can say it as injuries per 1000 hrs (the best way). Or per match. Or minutes between injuries etc. In the data I’ll walk you through, there are 943 matches from 4 competitions, and the average is 86/1000 hours, or 3.4 per match.

Now, if you REALLY want to get into risk management, it helps also to understand injury risk PER EVENT. I’ll call this PROPENSITY. For example, you might see 9.8 injuries per 1000 tackles. Or 1 injury every 103 tackles, and so on. So let’s next look at those numbers in rugby.
Here is the incidence (injuries per 1000 hours) in global club competitions. It’s remained relatively stable over time, though we’re still in early days of surveillance, so the picture is ‘historically incomplete’. As mentioned, average is around 3 - 3.5 injuries per match

A concern is that while injury number has been stable, the severity is rising. This graph is from the published PRL/RFU injury report last year. See how ‘severity’ (defined as average days out with injury) is going up in the bottom panel, whereas incidence (top panel) is ‘flat'

So that’s negative. A positive, though it’s early days still, is that for the first time since HIA was introduced concussion incidence has dropped in every ‘mature’ injury surveillance system. Long way to go yet, but hopeful that efforts are having an impact. Gotta keep going

Let’s now look at activities causing injuries. This graph shows the percentage of injuries occurring in different phases of rugby. You’ll see that tackling + being tackled now make up about 50%. Followed by rucks (10%), then scrum/maul/LO (the rest are running/open play/unknown)

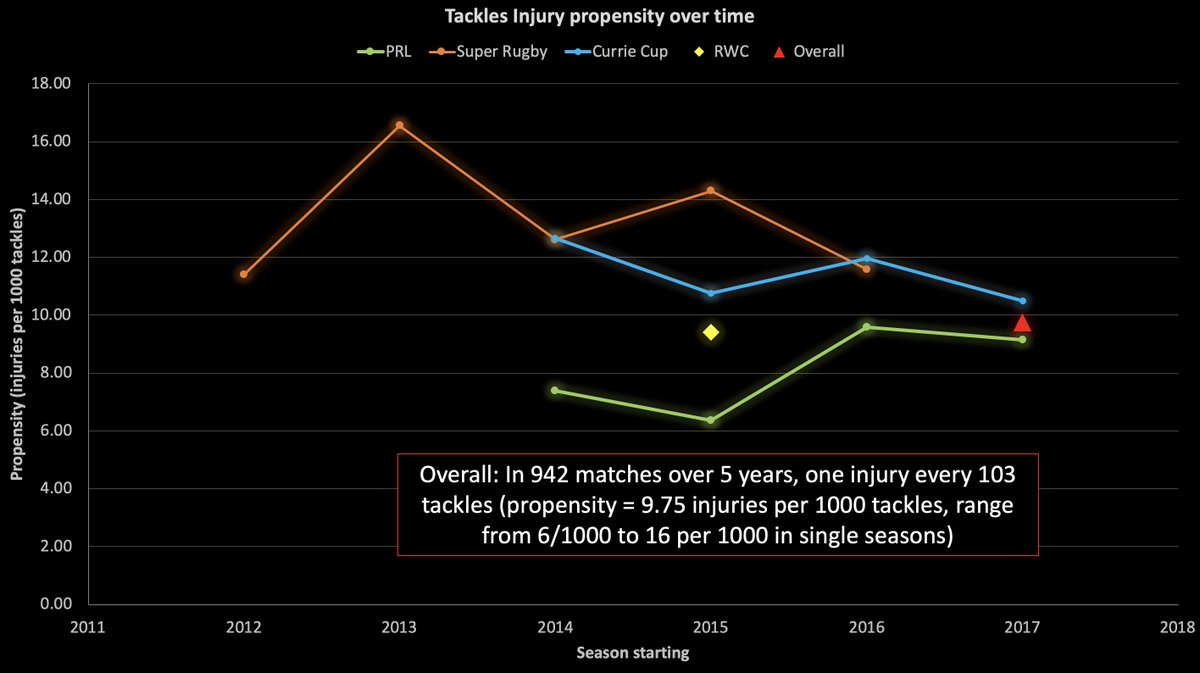
Let’s look at tackles specifically, and here we can track propensity over time in various comps. Remember that propensity is number of injuries per 1000 of that event (tackles). It’s a measure of inherent risk of that action. In 942 matches, we see an injury every 103 tackles.
The same for rucks here. We see an injury every 498 rucks, a propensity of 2.01 injuries per 1000 rucks. This varies by competition, and season, with a range from 1.3 (RWC 2015) to 3.6 per 1000 rucks (Super Rugby).

Now for scrums and mauls. You’ll see that they’re actually quite high in risk - one injury every 92 scrums (highest of all), and one injury every 131 mauls. Fortunately, they are RARE EVENTS, so the actual number of injuries they cause is low (see earlier slide of % of injuries)


We can now combine the “event risk” with “total injury number” to produce this graph, showing, in quadrants, which events have high inherent risk and which cause more injuries because they're more frequent. This influences “prioritisation” to some degree, in risk management (12/)

Next key factor is severity. Knowing injury number is only half the picture, it’s also crucial how bad the injury is.
Here is a graph from 3 years of SA’s Currie Cup (provided by @starling_linds), showing incidence (number) vs severity (days) for different events causing injury
Here is a graph from 3 years of SA’s Currie Cup (provided by @starling_linds), showing incidence (number) vs severity (days) for different events causing injury
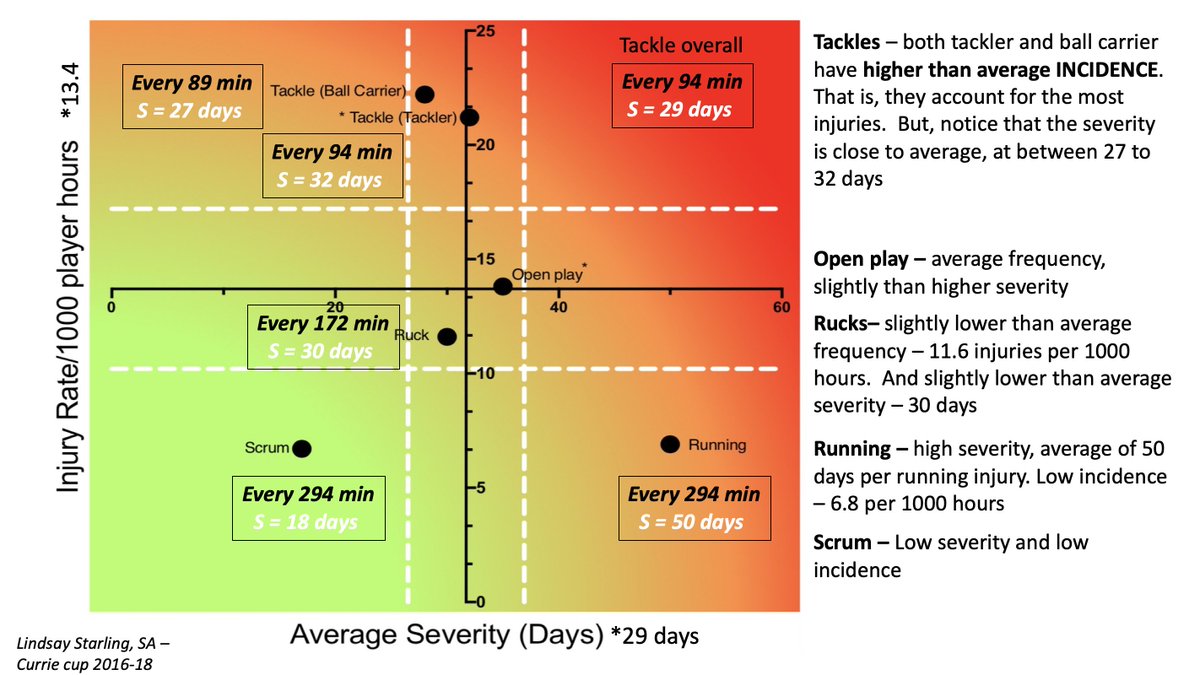
I’ve summarised the key points on the graph, but they bear repeating - running causes the most severe injuries, but they’re rare. Tackles cause average severity injuries, but are by far most common. Scrum injuries are, on average, milder, and also not common.

It’s the combination of the frequency of an injury (how many happen) and the severity of the injury (how many days it keeps a player out) that really matters, and this is the data for “injury burden” from the PRL over the last four years

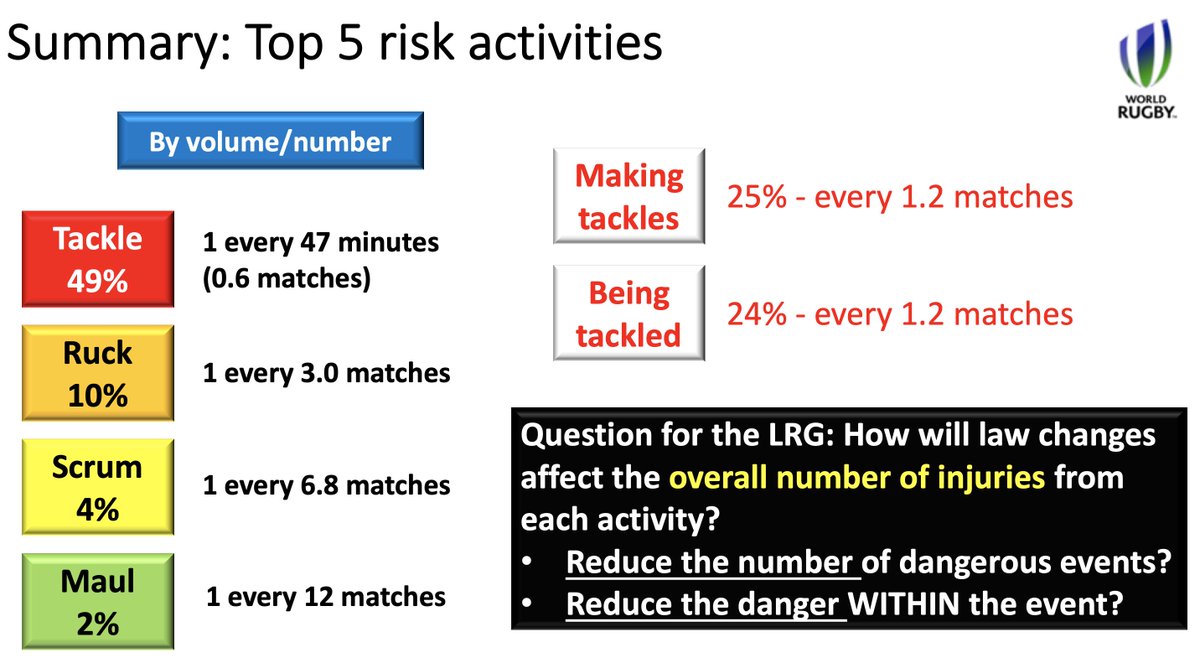
Here’s a summary of the risk activities, first by the “event specific risk”, then by the volume of injuries caused by the risk (because some events happen way more than others - tackles & rucks vs scrums & mauls, for example). Also, the Key Qs for law are shown (16/)

Now you know the injury activity picture, we can talk about how you prevent them. The basic premise is that you start by creating a spectrum of risk, identifying high vs low risk, your priorities etc. Then you try to do one of three things:
1. Eliminate
2. Substitute
3. Modify
1. Eliminate
2. Substitute
3. Modify

And basically, what Law has to do for player welfare is recognise how those three options interact. Can we eliminate the highest risk behaviour? Sometimes, yes. Others, no. Can we substitute behaviours, within a tackle, for instance? Can we modify risk with better technique etc
Can the law influence technique? I think it can, if you use the law to ‘incentivise’ coaches to recognise and correct what is unsafe. This is a key part of the concussion interventions that have been tried in the last few years. It began by recognising the risk factors in tackles
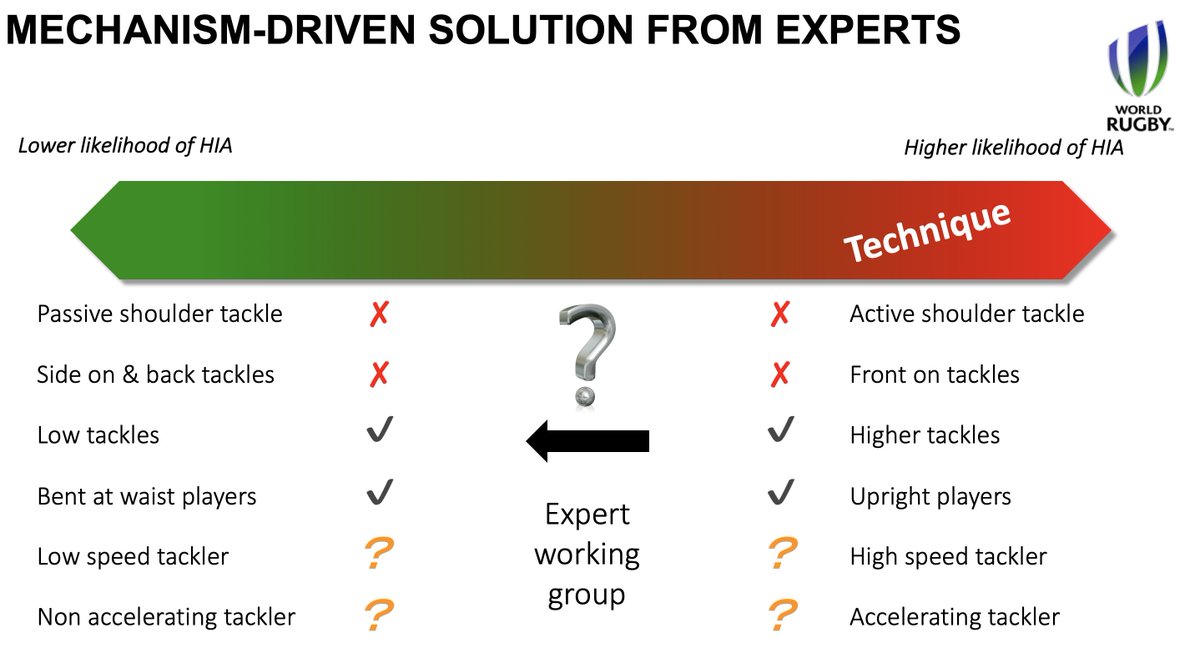
Then we asked coaches, players, referees, medics, which of those can be eliminated or substituted, & which can be modified? They guided what is now a three-phase approach to head injury prevention by suggesting combinations of law & technique awareness (through education & law!)

The three phases are shown below - Phase 1 was law application because we knew from the data that this would protect BOTH players. Phase 2 was a technique intervention, through law, to draw attention to high risk technique. Third is a lower height trial. All are ongoing.


An important consideration is to what extent can law prevent injury? Wish I knew. But for instance, if you take a tackle, at 1 injury every 103 tackles, it might be possible to halve risk to 1 in 206. More than this may be difficult. Rucks, at 1 in 498, however, might be simpler
For instance, at 2 injuries per 1000 rucks, in a typical professional season (135 matches, 190 rucks/match), we’d expect to see about 51 injuries at rucks. Cut this to 0.5 injuries per 1000 rucks, the “real effect” would be a drop from 51 injuries at rucks to 13. A ‘saving’ of 38
So a 75% drop in ruck risk ‘removes’ 38 injuries a season. In contrast, because tackles have a higher propensity (inherent risk) & make up a much higher % of injuries (49% vs 10% for rucks), you ‘only’ need a 17% reduction in TACKLE risk (1 in 103 to 1 in 119) to save 38 injuries
Where this gets challenging is that a 17% drop at tackles might be really difficult compared to a 50% (or more) at a ruck. So it’s an ‘art’ to figure out which ‘levers’ to try to pull for best overall effect. And we haven’t even touched on ‘unintended consequences’ of change!
Anyway, I won’t bore you with more thoughts & data. This was a little behind the scenes look at SOME data that informs decision making. This stuff is complex, inter-connected & far from straightforward! But I hope you understand why all that initial technical stuff matters (end)


