,
16 tweets,
7 min read
Read on Twitter
Last day with me @helenajambor on #sciviz #visualisations. Today to wrap up let's briefly discuss color and layout.
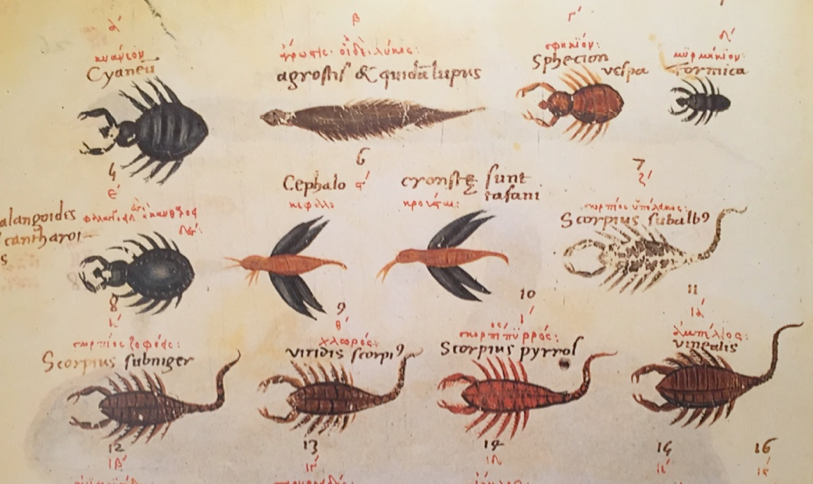
In 3 scenarios we use color. 1) to give a naturalistic representation in drawings and photos. But "natural" colors in charts quickly get awkward: it is frowned upon to use blue/boys, pink/girls color code. Also avoiding a certain color-code can be tricky, see Pew research example 

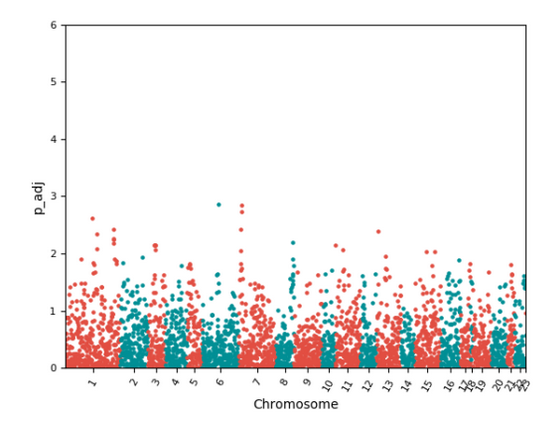
2) color encodes quantities. In a heat map cells are colored by value, in microscopy images false-colours show protein enrichments, in scatterplots saturation of dots in colored to show a third observation.
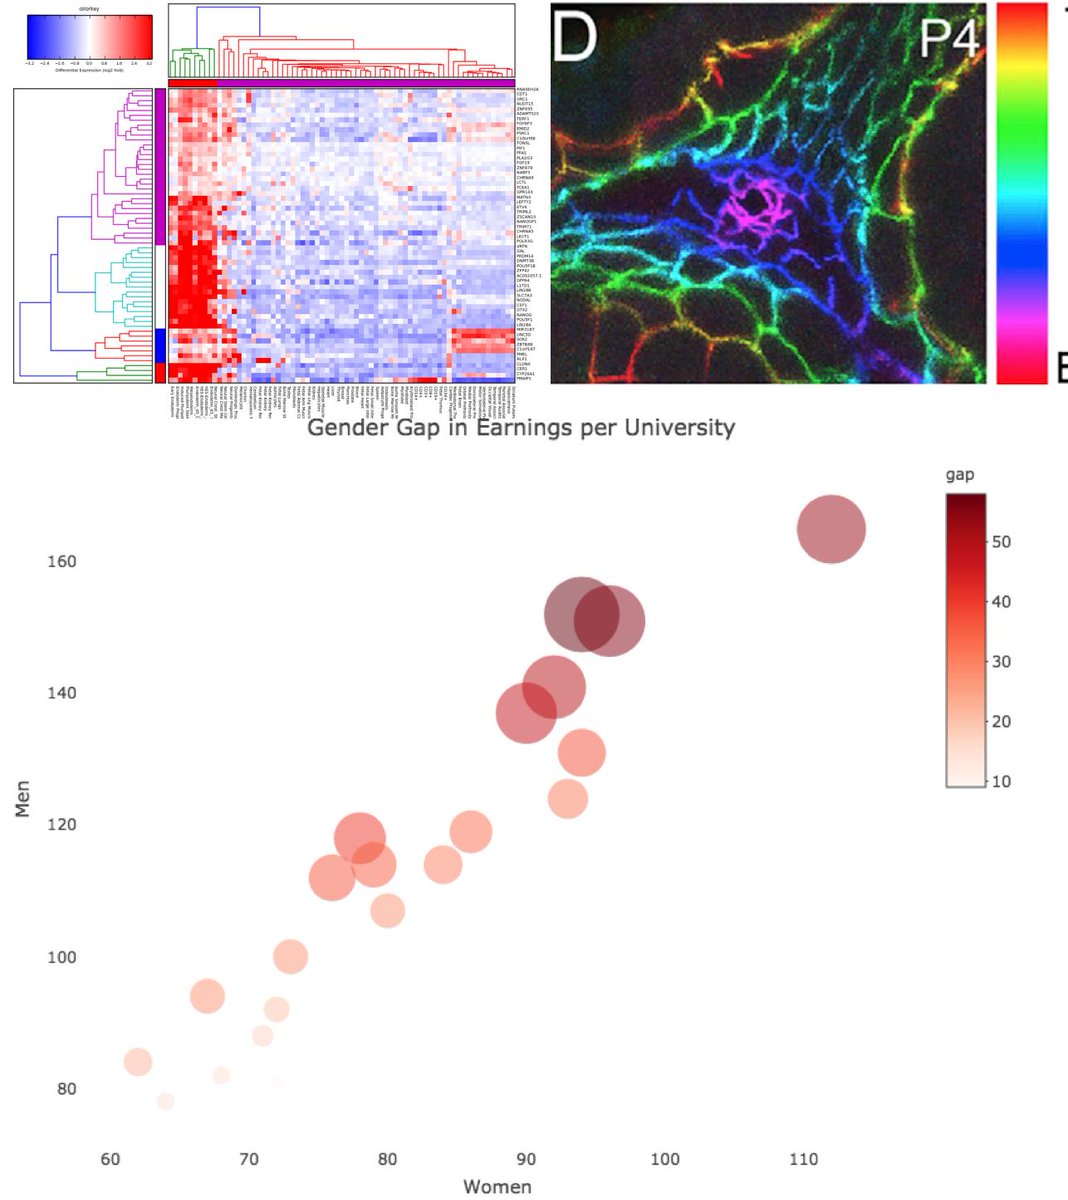
To encode quantities be sure to only vary the saturation (when values are along a common scale) or use a diverging scale for diverging values (above/below zero, e.g. gene expression compariosn, temperature..). Do not vary the COLOR (as done in the microscopy picture above).

3) we also may use color to encode categorical data. Here, we may happily vary the COLOR, not the saturation. But, always question if it really is necessary at all. e.g. in Bar charts the label can sufficiently inform about difference, it does not need varying colors!

A great resource for choosing color-codes is here, colorbrewer2.org. Simply decide if you have categorical, sequential or diverging data and how many different classes you need. Result comes as RGB/HEX/R values...
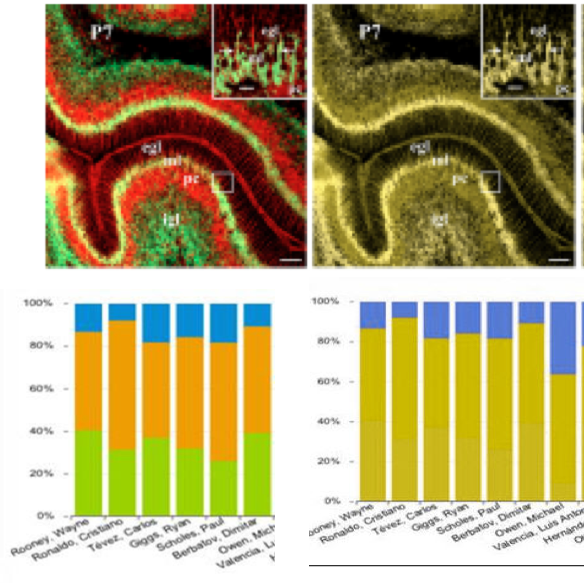
Always be sure to be color-blind safe. The below pictures show a stacked bar chart and a microscope as it appears to normal vision (LEFT) and a color-blind person (RIGHT). Install the desktop app @ColorOracle to test your visualizations!
Here is a fantastic detailed read-up on color-blind safe images: jfly.uni-koeln.de/color/ and I wrote about it here helenajambor.wordpress.com/2017/04/27/col…
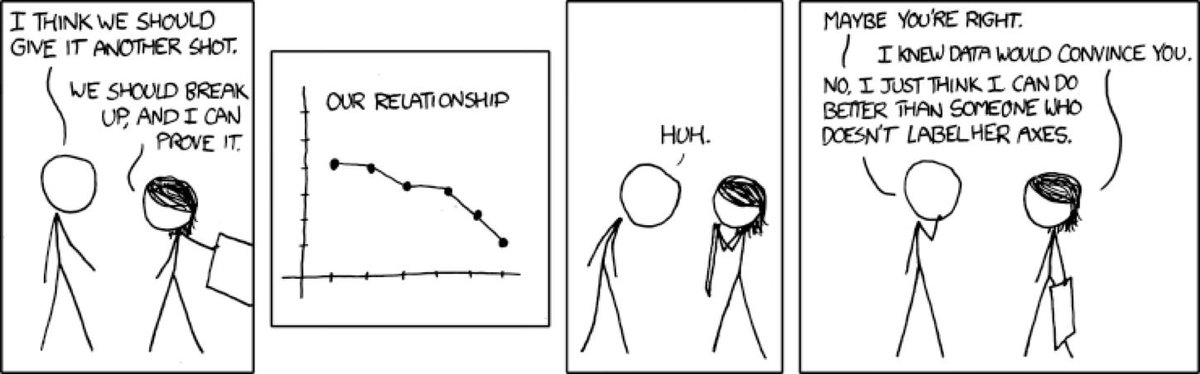
Finally layout. Layout may be the arrangement within a chart: that data is on the correct axes;
A great place to train axis labeling: mathbench.umd.edu/modules/visual…
A great place to train axis labeling: mathbench.umd.edu/modules/visual…
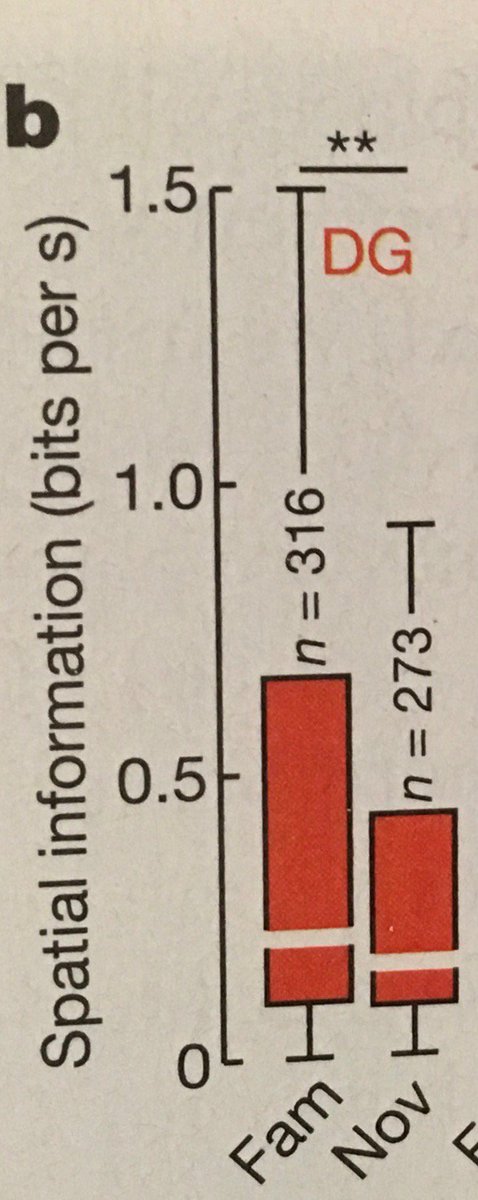
Layout is also the design of x- and y-axis length. For Bar charts, the axis needs to start a zero, everything else is misleading:

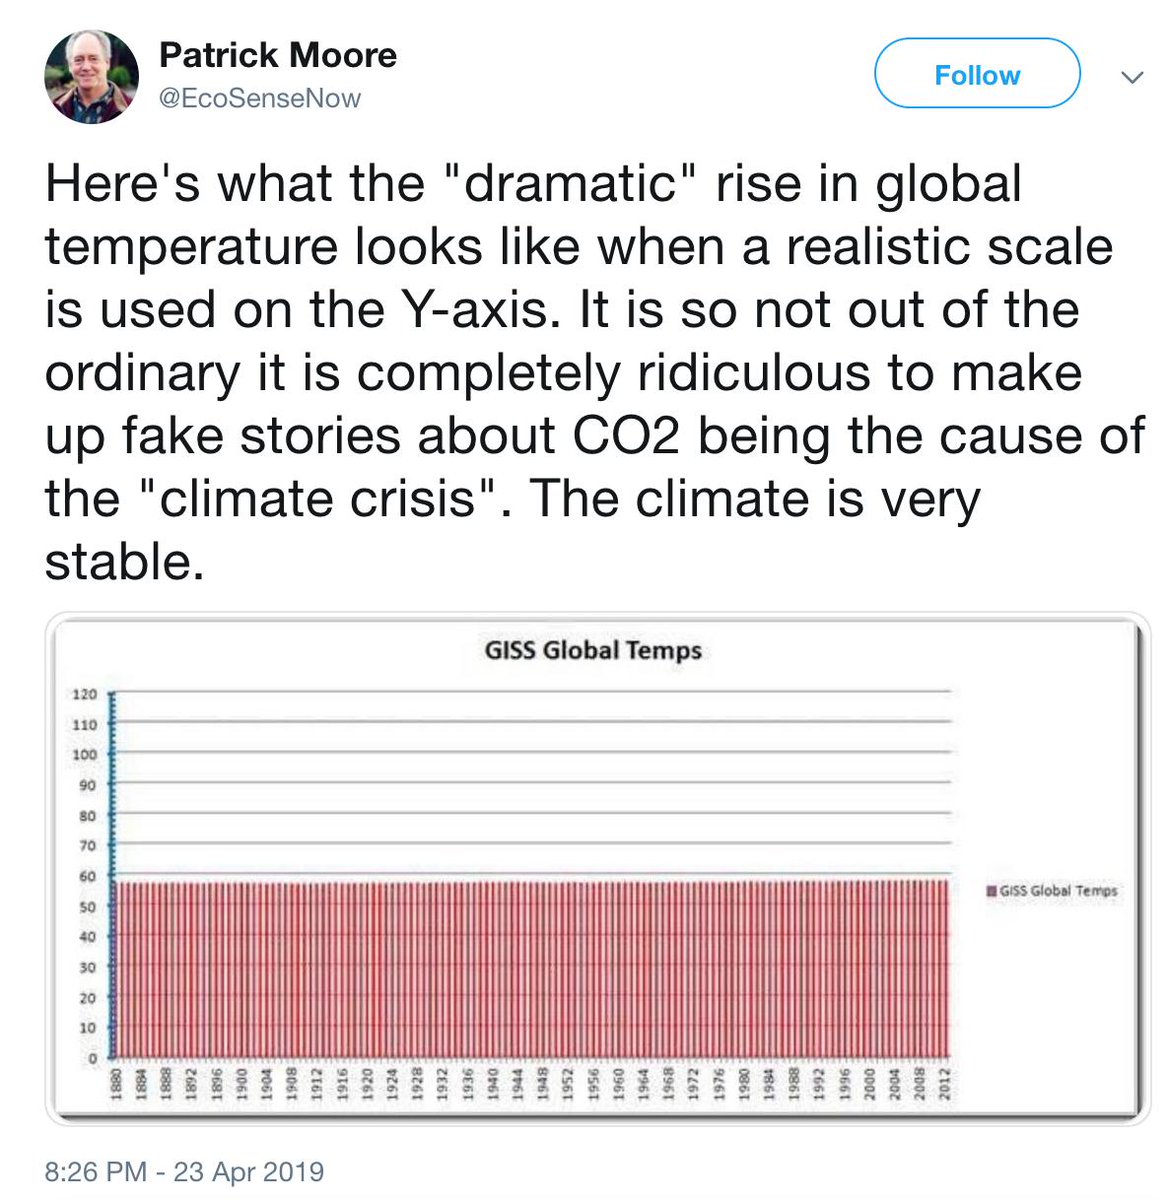
But for line charts, the aboslute zero point is in fact dispensable.
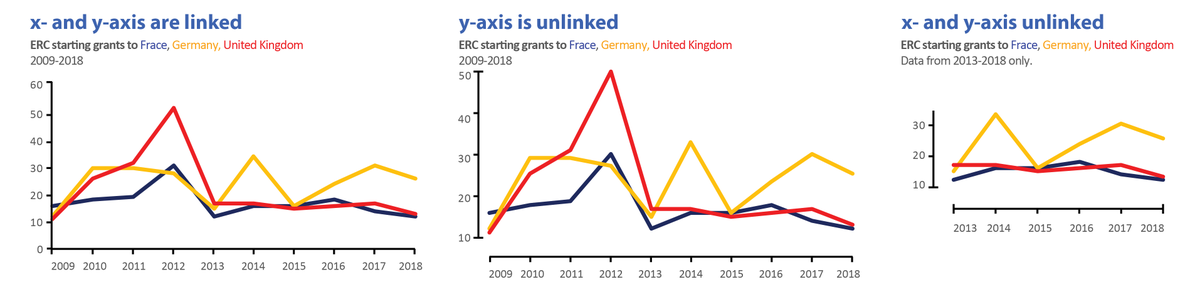
For line charts including zero may be misleading, see the example below that shows us the global temperature from 0-120C.... {more on non-zero baselines: helenajambor.wordpress.com/2019/06/19/non…}
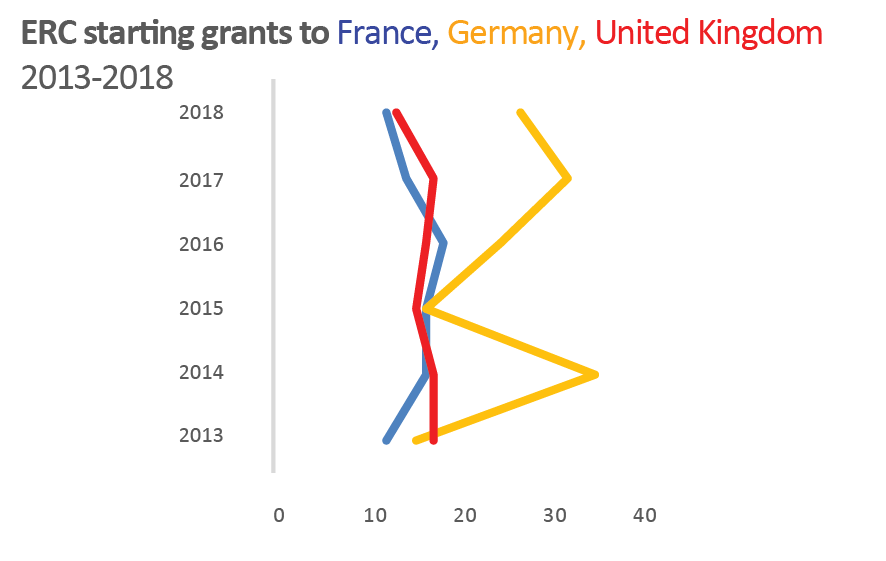
But layout is also being careful with axis-breaks, here is example where the break is well-indicated, but not necessary:

While this, be careful: it looks like an axis break and in fact is.... what?
Layout is also organising stuff within a figure/slide/poster: this means, decide on a READING DIRECTION! Two possibilities exist, please be consistent, and ideally do not vary this in the entire paper.

And always stick to "the grid", the holy grail of all design. Think of filling the page with a grid, and never violate the borders of each of the cells. {I think I found this illusyration of possible grid layouts in a lecture by the Babraham Institue Cambridge}