
,
17 tweets,
6 min read
Read on Twitter
With heartiest gratitude for all the good work done by @sanstocktrader, @Stockengg & @Pathik_Trader, I want to contribute something from myside too to fellow traders who are trading the concepts tought on the webinar on 21st. In first part, I am sharing 2 AFL scanners for (1/n)
2 out of 3 setups shared by @Stockengg Dimesh. These are FP+1 & NR4+IB. Going ahead, I will share further scanners on other strategies too which can be coded.
Lets come on first AFL, FP+1- here is the link of the explorer. (2/n)
#from_swing_ka_sultan
drive.google.com/file/d/11czZtU…
Lets come on first AFL, FP+1- here is the link of the explorer. (2/n)
#from_swing_ka_sultan
drive.google.com/file/d/11czZtU…
This has been applied on F&O stocks. Basically here we are looking for fakeouts, hence as per FP+1, we'll look for a fakeout of resistance hence short entries will be taken in that case. On the other hand, long entries will be taken where fakeout of support happens. (3/n) 

As this is a reversal setup, I'll advice you that if you wanna trade this, you should learn it properly first. You'll get this webinar from @Stockengg for that.
Now coming on explorer, first column is stock names, second mentions stocks breaks in which direction. We've to (4/n)
Now coming on explorer, first column is stock names, second mentions stocks breaks in which direction. We've to (4/n)
take trade on opposite direction of breakout in case of failure, hence same is mentioned in 3rd Column so no confusion should be occur. 4th column is Entry price as per FP+1, which is previous 20 Day High/Low. Afterwards you'll see the recent closing price & change %. (5/n)
Here I had taken care of previous 20 period high/low happening atleast 3 bar earlier, so you need not to worry about anything else.
Now, I'm sharing few thoughts on FP+1. When a breakout happens, either of 2 things can happen- either prices will be accepted above breakout (6/n)
Now, I'm sharing few thoughts on FP+1. When a breakout happens, either of 2 things can happen- either prices will be accepted above breakout (6/n)
or rejected from that zone. It is a decision point, where market has to take a decision. When price are expected, you should get an entry after breakout in the direction of BO. But the more powerful setup is BO Failure, the rejection. Rejections are powerful at it hurts! 😉 (7/n)
FP+1 is a strategy to in cash this rejection. Often the move after rejection is sharp & powerful hence changes of gaining is high in this strategy.
I love to read Price Action at BO level. If we mix candlesticks & supply demand zone, we'll make a killing out of it by.. (8/n)
I love to read Price Action at BO level. If we mix candlesticks & supply demand zone, we'll make a killing out of it by.. (8/n)
reducing whipsaws. If you see big wicks in direction of BO, this signals rejection. If the retracement comes with momentum candles, engulfing or dark cloud cover, the setup becomes super powerful. Over this, if there is an opposite demand or supply zone above breakout level, 9/n
it makes the rejection significant. All in all, such trades shouldn't be missed.
Now, I am sharing other scanner, NR4+IB. Here is the link of it & the screenshot-
drive.google.com/file/d/11gQy4Q…
Now, I am sharing other scanner, NR4+IB. Here is the link of it & the screenshot-
drive.google.com/file/d/11gQy4Q…
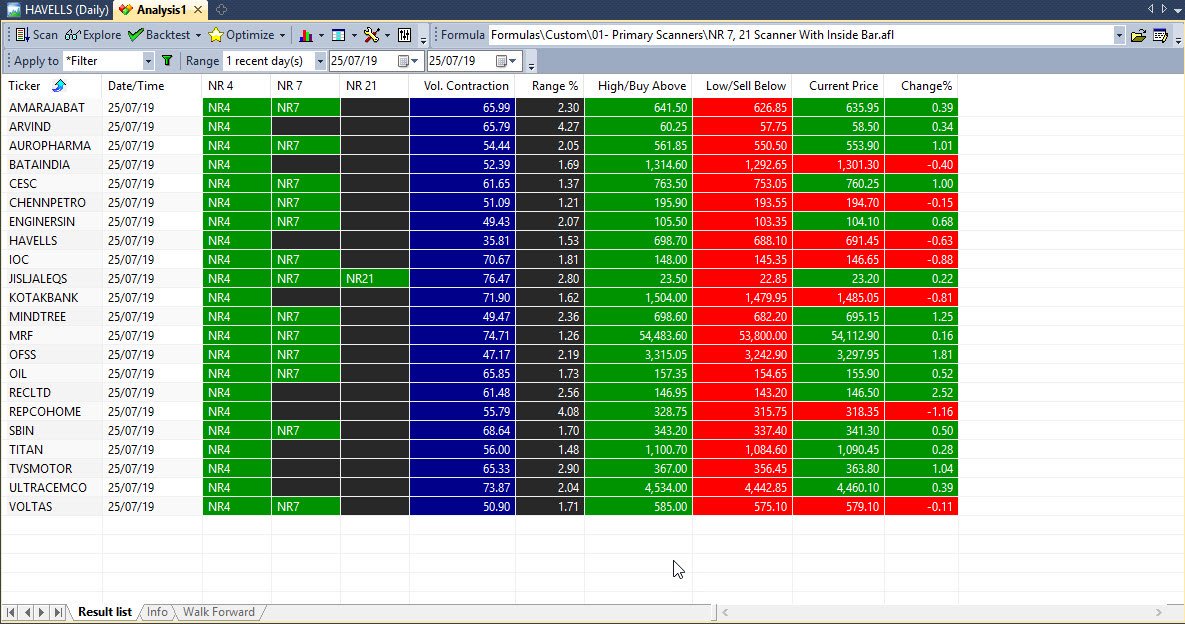
This is again applied on F&O stocks in screenshot. Here you can see, this filters out all stocks making NR4 & IB, but if you want to trade those which should be NR7 or NR21, I added additional column. If a stock is NR7 too along with NR4 & IB, you'll find it written there (11/n)
in column 4 & 5. Apart from that, it automatically calculates the volatility contraction compared to previous candle, hence you need not to feed any data in excel sheet to calculate the same. Just a click & Bingo...
Range% shows the width in % terms of NR candle, and also (12/n)
Range% shows the width in % terms of NR candle, and also (12/n)
how deep your stoploss will be. Stock which had deep stoploss is simply avoidable as you can see few stocks have 4% sort of range.
Further there are two columns, Buy Above & Sell Below. These are levels where you should put your buy orders. When it fills one side, second (13/n)
Further there are two columns, Buy Above & Sell Below. These are levels where you should put your buy orders. When it fills one side, second (13/n)
will be used as stoploss i.e. if long order gets filled, the sell below level will be used at stoploss. Further, you should use it for re-entry too on opposite side.
Apart from scanning, if you drag it on a price chart, it will show arrows on candles which are NR7 (14/n).
Apart from scanning, if you drag it on a price chart, it will show arrows on candles which are NR7 (14/n).
or 21 with IB.
As I said, I'll share further explorers on setup shared by @Stockengg team. I believe this will be helpful for everyone by reducing their homework.
One more announcement, everyday I get several requests for my "Close to EMA" plotter. That plotter has been (15/n)
As I said, I'll share further explorers on setup shared by @Stockengg team. I believe this will be helpful for everyone by reducing their homework.
One more announcement, everyday I get several requests for my "Close to EMA" plotter. That plotter has been (15/n)
removed from access, as its new version "The In-Swing Indicator" is created as per suggestion by @Zafargs79 bhai. The indicator is extremely powerful & giving awesome results. It was promised by me to be shared with you, but the delay is happening on my part as I want to (16/n)
back it with enough charts & data. Over that, if we mix In-Swing Indicator with FP+1, it will further enhance the success rate. I'll share it very soon for everyone's benefit.
I request that this thread should be shared further for everyone's benefit. (17/17)
@CAtLarge
I request that this thread should be shared further for everyone's benefit. (17/17)
@CAtLarge


