If you'd like to hear the whole story as to how we got from the movie on the left to the movie on the right, come join me for a "tweetorial" starting now!
First - the problem: We love our point scanning imaging systems. They are versatile and can get amazing resolution. But if you want to max out your resolution, you better have a boatload of patience, and nearly invincible samples. Unfortunately, I rarely have either.
On the left is an 8nm low resolution acquisition and on the right is a 2nm high resolution acquisition with the same pixel dwell time. While the image on the right is much nicer, it also takes 16x longer to acquire. Imaging an entire brain like that would take >100 years.
But that isn't the only problem. I also mentioned that your samples better be damn near invincible too. That's because higher resolution equals higher doses. In EM this means literally melting your sample. In fluorescence it means bleaching and phototoxicity.
For most of our 3DEM work, we use a serial blockface SEM system, which works a lot like this noodle-making machine here, except we capture an image of the top of the tissue blockface each time we slice off another layer
This system is amazing: semi-automated and requires minimal alignment of individual 2D images for 3D stacks. But if we want to image with 2nm pixels (and we do!), the eV dose can be too high for many samples, which melts the blockface and renders it too soft for reliable cutting.
What you're seeing in this video is that if we image at 8nm pixel resolution, we can reliably cut and image. But if we image at 2nm resolution, while the images initially look much nicer, the blockface melts and we get wacked out cutting and therefore wacked out images. No 3D :(
As mentioned above we have a similar problem for fluorescence imaging. If you want to image at max resolution, you're also going to need max photon dose, which really pisses off the cells. Here's an example of mitochondria swelling and fragmenting in response to high res imaging.
We also have to worry about photobleaching, which is the phenomenon where fluorescent markers run out of photons over time. Reminder: Higher res = higher laser dose = more bleaching. Lower res imaging minimizes bleaching. See how only the high res image disappears over time.
Of course, you'll also notice that while the low res image doesn't bleach, it also don't provide as much information. Who cares if you can watch it forever if there's hardly anything to watch?
All of these cases can be summarized by the "triangle of compromise", the bane of every imaging scientist's existence. 

It also happens to be the bane of photographer's existences too! And it just so happens I'm also a photographer. So I read photography blogs. Like @petapixel. And it was on PetaPixel that I first got the "big idea". Here's the article that started it all. petapixel.com/2017/10/31/web…
Of course it doesn't hurt that I also happen to be a ginormous Bladerunner fan.
Long story short - this article was about how people were using deep learning to increase the pixel resolution of photos. I'd already explored DL for *segmentation*, but this was much more exciting!
Long story short - this article was about how people were using deep learning to increase the pixel resolution of photos. I'd already explored DL for *segmentation*, but this was much more exciting!
So anyway, this got me wondering whether we could use DL to upsample low resolution images acquired on our point scanning microscopes, thereby allowing us to acquire fewer pixels, and all the advantages that would provide e.g. higher speed, lower sample damage, smaller files etc
Here is my favorite part of these tweetorials - I'm going to show you data we didn't put in our paper! To survive peer review, papers need to be concise, clear, and devoid of dead end distractions. But sometimes that means they're less interesting and you don't show *everything*.
So here's an exciting tidbit that maybe only you tweetorial attendees will know: We actually began our efforts using multi-color (i.e. RGB) images with a GAN. Specifically, the same tensorflow-based SRGAN used for letsenhance.io. Here's the paper
arxiv.org/abs/1609.04802
arxiv.org/abs/1609.04802
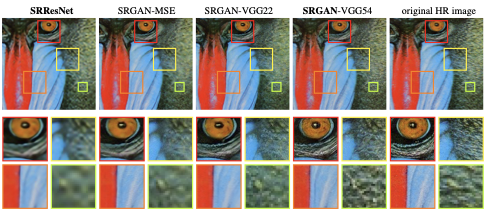
So we started with 3-channel Airyscan images of hippocampal neurons. Specifically, we simply digitally downsampled our high res images 16x and trained on high vs low res images, then tested on a separate set of images. I was quite pleased with the results!

It also worked fairly well for single channel images of mitochondria in fixed cells. Note that the low res image is a digitally downsampled version of the high res image.

But here's where it fell apart - when we *manually* acquired low res images that had the same pixel dwell time as the high res acquisitions, the low res images were much noisier, and the SRGAN model completely failed. Note that we did train with noisy low res acquisitions too.

We thought we might just need more real world training data, but generating real-world training data is extremely laborious - not only do you need to acquire at least two images at high and low res, but you also need to make sure they're perfectly aligned in x, y, and z!
One idea I had was to try to better simulate our real world low res data by adding poisson and gaussian noise during the downsampling step we used for generating semi-synthetic training pairs.
Another idea I was excited about was to use low vs high res acquisitions to train a model to generate low res data. Finally, at around the same time, the CARE preprint came out. So we also considered denoising our low res images before SRGAN'ing them. biorxiv.org/content/10.110…
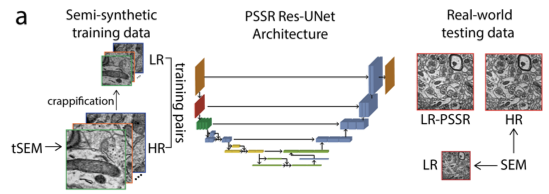
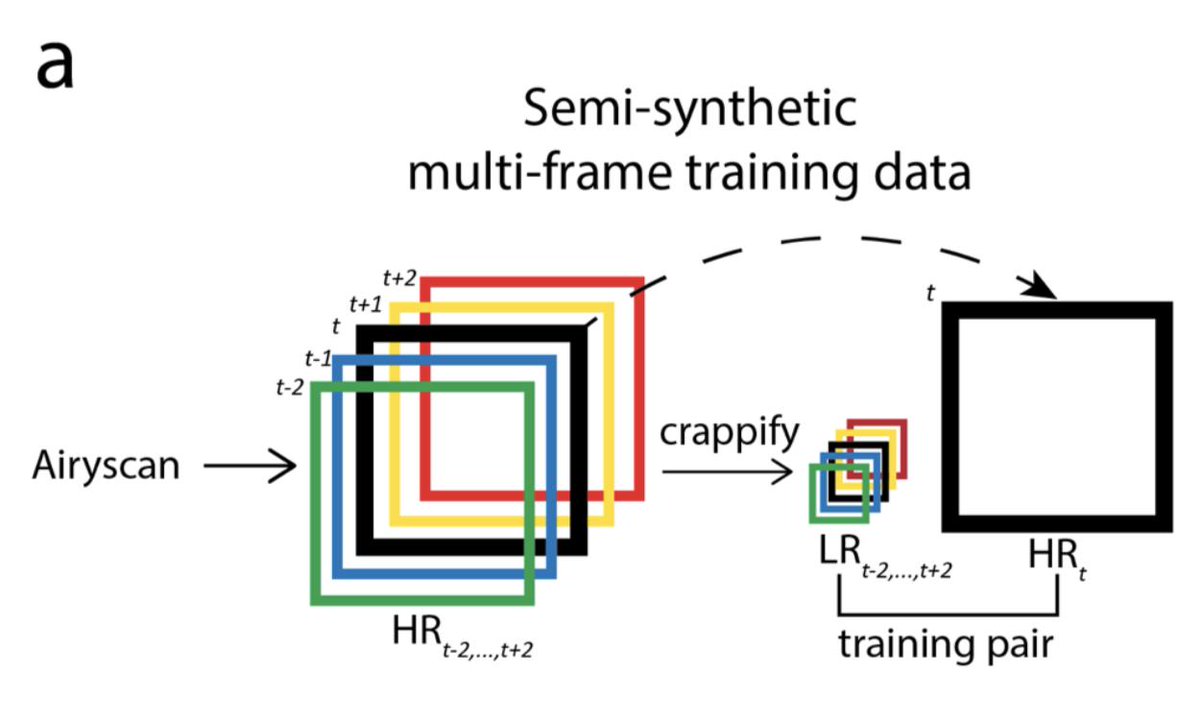
But then around the same time @jeremyphoward and Fred Monroe @313V made a fateful visit to my lab @salkinstitute. With their help, we quickly incorporated (1) UNets and (2) the CRAPPIFIERRRRRRRR. These are both illustrated in Fig. 1A of our paper (doi.org/10.1101/740548)
It turns out UNets are quite fantastic at removing noise (just look at the great denoising results from the CARE paper).
The crappifier simply adds noise while downsampling the training data. The tSEM training data was acquired by Kristin Harris's group, and we had a LOT.
The crappifier simply adds noise while downsampling the training data. The tSEM training data was acquired by Kristin Harris's group, and we had a LOT.
With Zhao Zhang's help at @TACC, we set up on the TACC server and let it burn through the training data. We compared a few different loss functions and decided the MSE (L2) loss gave the best results. Our initial results looked only at semi-synthetic testing data (Fig 1B).
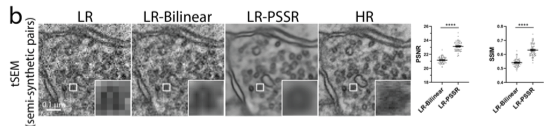
So next we tested real world data, i.e. low res images actually acquire on our own scope. We weren't in tSEM mode like the Harris lab - we used SEM with a BSD, and acquired images at low and high res for comparison and quantification. The results were delightful!

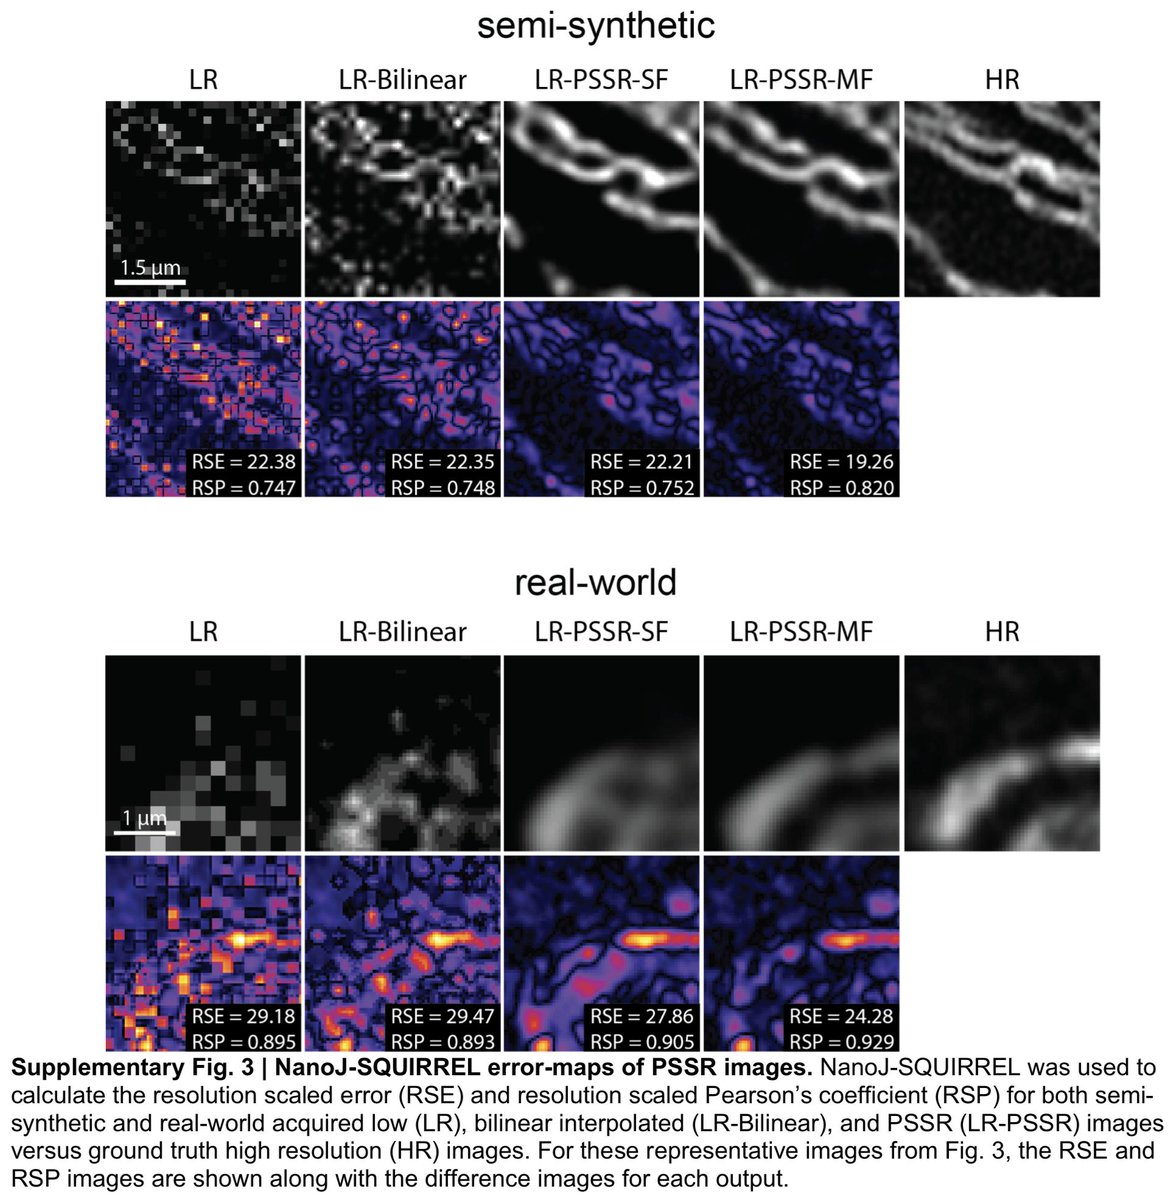
We used standard image quality metrics such as PSNR and SSIM. We also incorporated a couple more methods made easily available by the absolutely fantastic NanoJ-SQUIRREL plugin (doi.org/10.1038/nmeth.…) created by @SuperResoluSian in the @HenriquesLab: FRC and error-mapping.
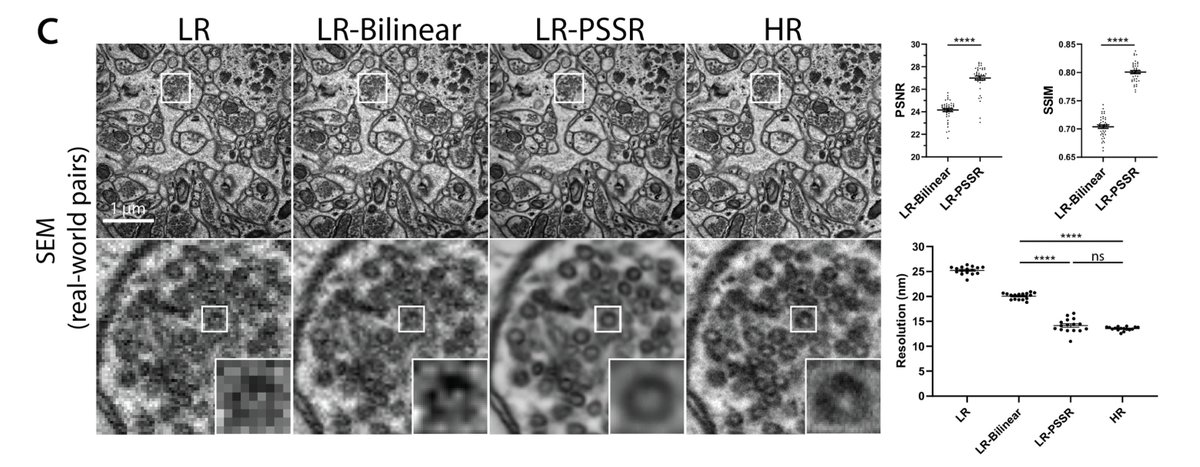
FRC requires the acquisition of at least two images of the same view, which is tricky due not only to drift, but also because high res EM imaging causes samples to warp! But we managed to get it to work using NanoJ-SQUIRREL alignment! The error-mapping provided nice visualization

Think there's a subtle but exciting point here: Our real-world testing data (BSD SEM) is a different imaging modality than our training data (transmission-mode SEM: doi.org/10.1371/journa…), which also happened to be semi-synthetic. But it still works!
So we checked to see if PSSR works on other samples from other labs imaging on totally different scopes? YES! Great data from 8-10nm FIB-SEM images (we just "bilinear-ed" the 10nm to 8nm before PSSR), and ssSEM data. Samples ranged from mouse, rat, to fly. NO ADDITIONAL TRAINING!

Importantly, to bring us full circle - we can now acquire serial blockface SEM datasets with 8nm pixels and restore them to 2nm pixel resolution! I always wanted to be able to see vesicles at synapses in our 3View data, and now finally we can.
But again - I cannot overemphasize how excited I am that it also works on others' data. Just look at this gorgeous FIB-SEM dataset from the Hess lab @HHMIJanelia.
One future direction will focus on segmentation of PSSR output. Since it removes noise and provides higher res, our *subjective* experience is the output provided the easiest segmentation ever. Will be very interesting to see how PSSR does with @stardazed0 FFNs!
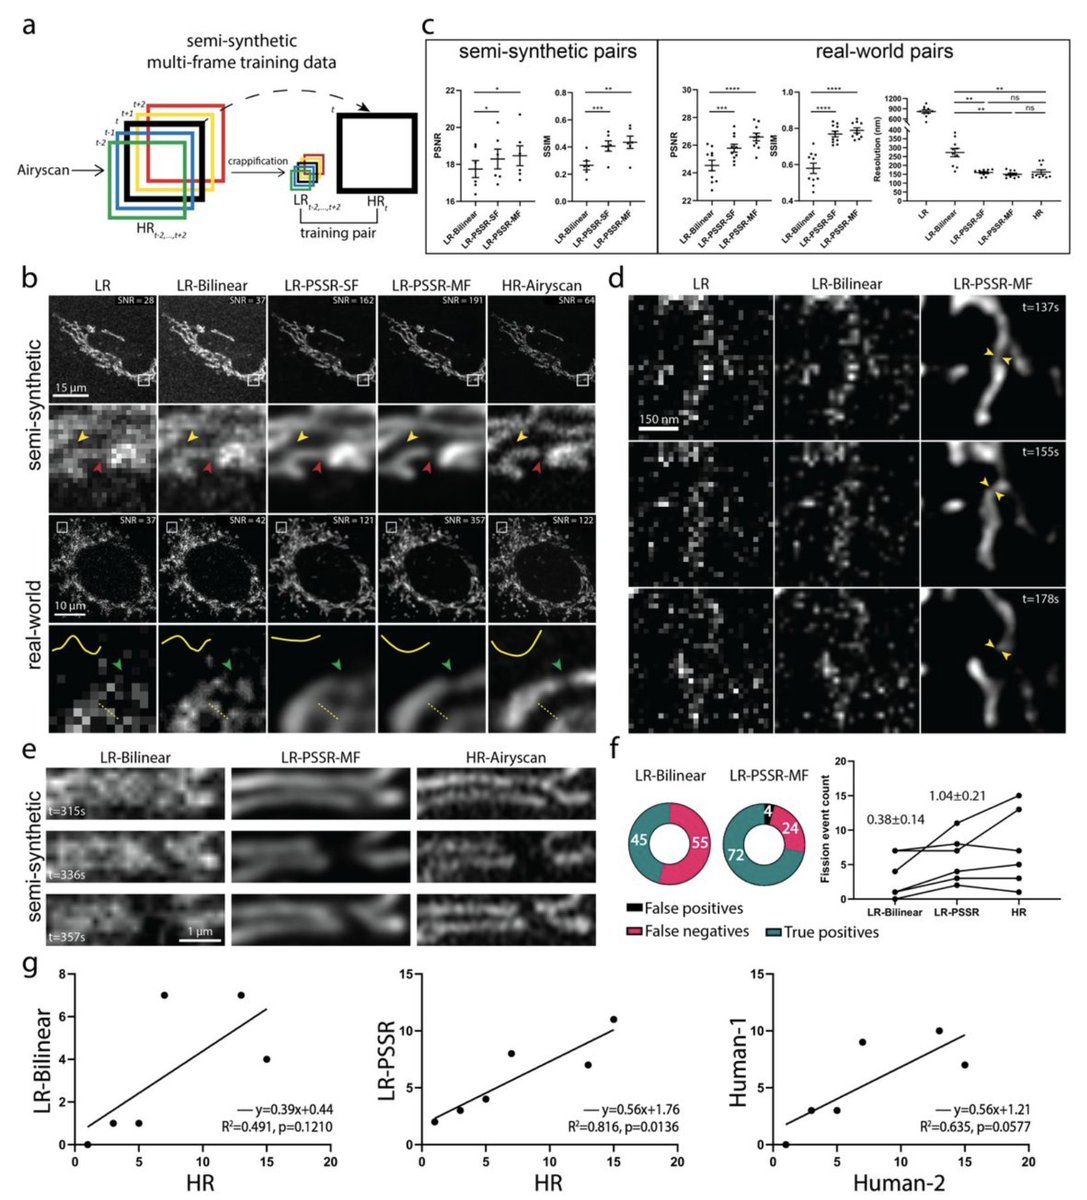
Ok so this is exciting. But how do we know we can trust it? We've got our pixel-wise metrics, but what about real biological structures? For validation, we decided to focus on presynaptic vesicles, which are (1) important and (2) hard to see at 8nm res. Example from Fig. 1.

So we randomly distributed ground truth vs PSSR vs bilinear images of presynaptic boutons to two EM experts with lots of experience ID'ing presynaptic vesicles. PSSR output had FAR fewer false negatives and slightly more false positives.

A couple things I want to say about our error measurements here:
1) I'm not certain all our false positives are false. As mentioned above, our ground truth data is BSD SEM, which isn't as good as tSEM. So it is possible our model can better resolve data than our ground truth data
1) I'm not certain all our false positives are false. As mentioned above, our ground truth data is BSD SEM, which isn't as good as tSEM. So it is possible our model can better resolve data than our ground truth data
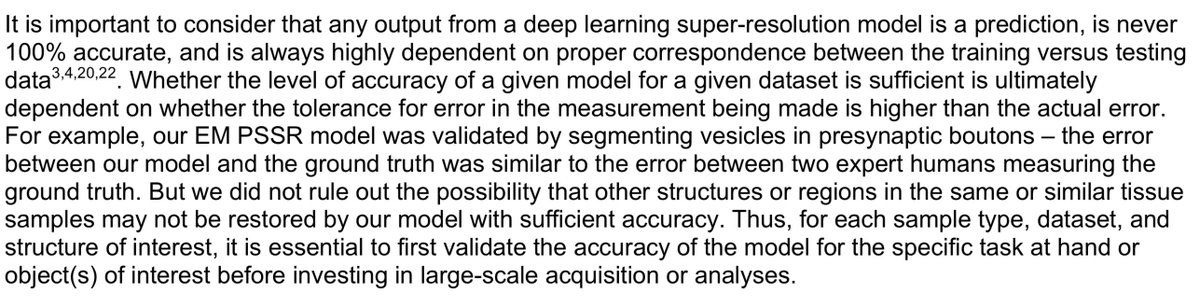
2) We focused on presynaptic vesicles for our validation for the reasons I stated above. It is entirely possible that other structures will not perform as well (or could perform better!). So if you want to use our model for a different structure, make sure to validate first!
3) At least for presynaptic vesicles, the error between our model and ground truth data was very similar to the error between two humans looking at the ground truth data. That's pretty darn tootin' good if you ask me!

So now I'm gonna switch our attention back to the fluorescence data. The main advantages of undersampling are increased speeds and decreased doses, and those advantages are most important for live imaging problems, so that is where we focused. In particular, mitochondria.
Why mitochondria? First of all, they're just freaking awesome and fascinating. As it so happens, we also do more biologically relevant mitochondria imaging research as well (shameless plug for my thread on our other preprint here: ).
Most importantly, mitochondrial fission is a stress response, and imaging causes stress, so this is a great example of an area that would really benefit from improved imaging capabilities. Mitochondria in neurons also happen to move really fast, so speed is also crucial here.
I showed it before but will show it again here - if you image mitochondria at high resolution for too long, they will swell and fragment. That's....kind of a problem if you're trying to study non-stress-related mitochondrial fission!
Similarly, imaging at high res is much slower for larger FOVs. To measure mitochondrial movement along an axon, we need a large FOV and speed. On the high res left mitos "hop", because they've moved in between frames. But on the low res right we can't resolve nearby mitos.
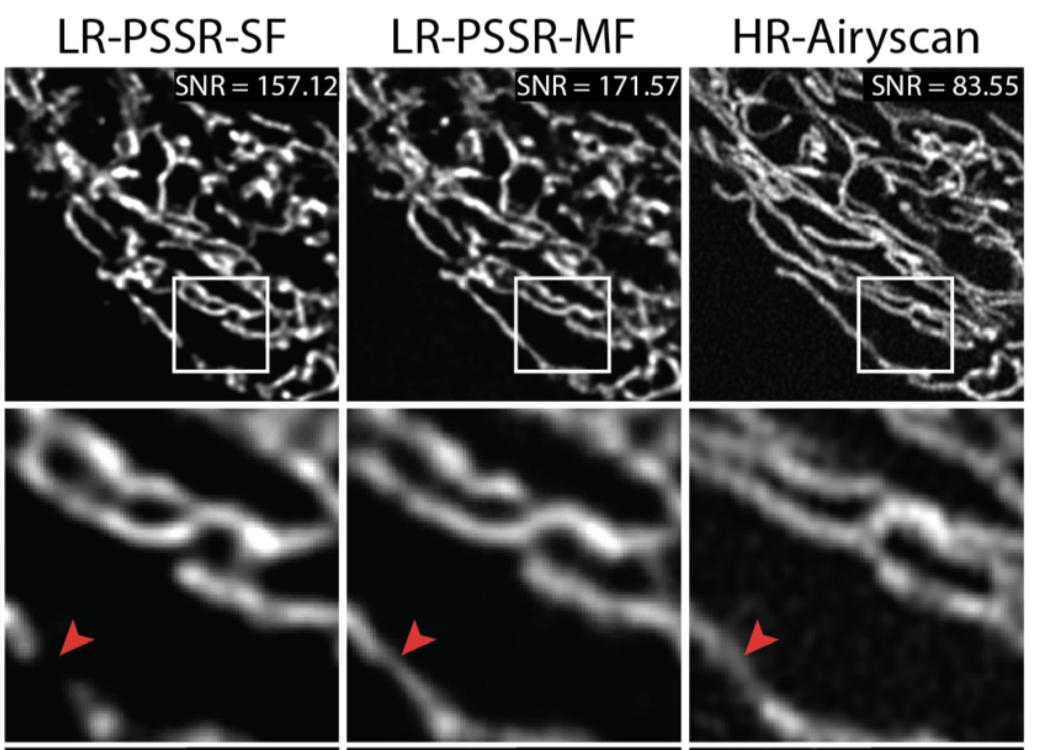
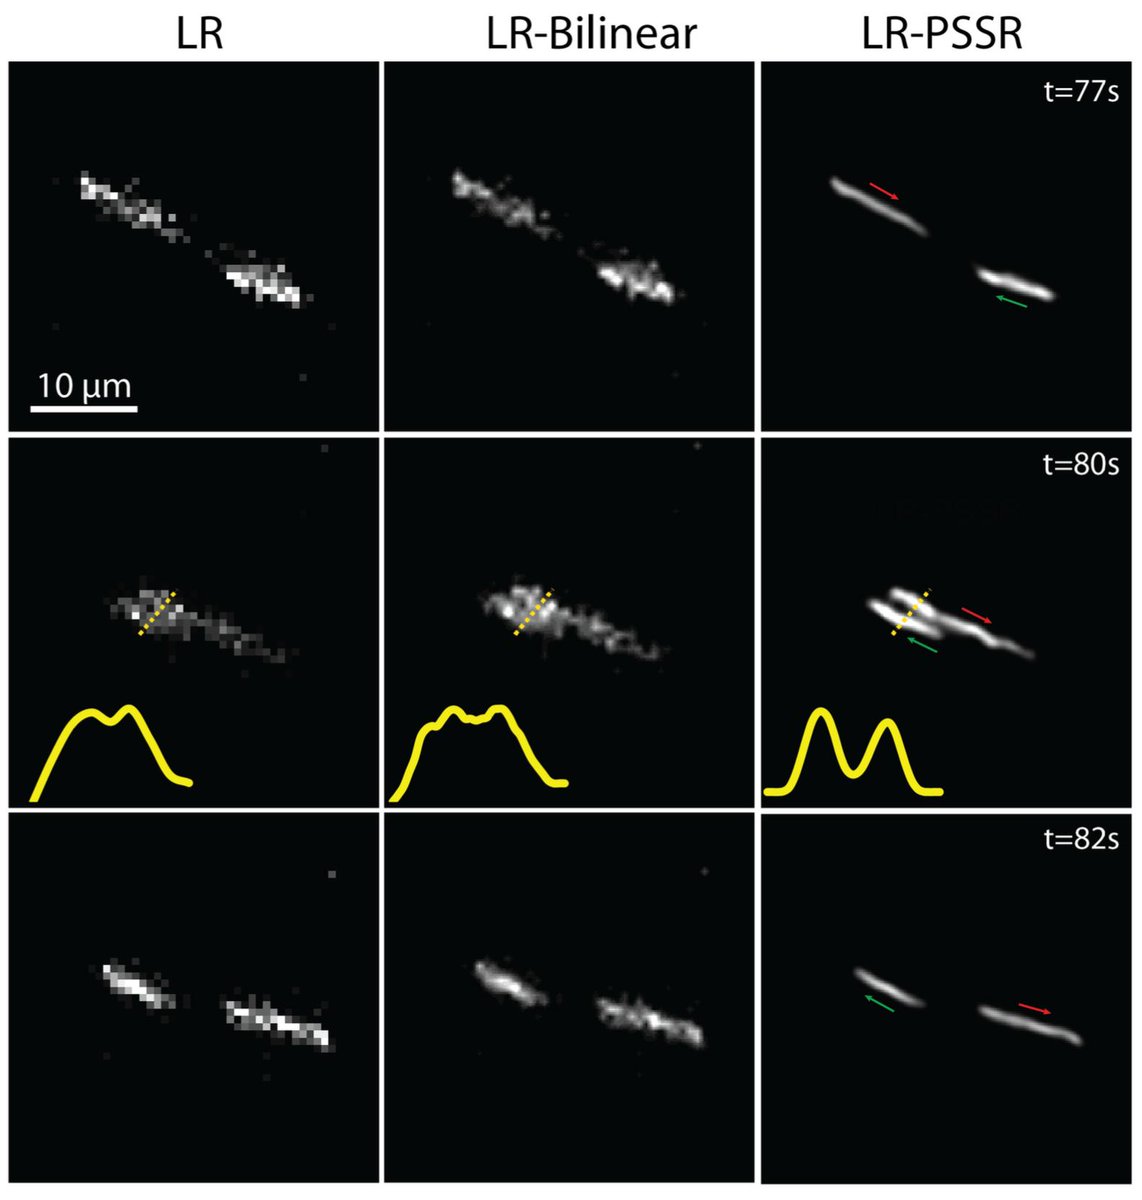
So we applied the same strategy for our fluorescence data. Once again, the results were pretty good! These are comparisons between low res input vs bilinear vs PSSR output. The "SF" LR-PSSR-SF indicates "single frame", MF is "multiframe". PSNR/SSIM/error-map/FRC were great too!
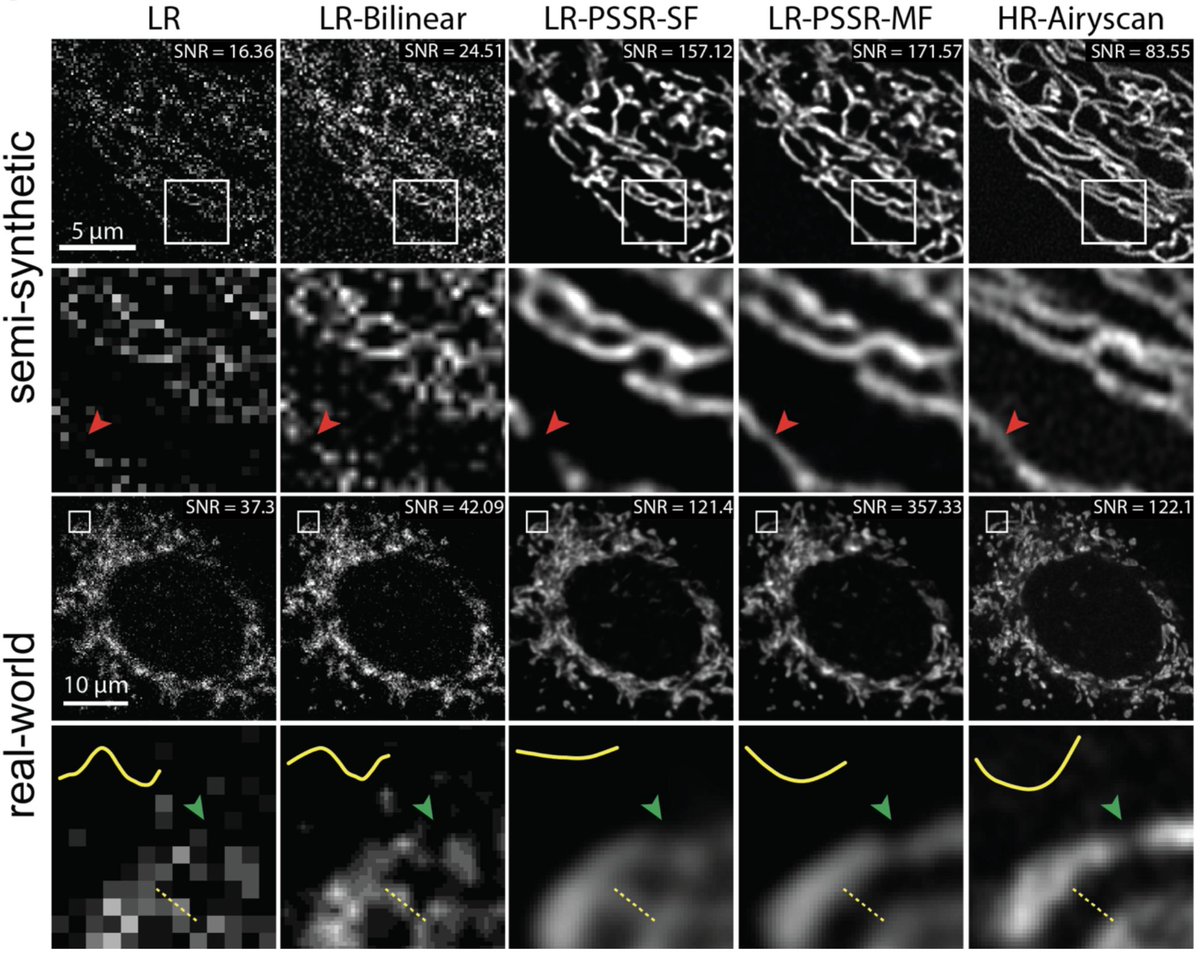


What is MF anyway? Fred @313V cooked up the idea of using multiple adjacent frames from our timelapses to train each individual frame. The result is fewer "clipped" structures AND higher resolution (unlike a rolling average which would remove clipping but also reduce resolution).
Using this new trained model, we were able to generate the gorgeous movie I showed at the top of this thread. I slowed the movie down during the fission event so you can see it more clearly.
Importantly, this means we can now image mitochondrial dynamics without bleaching or phototoxicity. Or least we can be sure there is much, much less. That's reflected in the fluorescence intensity curve you see here comparing HR vs LR (and LR-PSSR) timelapses.

NOTE: For our real-world pairs the LR vs HR images differ in more ways than just 16x undersampling!
1) Laser in LR was reduced 5x (so total laser=90x lower)
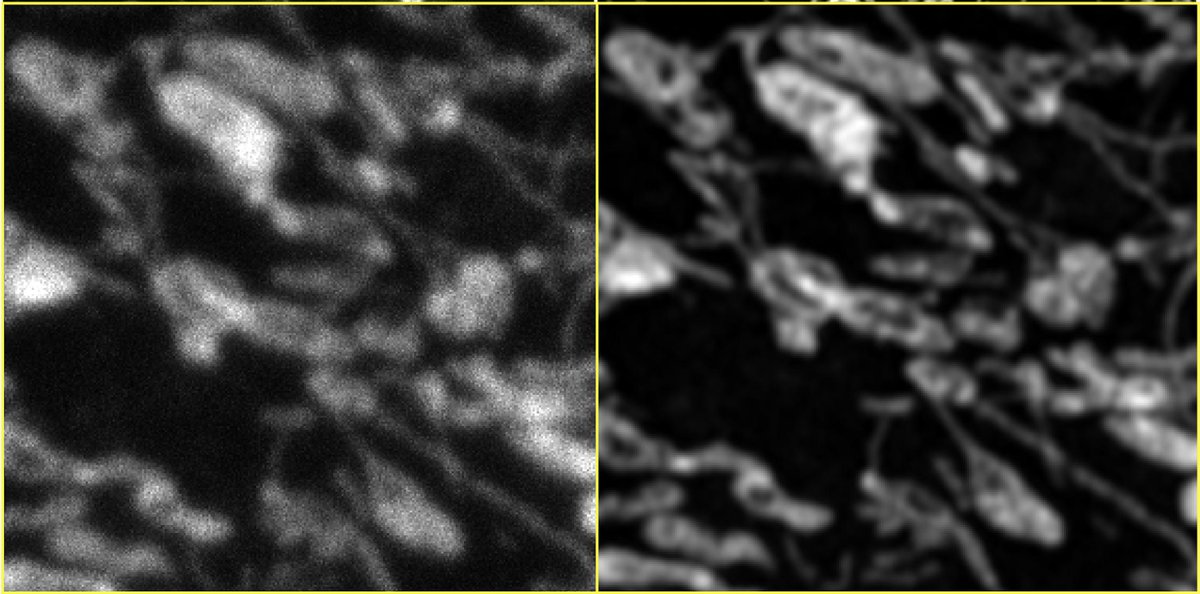
2) LR is *confocal*. HR is @zeiss_micro AIRYSCAN.
See Airyscan (R) vs. confocal (L) compare with *identical* settings.
1) Laser in LR was reduced 5x (so total laser=90x lower)
2) LR is *confocal*. HR is @zeiss_micro AIRYSCAN.
See Airyscan (R) vs. confocal (L) compare with *identical* settings.
So PSSR performs multiple "operations" simultaneously:
1) pixel super-resolution (aka "super-sampling")
2) Airyscan-quality deconvolution (or something close to that)
3) denoising
That's pretty remarkable considering only ~10GB of training data! FYI our EM dataset was ~80GB.
1) pixel super-resolution (aka "super-sampling")
2) Airyscan-quality deconvolution (or something close to that)
3) denoising
That's pretty remarkable considering only ~10GB of training data! FYI our EM dataset was ~80GB.
So let's go back to the neuron data. As mentioned earlier, we cannot simultaneously capture the resolution needed to resolve adjacent mitos while also getting sufficient frame-rates to capture motility. The slow frame rate of HR acquisitions is reflected in the dotted kymograph
A HUGE shout-out to @GulcinPekkurnaz for pointing this need, providing beautiful neuron preps, and help with kymograph analysis. Gulcin and her grad student Blenda are incredible collaborators/scientists/neighbors and one of many reasons I love living and working in San Diego.
In any case, here's an example of the results - you can see that after PSSR "treatment", our LR acquisitions (which, again, are 16x faster than HR) are sufficiently able to resolve adjacent mitochondria, allowing us to track their movement with max spatiotemporal resolution.

And here is the cool kymograph data highlighting fission and "passing" events that weren't detectable in the LR data. Once again - these analyses were courtesy of @GulcinPekkurnaz's lab.
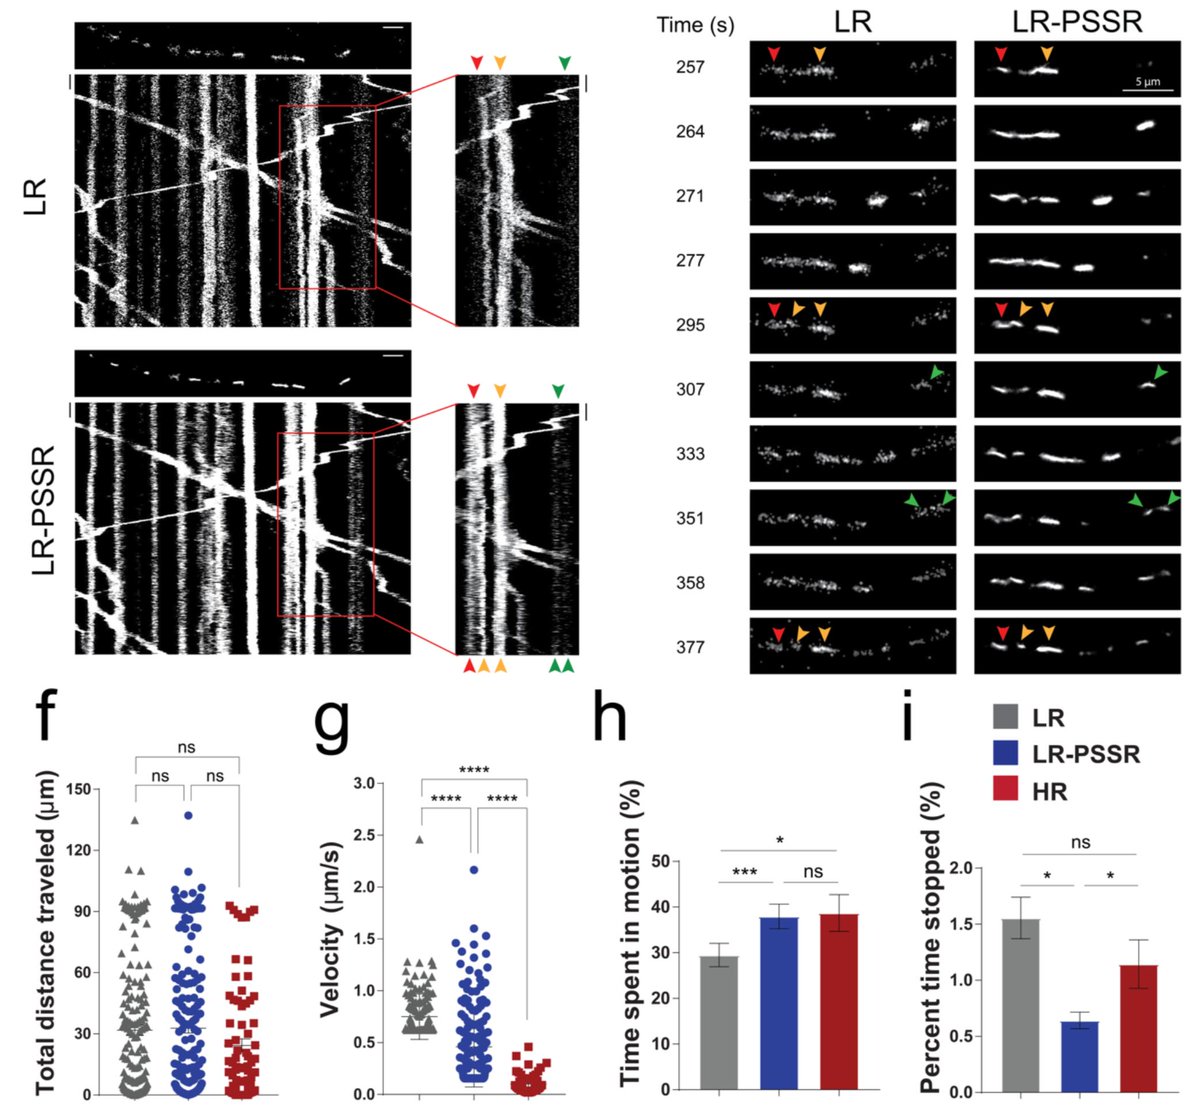
Note of interest: Some of our LR data was acquired with 20x lower laser power with a confocal detector with a pinhole size of 2.5AU (320x lower laser dose total), and yet the PSSR output a resolution of ~90nm on par with Airyscan processed data.


So that's it for data. The main thing to emphasize now is the first paragraph of our discussion: *PLEASE* be sober when using any deep learning-based image restoration. Some great reviews by @loicaroyer @florianjug and @HenriquesLab cover why in detail.
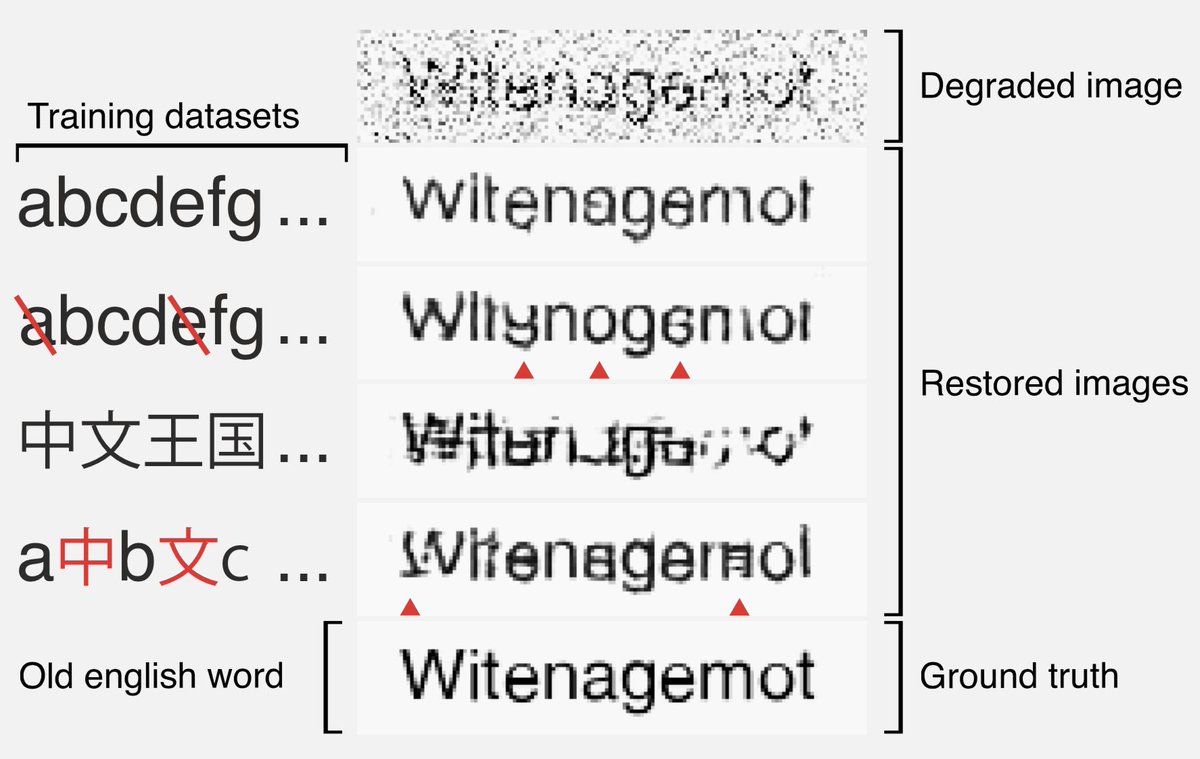
@cbelthan and @loicaroyer give one of my favorite illustrations why in this figure from their paper here: preprints.org/manuscript/201…
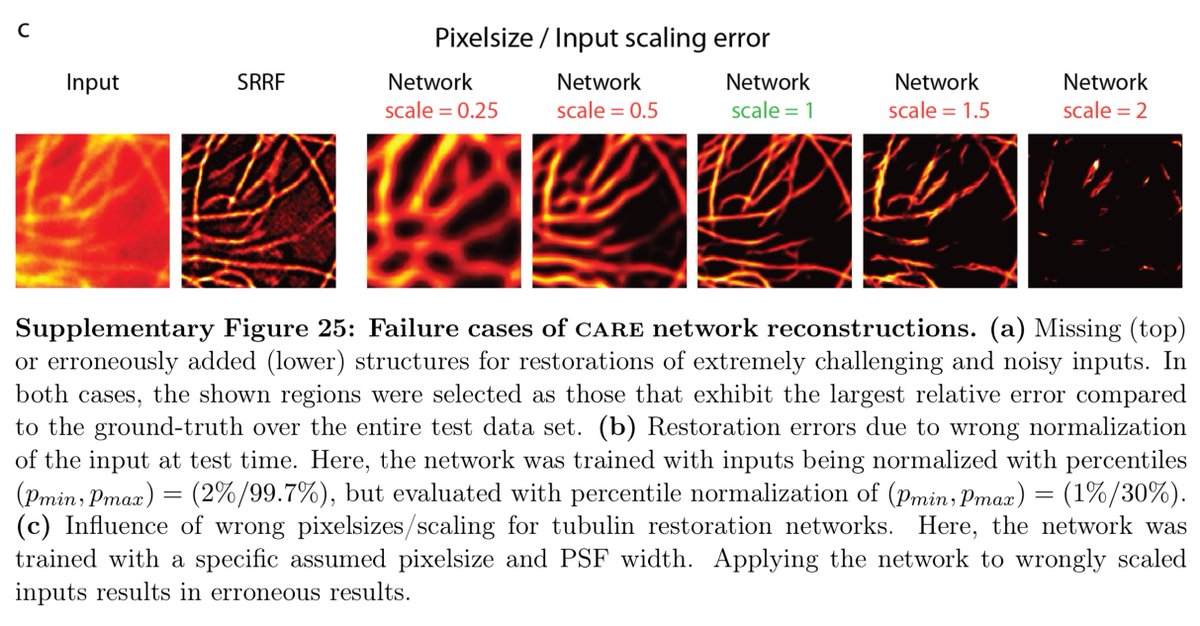
You'll also find a nice example of how that works for microscopy data in the legendary CARE paper here: nature.com/articles/s4159…
If the pixel size is wrong, it won't work so well. Same thing happens with PSSR, which for EM was specifically trained for 8nm LR data.
If the pixel size is wrong, it won't work so well. Same thing happens with PSSR, which for EM was specifically trained for 8nm LR data.
Having said those words of caution, I also think the future is absolutely thrilling and I cannot wait to try like 50 jillion experiments.
Finally, I want to give a huge shoutout to first author @_LynnFang, who is already taking over the world and she's barely 25 years old! Also gotta give a giant shoutout to our insanely talented 3DEM and Image Analysis Specialist Sammy (circled in red) and postdoc Cara (blue).
I will also never be able to thank enough Fred Monroe (@313V), Jeremy @jeremyphoward, and @fastdotai for this invaluable collaboration. Quite possibly the most impactful collaboration of my entire career. Also gotta thank WAMRI.ai for supporting our collaboration.
Finally, I need to thank @salkinstitute for supporting us. In case you haven't noticed, most Core Directors aren't putting out preprints the way we are. It's not (just) us! It's the institute and colleagues that give us the freedom, resources, and inspiration we need. #solucky
I forgot to re-emphasize how critical our collaboration with Kristen Harris's group was for all this. So awesome to work with a legend like her. They provided the high res tSEM images needed to train our PSSR EM model, and they helped with the presynaptic vesicle quantification.
Just as importantly, Kristen connected us with @TACC which hosts 3DEM.org, which will be the hosting site for all our training data and models! TACC hardware and people are simply bonkers, and they just got better - 448 NVIDIA V100 GPUs!!!
news.utexas.edu/2019/09/03/tex…
news.utexas.edu/2019/09/03/tex…
UPDATE:
1) ALL THE DATA is now downloadable at doi.org/10.18738/T8/YL… thanks to the amazing team at @TACC
2) We updated our preprint! Specifically, we added references to @docmilanfar's video superres work and fission event data in Fig 3.
doi.org/10.1101/740548
1) ALL THE DATA is now downloadable at doi.org/10.18738/T8/YL… thanks to the amazing team at @TACC
2) We updated our preprint! Specifically, we added references to @docmilanfar's video superres work and fission event data in Fig 3.
doi.org/10.1101/740548