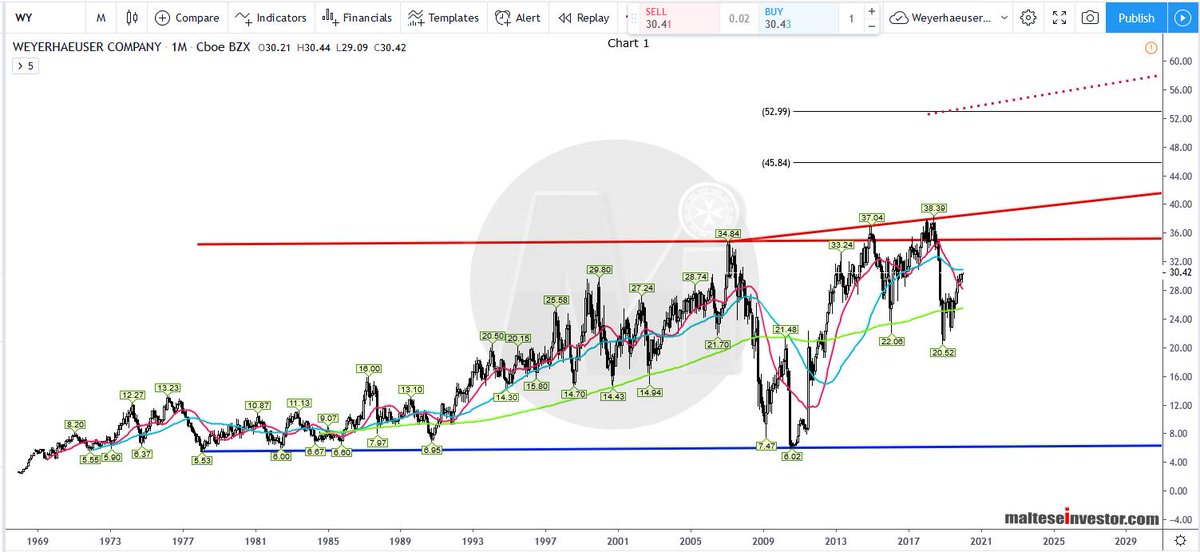
A very strong trending stock which went #parabolic and beginning to lose some momentum. The trend will remain strong.
2/11
2/11
Chart 1
Monthly chart with strong upward moves closing above the #pivots, marking new highs.
The stock has gone parabolic making a new all time highs.
3/11
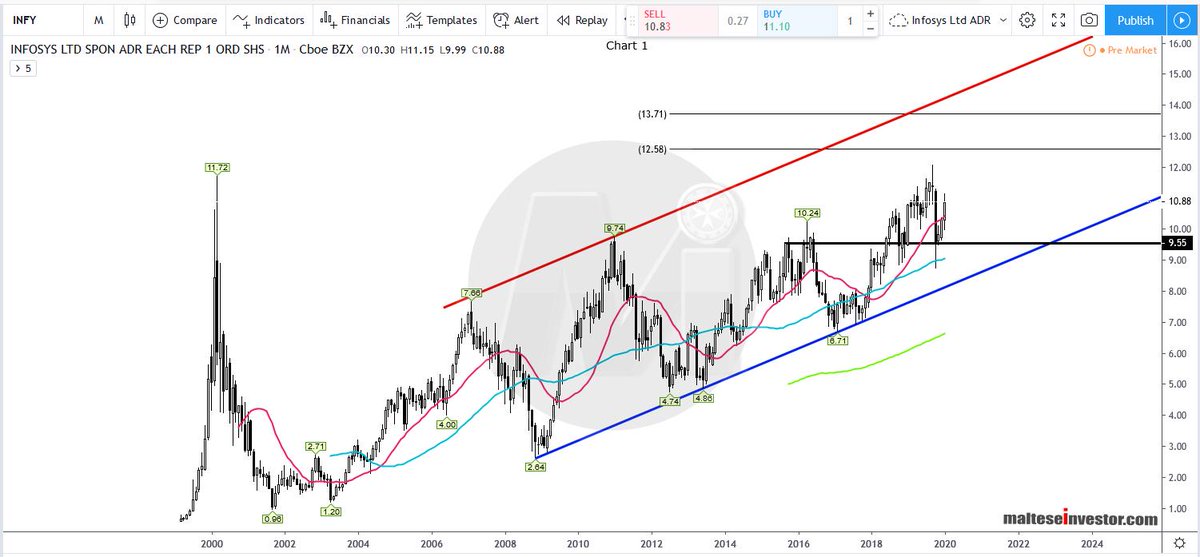
Monthly chart with strong upward moves closing above the #pivots, marking new highs.
The stock has gone parabolic making a new all time highs.
3/11
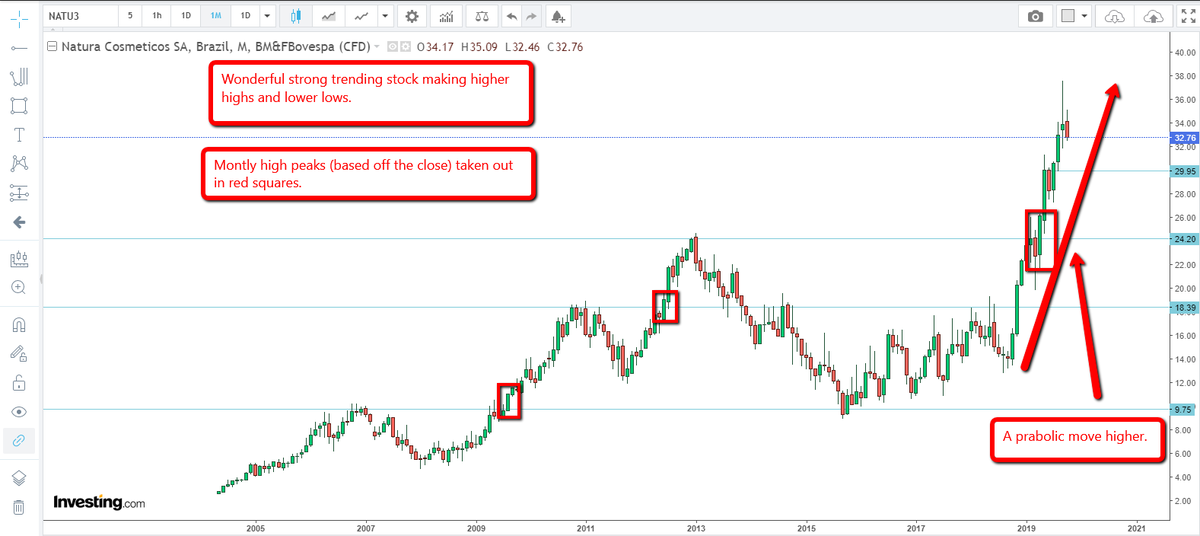
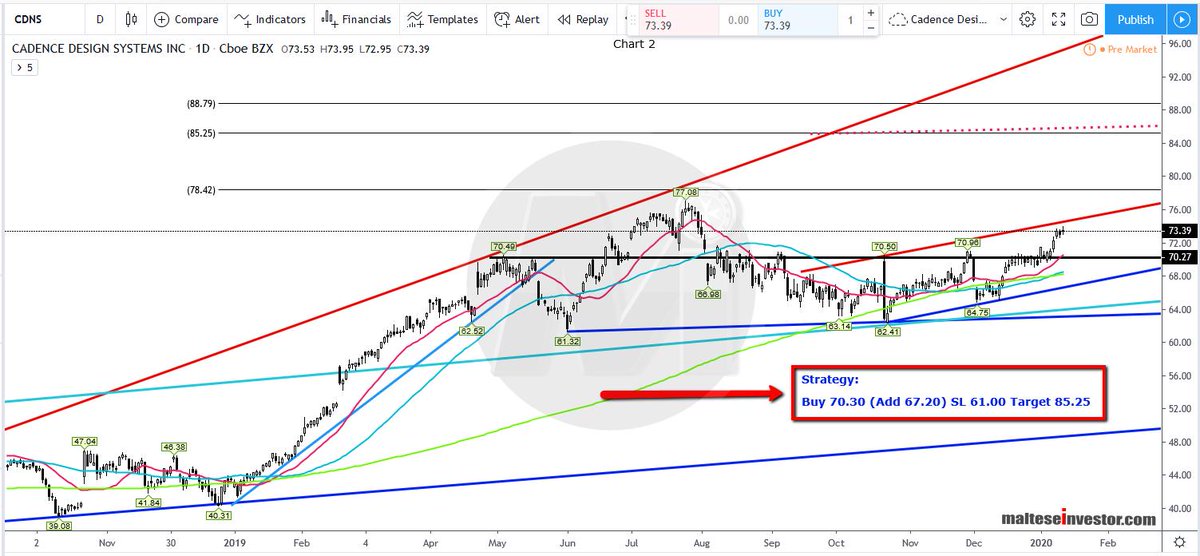
Chart 2
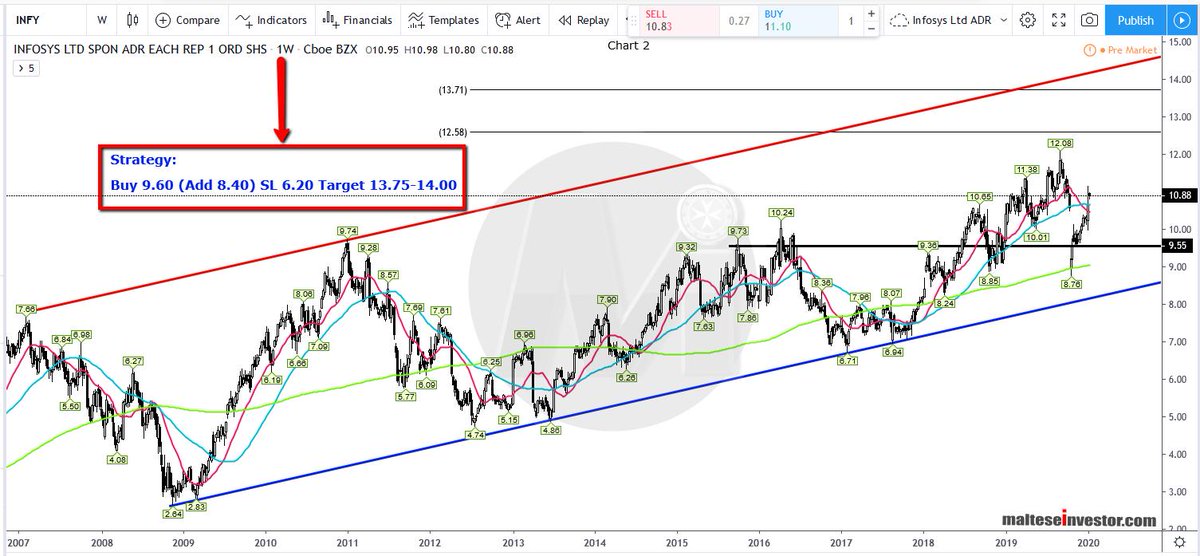
Monthly Chart: #Fibonacci applied from low @ R$2.69 to high @ R$24.65. A temporary break of the 0.618% attracts buyers and the level is retaken and the break of the high leads to a parabolic move. A minor monthly pivot at R$29.95.
4/11
Monthly Chart: #Fibonacci applied from low @ R$2.69 to high @ R$24.65. A temporary break of the 0.618% attracts buyers and the level is retaken and the break of the high leads to a parabolic move. A minor monthly pivot at R$29.95.
4/11
Chart 3
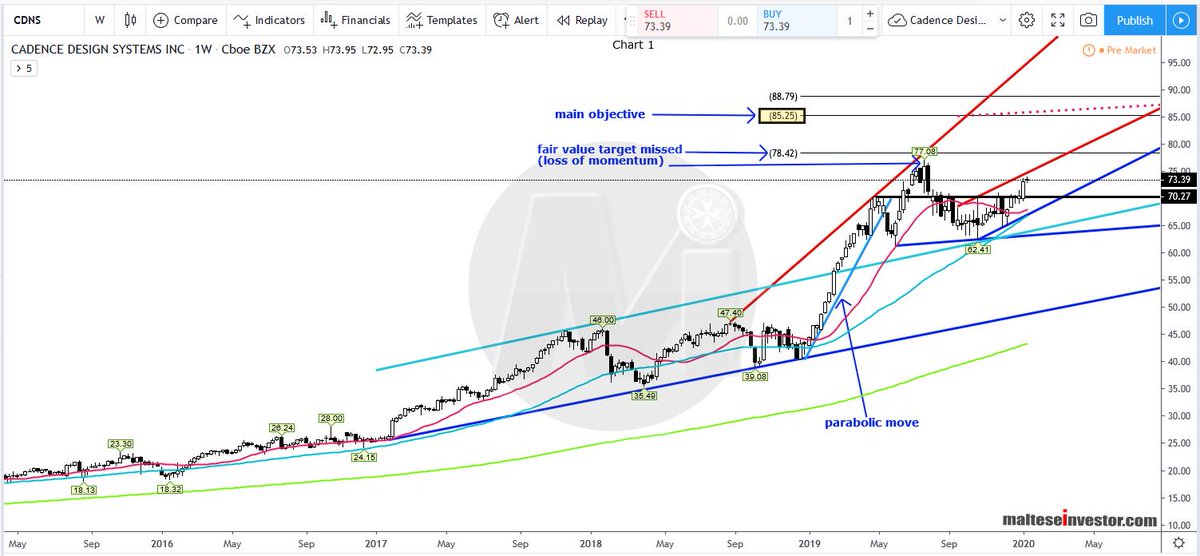
Monthly Chart: A supporting #trendline and replica are drawn to form a channel to test strength and possible resistance. Inverted #Fibs added as we look for possible resistances @ 1.272, 1.414 and 1.618 respectively. The channel top is quickly overwhelmed with ...
5/11
Monthly Chart: A supporting #trendline and replica are drawn to form a channel to test strength and possible resistance. Inverted #Fibs added as we look for possible resistances @ 1.272, 1.414 and 1.618 respectively. The channel top is quickly overwhelmed with ...
5/11
... sellers positioned at Fib 1.272% initially stall the upside temporarily but by July prices closes above. Upside spike fails to reach the 1.618% @ R$38.22. Sales around the 1.414% for prices lower. So far price has failed to close above on a monthly basis.
6/11
6/11
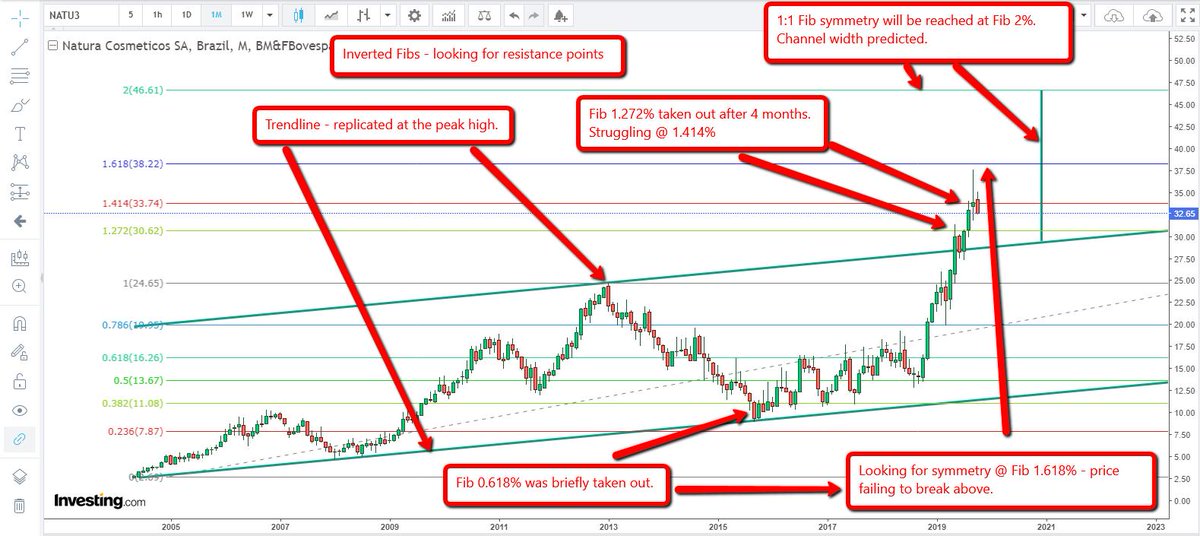
Chart 4
Weekly Chart: A rising trendline off the base of the parabolic move. Price is making a strong move below the 1.414% @ R$33.74. The trend is strong higher highs (HH) and higher lows (HL)
7/11
Weekly Chart: A rising trendline off the base of the parabolic move. Price is making a strong move below the 1.414% @ R$33.74. The trend is strong higher highs (HH) and higher lows (HL)
7/11

Chart 5
Weekly Chart: Same as Chart 4, but with more detail.
8/11
Weekly Chart: Same as Chart 4, but with more detail.
8/11

Chart 6
Daily Chart: Fibs drawn off the rising trendline lows as we search for a confluence of support. The August 29 supporting trendline has broken and retested from the underneath. The current target is now the support of the daily Fib 0.236% @ R$31.81. .....
9/11
Daily Chart: Fibs drawn off the rising trendline lows as we search for a confluence of support. The August 29 supporting trendline has broken and retested from the underneath. The current target is now the support of the daily Fib 0.236% @ R$31.81. .....
9/11
.... A break/close lower will then set sight on multiple supports: Inv. Fib 1.272%, Daily Fibs 0.382% & 0.50% - buyers a will be positioned between 31.65-30.60.
10/11
10/11

Chart 7:
Daily Chart zoomed: More buyers will be positioned at the minor monthly pivot @ R$29.95. A break and hold lower will then target major support at the trendline, monthly channel support, daily Fibs ... the value area is between R$28.70 - R$27.90.
11/11
Daily Chart zoomed: More buyers will be positioned at the minor monthly pivot @ R$29.95. A break and hold lower will then target major support at the trendline, monthly channel support, daily Fibs ... the value area is between R$28.70 - R$27.90.
11/11

Chart 2