Don't be fooled by today's brief flurry to the upside. A lot of work has to be done before Tata can be considered bullish. Keep on selling it.
TTM 2/5
TTM 2/5
Chart 1
Monthly Chart: Price hasn't close above the SMA 20 since July 2017 and even a close above doesn't mean much, because there exists a #confluence of Fib and pivot resistance residing higher and broken #trendline support now turned resistance.
TTM 3/5
Monthly Chart: Price hasn't close above the SMA 20 since July 2017 and even a close above doesn't mean much, because there exists a #confluence of Fib and pivot resistance residing higher and broken #trendline support now turned resistance.
TTM 3/5
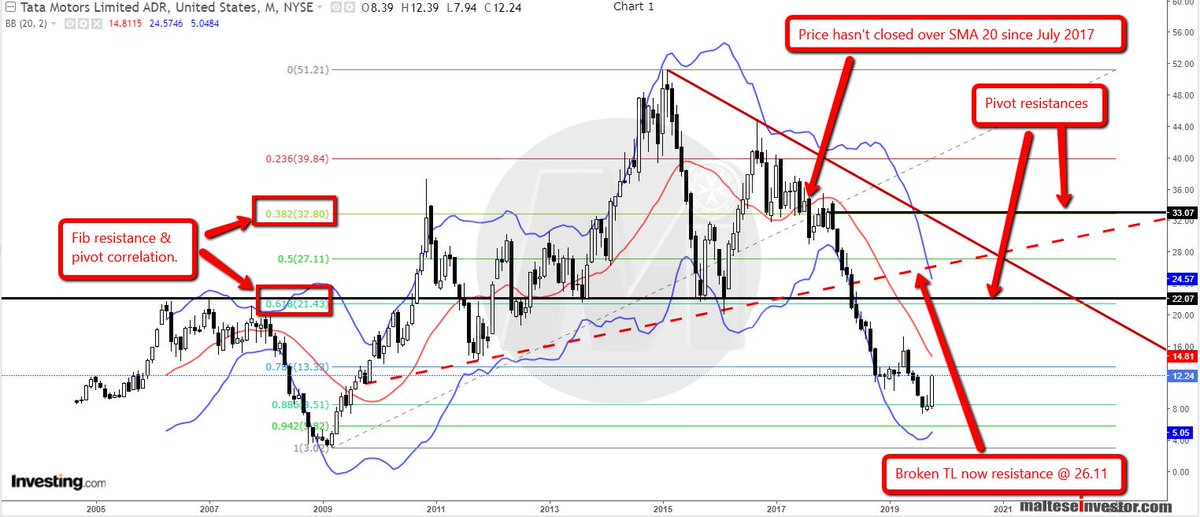
Chart 2
Weekly Chart: The #SMA 100 @ 17.24 is not reliable, above that we have channel resistance at a 19.70/40 slope.
TTM 4/5
Weekly Chart: The #SMA 100 @ 17.24 is not reliable, above that we have channel resistance at a 19.70/40 slope.
TTM 4/5