Analysis: #NASDAQ: #MSFT
Case 29 #Microsoft Corporation
DISCLAIMER: The analysis is strictly for educational purposes and should not be construed as an invitation to trade.
Thread 👇👇👇
MSFT 1/6
Case 29 #Microsoft Corporation
DISCLAIMER: The analysis is strictly for educational purposes and should not be construed as an invitation to trade.
Thread 👇👇👇
MSFT 1/6

Microsoft has been in a strong #uptrend since the break/close above the previous all time high of 59.97 which happened Oct 2016. A monthly close above 144.45 will eventually target 155.40 and 158.25 within 5-7 months.
MSFT 2/6
MSFT 2/6
Chart 1
Monthly Chart: The strong trend supported by #trendline support, TL #pivots and natural pivots. A close above 144.45 targets 158.25
MSFT 3/6
Monthly Chart: The strong trend supported by #trendline support, TL #pivots and natural pivots. A close above 144.45 targets 158.25
MSFT 3/6
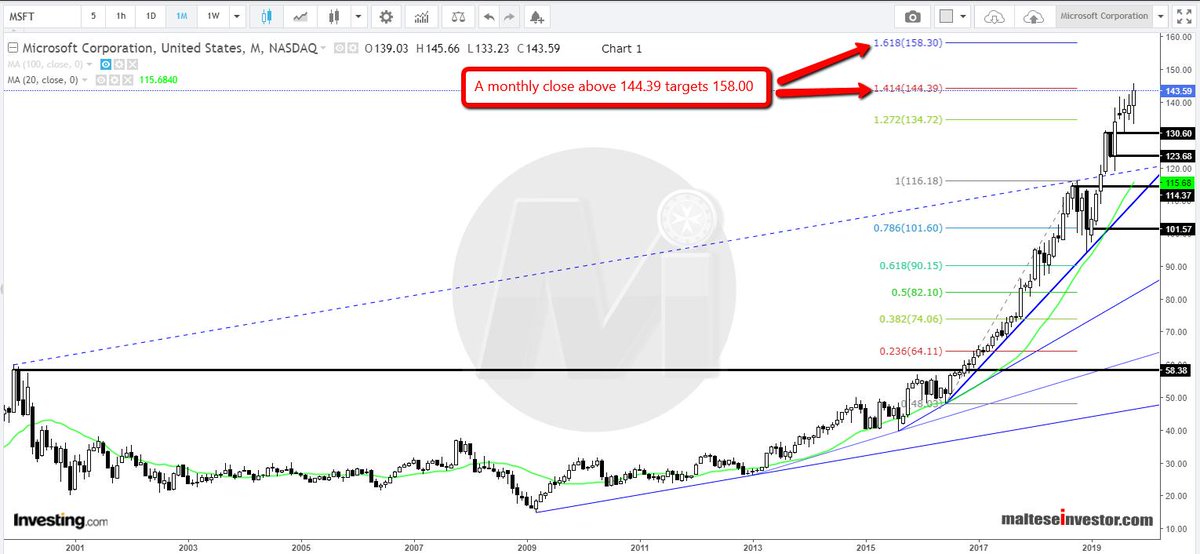
Chart 2
Weekly Chart: Price hasn't closed below the SMA 20 since Feb 2019 and continues to support the uptrend. Synthetic trendline resistance is in #confluence with Fib 1.414 @ 144.39 - a close above is very bullish.
MSFT 4/6
Weekly Chart: Price hasn't closed below the SMA 20 since Feb 2019 and continues to support the uptrend. Synthetic trendline resistance is in #confluence with Fib 1.414 @ 144.39 - a close above is very bullish.
MSFT 4/6
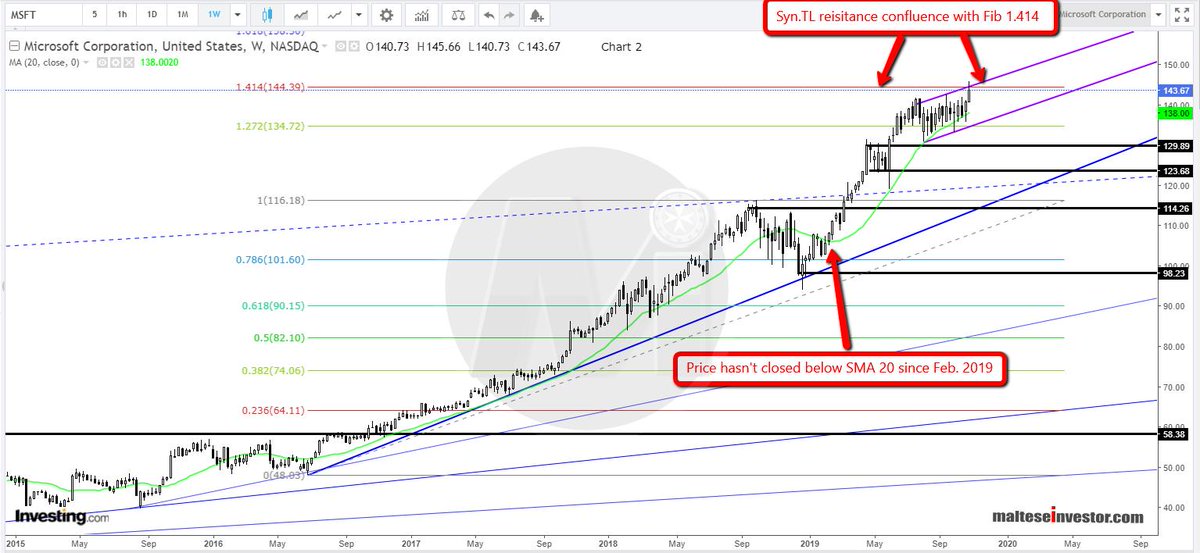
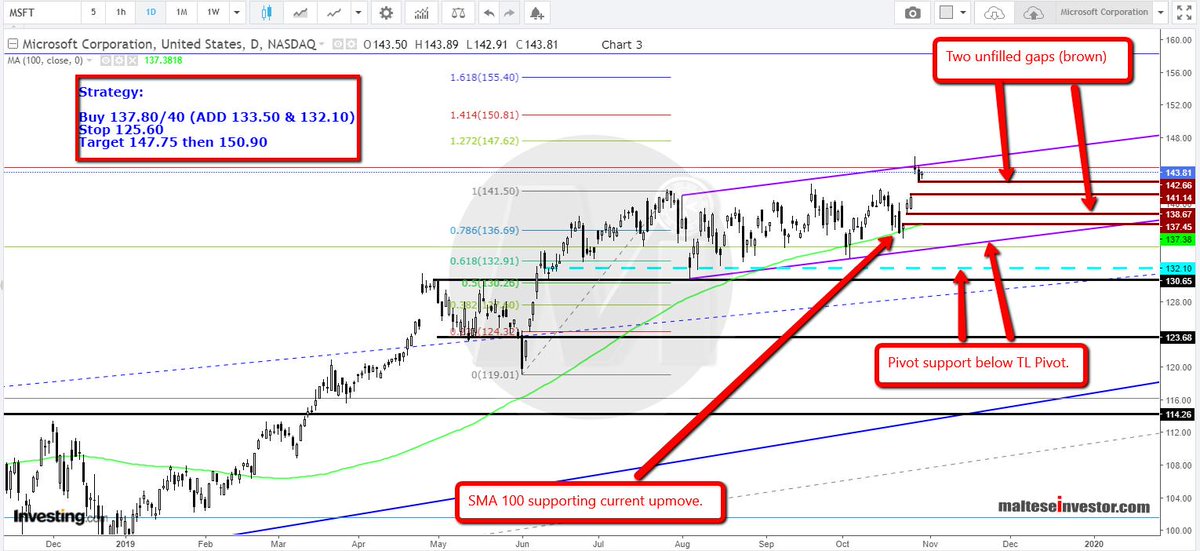
Chart 3
Daily Chart: Range bound activity (Aug-Oct 2019) had been very prevalent and two unfilled gaps have been created in 4 days of trading activity. .....
MSFT 5/6
Daily Chart: Range bound activity (Aug-Oct 2019) had been very prevalent and two unfilled gaps have been created in 4 days of trading activity. .....
MSFT 5/6
....... Price has not closed above the #synthetic TL/Fib resistance and warns of a possible shallow correction. The SMA 100 supports the current up move.
The #Strategy - printed in the image.
MSFT 6/6
The #Strategy - printed in the image.
MSFT 6/6