My contribution to keeping quarantined #ElectionTwitter sane: A Tour of the 50 States*
*Equal-population simulation (approximated by counties) 1/40
@JMilesColeman @SenhorRaposa @HarryEnten @Redistrict @ecaliberseven @PoliticsWolf @uselectionatlas @DKElections @Center4Politics
*Equal-population simulation (approximated by counties) 1/40
@JMilesColeman @SenhorRaposa @HarryEnten @Redistrict @ecaliberseven @PoliticsWolf @uselectionatlas @DKElections @Center4Politics
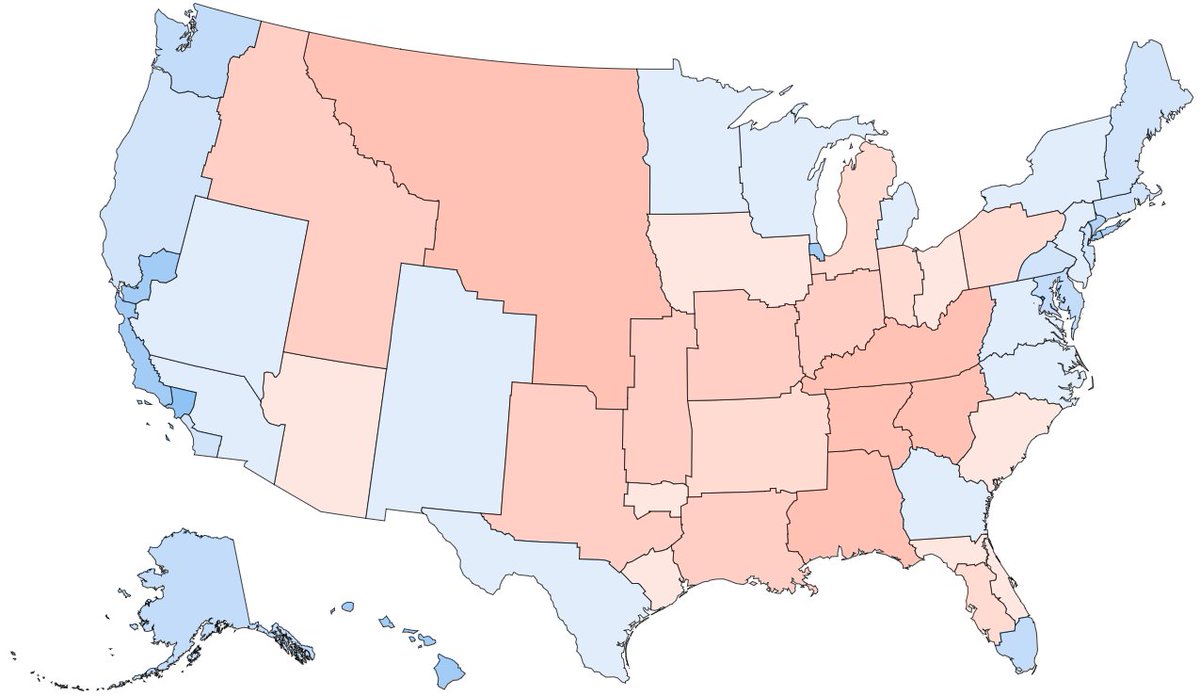
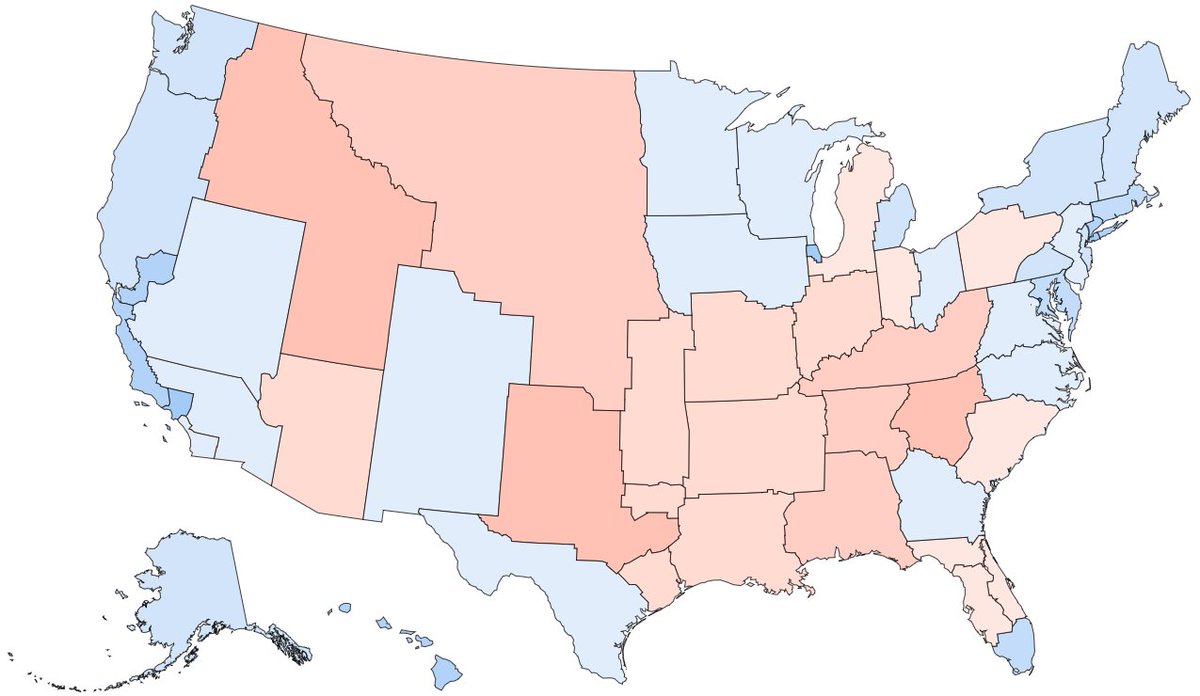
I used Redraw the States to resize them all to 10-11 Electoral Votes (sans DC/3 & Los Angeles county/16).
Electoral College:
2016: Clinton 297-241
2012: Obama 317-221
Then got curious how they voted for Gov/Sen... 2/40
kevinhayeswilson.com/redraw/?share=…
Electoral College:
2016: Clinton 297-241
2012: Obama 317-221
Then got curious how they voted for Gov/Sen... 2/40
kevinhayeswilson.com/redraw/?share=…
NB: Methodology: I combined results by year-sets e.g. 2012-16 (Sen), and 2013-16 (Gov).
I used the wonderful ourcampaigns.com to pull county results going back to 1957 (i.e. stopped when Hawaii and Alaska were admitted as states + data quality issues that far back). 3/40
I used the wonderful ourcampaigns.com to pull county results going back to 1957 (i.e. stopped when Hawaii and Alaska were admitted as states + data quality issues that far back). 3/40
AK: 11 EVs (55.0% Clinton, 56.9% Obama) 4/40
Sen 2002: Slade Gorton would’ve extended his tenure (gaining 02 AK-Sen offsetting the loss of 00 eastern WA).
Gov 2004: However, the closer 02 AK-Gov would not have been enough for 04 WA Dino Rossi to break the Gubernatorial streak.
Sen 2002: Slade Gorton would’ve extended his tenure (gaining 02 AK-Sen offsetting the loss of 00 eastern WA).
Gov 2004: However, the closer 02 AK-Gov would not have been enough for 04 WA Dino Rossi to break the Gubernatorial streak.


AL (central): 10 EVs (54.9% Trump, 52.7% Romney) 5/40
GA (northeast): 10 EVs (49.4% T, 50.4% R)
2018: The regional/suburban-rural divergences played out fascinatingly – after delivering the same results for 40 years, Nelson and Gillum would have squeaked it out only in GA.
GA (northeast): 10 EVs (49.4% T, 50.4% R)
2018: The regional/suburban-rural divergences played out fascinatingly – after delivering the same results for 40 years, Nelson and Gillum would have squeaked it out only in GA.


AR: 10 EVs (57.3% T, 55.5% R) 6/40
TN and MS sections would have sunk Sens Pryor and Lincoln earlier on (except 08 AR).
Gov 2004: Though Gov Huckabee's reelection (02 AR-Gov) would nearly have been tripped up by the performances of Musgrove (03 MS-Gov) and Bredesen (02 TN-Gov).
TN and MS sections would have sunk Sens Pryor and Lincoln earlier on (except 08 AR).
Gov 2004: Though Gov Huckabee's reelection (02 AR-Gov) would nearly have been tripped up by the performances of Musgrove (03 MS-Gov) and Bredesen (02 TN-Gov).


AZ: 11 EVs (48.6% T, 53.6% R) 7/40
With 11 EVs already, AZ stayed basically the same. The only population tweak was shifting tiny Yuma and La Paz counties, but this didn't alter any results.
With 11 EVs already, AZ stayed basically the same. The only population tweak was shifting tiny Yuma and La Paz counties, but this didn't alter any results.


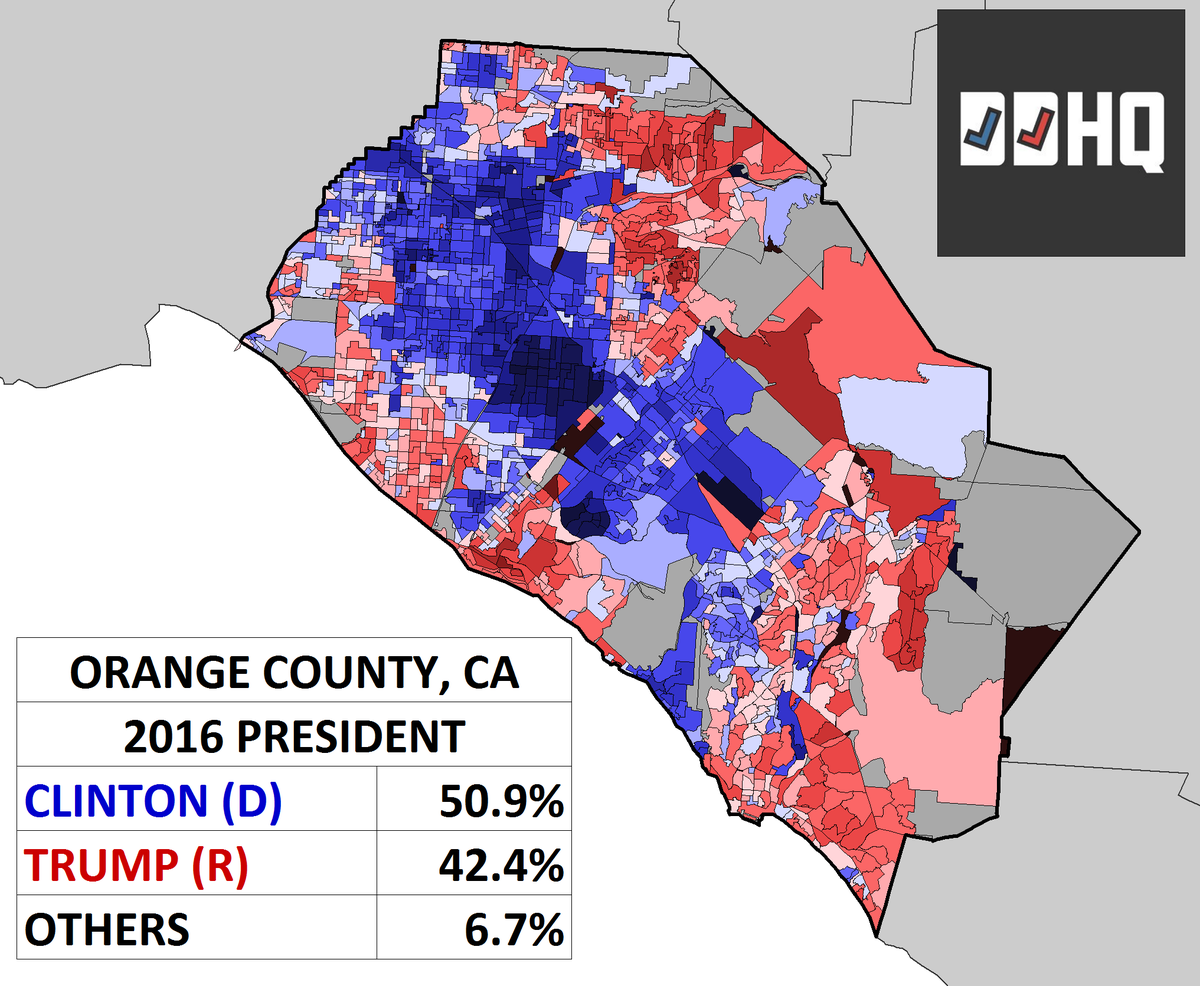
CA (LA): 16 EVs (71.8% C, 69.7% O) 8/40
IL (Chicago): 11 EVs (71.3% C, 69.9% O)
Urban islands that used to vote in tandem with their states e.g. Gov Ronald Reagan (66-70 CA) & 3-term Sen Charles Percy (66-78 IL).
Now, even Gov Schwarzenegger (06 CA) couldn’t quite breach it.
IL (Chicago): 11 EVs (71.3% C, 69.9% O)
Urban islands that used to vote in tandem with their states e.g. Gov Ronald Reagan (66-70 CA) & 3-term Sen Charles Percy (66-78 IL).
Now, even Gov Schwarzenegger (06 CA) couldn’t quite breach it.


CO: 11 EVs (49.1% C, 52.4% O) 9/40
Sen 2014: Sans northeastern CO, Udall prevailed; by 700 votes even without Heinrich's boost (12 NM).
Sen 1980: While Pete Domenici fell short in the Watergate midterm (Hart's 74 CO victory overwhelmed 72 NM); he won the 'rematch' by 241 votes.
Sen 2014: Sans northeastern CO, Udall prevailed; by 700 votes even without Heinrich's boost (12 NM).
Sen 1980: While Pete Domenici fell short in the Watergate midterm (Hart's 74 CO victory overwhelmed 72 NM); he won the 'rematch' by 241 votes.


CT (NYC to Suffolk): 10 EVs (69.7% C, 72.5% O) 10/40
RI (Kings-Queens-Nassau): 11 EVs (67.7% C, 68.4% O)
Sen 1970: shockingly, Buckley (Con) won CT thanks to vote-splitting by D & (Rockefeller-appointed) R.
Gov 1998: Pataki lost CT, but was saved in RI by Fairfield (98 CT-Gov).
RI (Kings-Queens-Nassau): 11 EVs (67.7% C, 68.4% O)
Sen 1970: shockingly, Buckley (Con) won CT thanks to vote-splitting by D & (Rockefeller-appointed) R.
Gov 1998: Pataki lost CT, but was saved in RI by Fairfield (98 CT-Gov).


DE: 11 EVs (61.0% C, 62.9% O) 11/40
Gov 2016/2004: The loss of MD's eastern panhandle and merge with DE cost Hogan (14 MD) and Ehrlich (02 MD), with the elections of Carney (16 DE) and Ann Minner (04 DE) tipping the balance - the latter by 777 votes.
Gov 2016/2004: The loss of MD's eastern panhandle and merge with DE cost Hogan (14 MD) and Ehrlich (02 MD), with the elections of Carney (16 DE) and Ann Minner (04 DE) tipping the balance - the latter by 777 votes.


FL: 11 EVs (59.9% C, 62.9% O) 12/40
Sen 2010: with the split between Crist (I) and Meek (D) , Rubio won FL with only 41% of the vote.
Gov 1998-2002: Otherwise, this region was blue enough to swamp even Jeb Bush's landslides.
Sen 2010: with the split between Crist (I) and Meek (D) , Rubio won FL with only 41% of the vote.
Gov 1998-2002: Otherwise, this region was blue enough to swamp even Jeb Bush's landslides.


HI (Coastal): 10 EVs (66.1% C, 65.8% O) 13/40
OR (Sacramento): 11 EVs (66.1% C, 65.5% O)
Gov 2006: Unlike aforementioned CA, Republicans did well in both these states - Schwarzenegger in OR, Lingle in HI. Only wins since Pete Wilson in the 94 Republican Revolution.
OR (Sacramento): 11 EVs (66.1% C, 65.5% O)
Gov 2006: Unlike aforementioned CA, Republicans did well in both these states - Schwarzenegger in OR, Lingle in HI. Only wins since Pete Wilson in the 94 Republican Revolution.


IA: 10 EVs (59.5% T, 56.4% R) 14/40
Sen 2014: Donnelly's solid win over Mourdock (12 IN-Sen) was strong enough to deliver a 531-vote victory in IA, even despite the absence of his northern Indiana base of South Bend (and Gary).
Sen 2014: Donnelly's solid win over Mourdock (12 IN-Sen) was strong enough to deliver a 531-vote victory in IA, even despite the absence of his northern Indiana base of South Bend (and Gary).


ID: 10 EVs (47.3% C, 50.0% O) 15/40
Sen: the addition of central California inflicted a run of narrow loses on Dems in Class 1. And 8 of 14 Sen races since '80 failed to crack 50%.
NB: Given the pattern of support, I counted the losers in 18/16 CA-Sen races as R-proxy votes.
Sen: the addition of central California inflicted a run of narrow loses on Dems in Class 1. And 8 of 14 Sen races since '80 failed to crack 50%.
NB: Given the pattern of support, I counted the losers in 18/16 CA-Sen races as R-proxy votes.


IN (west): 10 EVs (52.2% T, 51.1% R) 16/40
OH (east): 10 EVs (51.5% T, 53.7% O)
Suburban IN leans R (Sen Taft 64-76) though Sherrod Brown eked it out in 06/18.
But whereas Appalachia swung OH for Strickland and Fisher (10/98 OH-Gov), Cordray narrowly lost (pending WV counties).
OH (east): 10 EVs (51.5% T, 53.7% O)
Suburban IN leans R (Sen Taft 64-76) though Sherrod Brown eked it out in 06/18.
But whereas Appalachia swung OH for Strickland and Fisher (10/98 OH-Gov), Cordray narrowly lost (pending WV counties).


KS (Dallas-Fort Worth): 11 EVs (51.0% T, 56.7% R) 17/40
TX (Houston): 11 EVs (49.3% T, 55.9% R)
Sen 2018: O’Rourke won both - D's first victory since Bentsen in 88.
Gov 1990: The last close gubernatorial race. TX tipped to Ann Richards (D) by 2,383 votes; KS away by 917 votes.
TX (Houston): 11 EVs (49.3% T, 55.9% R)
Sen 2018: O’Rourke won both - D's first victory since Bentsen in 88.
Gov 1990: The last close gubernatorial race. TX tipped to Ann Richards (D) by 2,383 votes; KS away by 917 votes.


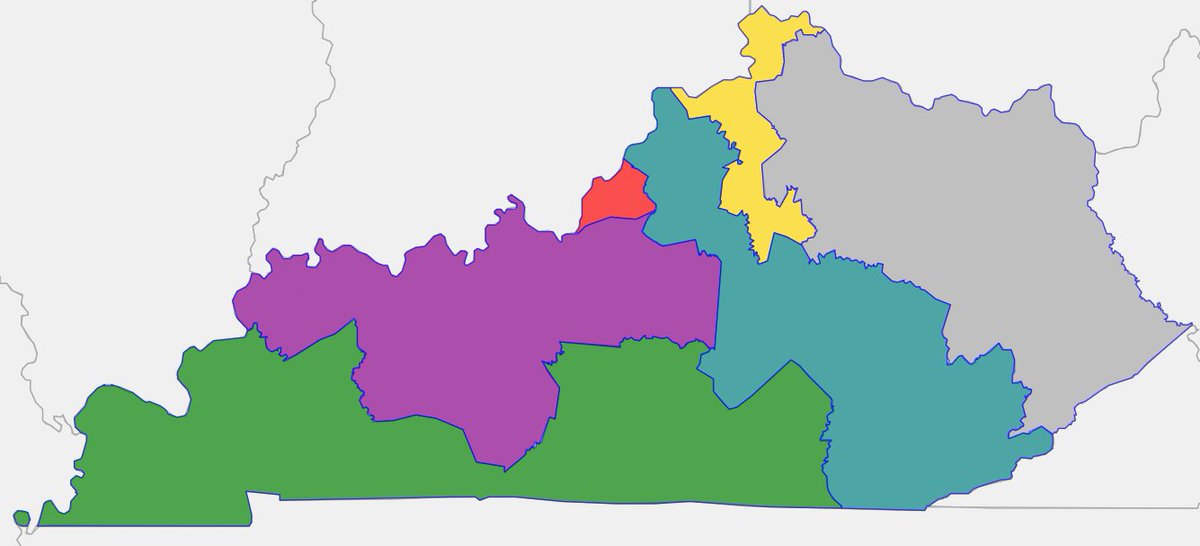
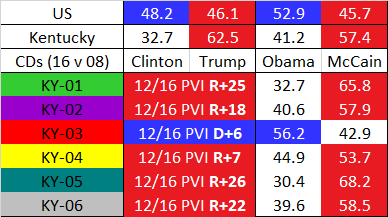
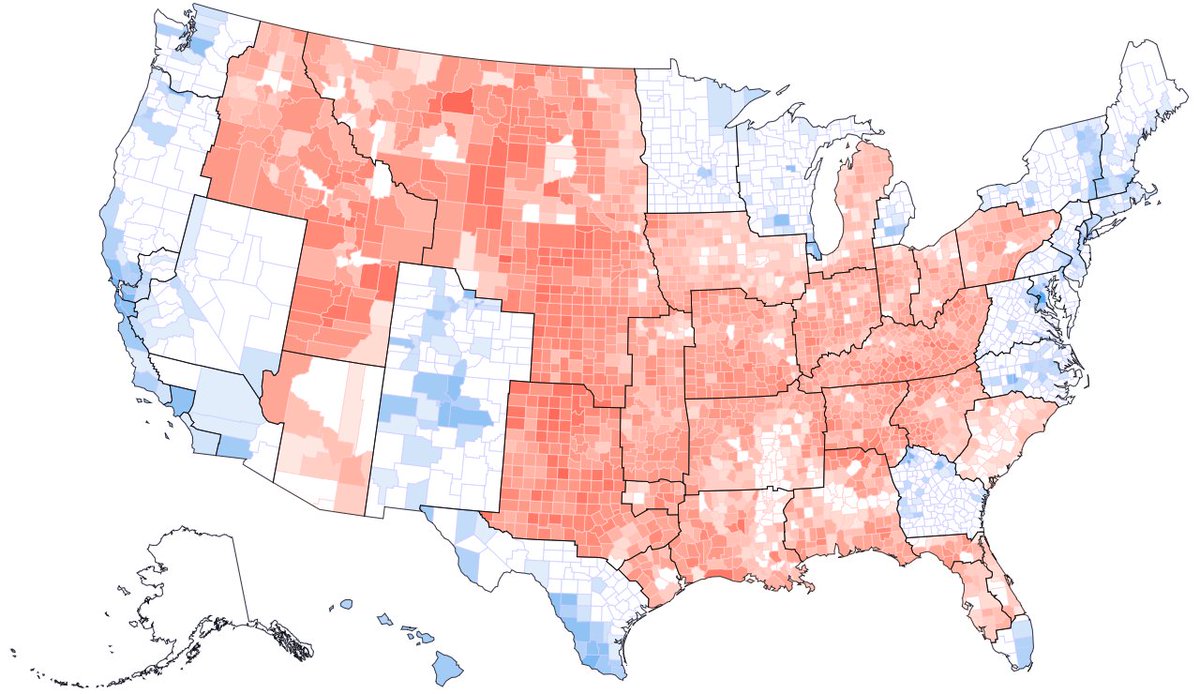
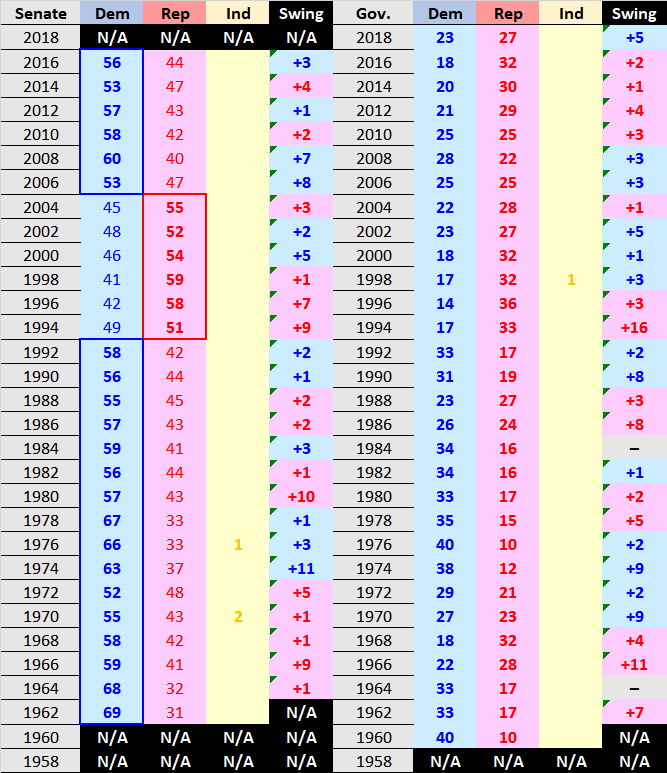
KY: 11 EVs (64.7% T, 61.5% R) 18/40
Sen 1984-2014: McConnell was sunk twice by Robert Byrd’s margins (82/88 WV-Sen), before a string of narrow wins.
Sen 2004-10: Similarly, Rockefeller (08/02 WV) and Warner (08 VA) kept the other seat blue through 2010 (Conway > Paul).
Sen 1984-2014: McConnell was sunk twice by Robert Byrd’s margins (82/88 WV-Sen), before a string of narrow wins.
Sen 2004-10: Similarly, Rockefeller (08/02 WV) and Warner (08 VA) kept the other seat blue through 2010 (Conway > Paul).


LA: 11 EVs (58.4% T, 57.6% R) 19/40
Gov 1991: I used total D/R votes in the jungle primary, treating party-switching Gov Roemer as independent. 2,675-vote Edwards win over Duke, due to 90 TX+91 MS.
Those same counties cost Gov Bel Edwards (19 LA); & Sen Landrieu (except 08 LA).
Gov 1991: I used total D/R votes in the jungle primary, treating party-switching Gov Roemer as independent. 2,675-vote Edwards win over Duke, due to 90 TX+91 MS.
Those same counties cost Gov Bel Edwards (19 LA); & Sen Landrieu (except 08 LA).


MA: 11 EVs (56.6% C, 60.6% O) 20/40
Typical northeastern result: dark blue federally, purple Governorship. Interestingly, Democrats haven't broken 50% in a gubernatorial race since 1986. (1990-2018 average: 49% R v 43% D).
Typical northeastern result: dark blue federally, purple Governorship. Interestingly, Democrats haven't broken 50% in a gubernatorial race since 1986. (1990-2018 average: 49% R v 43% D).


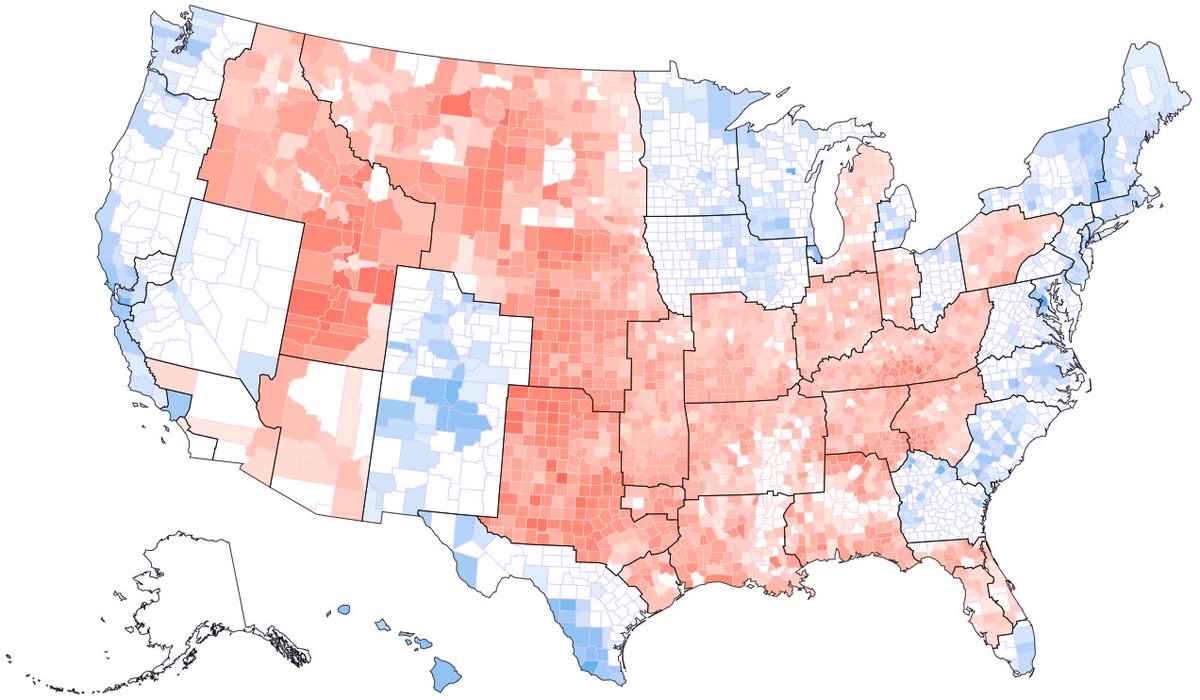
MD (north): 11 EVs (50.2% C, 50.9% O) 21/40
VA (south): 11 EVs (50.6% C, 52.4% O)
MD Gov 2016/1992: MD & WV panhandles toppled McAuliffe (13 VA) & Wilder (89 VA); +Sen Warner (14 VA).
VA Sen 2016: Flipside, substituting Norfolk for NC Mountains salvaged Sen Hagan (12 VA+14 NC).
VA (south): 11 EVs (50.6% C, 52.4% O)
MD Gov 2016/1992: MD & WV panhandles toppled McAuliffe (13 VA) & Wilder (89 VA); +Sen Warner (14 VA).
VA Sen 2016: Flipside, substituting Norfolk for NC Mountains salvaged Sen Hagan (12 VA+14 NC).


ME: 11 EVs (54.3% C, 57.5% O) 22/40
Another characteristically northeastern federal-state pattern.
Sen 2012/2014: Even with Angus King counted as an independent, & Collins' landslide in the R wave; Democrats pulled off wins thanks to NH & MA (12 ME/MA+14 NH, 14 ME/MA+16NH).
Another characteristically northeastern federal-state pattern.
Sen 2012/2014: Even with Angus King counted as an independent, & Collins' landslide in the R wave; Democrats pulled off wins thanks to NH & MA (12 ME/MA+14 NH, 14 ME/MA+16NH).


MI (east): 11 EVs (52.3% C, 59.0% O) 23/40
MO (west): 11 EVs (53.3% T, 51.7% R)
MI: Rs need waves to open the door (Sen Abraham 94, Gov Snyder 10).
Conversely, MO requires strong D performances: just enough in 2014 (14 MI, 16 IN+IL), but falling short in 2018 (18 MI+IN, 20 IL).
MO (west): 11 EVs (53.3% T, 51.7% R)
MI: Rs need waves to open the door (Sen Abraham 94, Gov Snyder 10).
Conversely, MO requires strong D performances: just enough in 2014 (14 MI, 16 IN+IL), but falling short in 2018 (18 MI+IN, 20 IL).


MN: 10 EVs (45.9% C, 52.4% O) 24/40
WI: 11 EVs (47.5% C, 52.8% O)
The slight adjustments altered a few close races:
MN: Northwest WI (10-Sen/Gov) flipped 2008 Sen (Franken), 2010 Gov (Dayton).
WI Gov 1962: Lake County (64 IL) flipped it to Rs (MI Upper Peninsula wasn't enough).
WI: 11 EVs (47.5% C, 52.8% O)
The slight adjustments altered a few close races:
MN: Northwest WI (10-Sen/Gov) flipped 2008 Sen (Franken), 2010 Gov (Dayton).
WI Gov 1962: Lake County (64 IL) flipped it to Rs (MI Upper Peninsula wasn't enough).


MS: 10 EVs (63.5% T, 62.3% R) 25/40
3 races mark the Deep South's transition:
Sen 1980: matched close R wins in 80 AL+FL+78 MS (notably Cochran).
Sen 1988: Heflin (90 AL) withstood Lott and Mack (88 MS+FL).
Gov 1999: Siegelman (98 AL) + Musgrove (99 MS) held off Bush (98 FL).
3 races mark the Deep South's transition:
Sen 1980: matched close R wins in 80 AL+FL+78 MS (notably Cochran).
Sen 1988: Heflin (90 AL) withstood Lott and Mack (88 MS+FL).
Gov 1999: Siegelman (98 AL) + Musgrove (99 MS) held off Bush (98 FL).


MT: 11 EVs (59.9% T, 59.4% R) 26/40
Stars need to align for MT Dems. Their formula for success (2006, 1990, 1976 Sen + 1984 Gov) has been to combine NE & MT wins (about 40% of the voting population) with ND or SD e.g. Sens Nelson, Tester, Conrad (06 NE/MT/ND), & Johnson (08 SD).
Stars need to align for MT Dems. Their formula for success (2006, 1990, 1976 Sen + 1984 Gov) has been to combine NE & MT wins (about 40% of the voting population) with ND or SD e.g. Sens Nelson, Tester, Conrad (06 NE/MT/ND), & Johnson (08 SD).


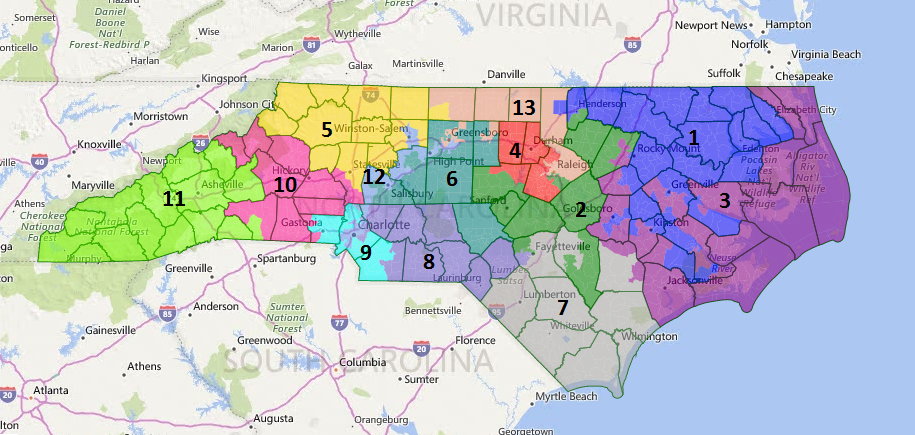
NC: 11 EVs (49.2% T, 49.4% R) 27/40
SC: 11 EVs (51.6% C, 51.3% O)
Gov: Smith poised to win NC (pending 20 NC-Gov); while SC elected Abrams/Carter/Barnes the last 3 cycles.
Sen: 2014 NC, Hagan still fell short; yet SC maintains a split-delegation: Isakson & Nunn/Martin/Cleland.
SC: 11 EVs (51.6% C, 51.3% O)
Gov: Smith poised to win NC (pending 20 NC-Gov); while SC elected Abrams/Carter/Barnes the last 3 cycles.
Sen: 2014 NC, Hagan still fell short; yet SC maintains a split-delegation: Isakson & Nunn/Martin/Cleland.


ND: 10 EVs (51.1% T, 50.1% O) 28/40
SD: 10 EVs (58.5% T, 54.7% R)
ND Sen 1984-2008: replicated Dems' lone IA bright spot - Sen Harkin's 5-term streak.
SD Sen 2002-20: Meanwhile, the outstanding 20 IL-Sen counties won't be enough to save McCaskill's 4th-term bid.
SD: 10 EVs (58.5% T, 54.7% R)
ND Sen 1984-2008: replicated Dems' lone IA bright spot - Sen Harkin's 5-term streak.
SD Sen 2002-20: Meanwhile, the outstanding 20 IL-Sen counties won't be enough to save McCaskill's 4th-term bid.


NE: 11 EVs (57.1% T, 58.6% R) 29/40
NE offers a reverse of the northeast syndrome: solidly red federally - at least since Sen David Boren (OK 78-90) - while purple gubernatorially.
Gov 2016: OK counties saved Brownback's bacon from R loses in 14-KS and 16-MO sections.
NE offers a reverse of the northeast syndrome: solidly red federally - at least since Sen David Boren (OK 78-90) - while purple gubernatorially.
Gov 2016: OK counties saved Brownback's bacon from R loses in 14-KS and 16-MO sections.


NH: 11 EVs (48.0% C, 56.1% O) 30/40
NH swung very much like a midwestern state in 2016.
Sen 1998: Schumer relied on Leahy (98 VT) & Kerry (96 MA) to overcome Sen D’Amato’s margins in upstate NY.
Sen 2000: Otoh, Jeffords (00 VT) squeaked out a majority against Clinton (00 NY).
NH swung very much like a midwestern state in 2016.
Sen 1998: Schumer relied on Leahy (98 VT) & Kerry (96 MA) to overcome Sen D’Amato’s margins in upstate NY.
Sen 2000: Otoh, Jeffords (00 VT) squeaked out a majority against Clinton (00 NY).


NJ: 10 EVs (49.9% C, 53.7% O) 31/40
NY: 11 EVs (56.3% C, 59.6% O)
NJ Sen 2002: Lautenberg won, as Schumer & Specter balanced out (04 NY/PA).
NY Sen 1990: Rockland+Staten Is. (92 NY) let Todd Whitman upset Bradley (90 NJ), & got her over the line 1994-98 Gov (93-97 NJ/94-98 NY).
NY: 11 EVs (56.3% C, 59.6% O)
NJ Sen 2002: Lautenberg won, as Schumer & Specter balanced out (04 NY/PA).
NY Sen 1990: Rockland+Staten Is. (92 NY) let Todd Whitman upset Bradley (90 NJ), & got her over the line 1994-98 Gov (93-97 NJ/94-98 NY).


NM: 10 EVs (51.9% C, 51.1% O) 32/40
Gov: R waves + incumbency allowed Abbot & Perry to hold the governorship the last 4 cycles.
Sen 2012: However, Sadler narrowly picked up Kay Bailey Hutchison’s open seat.
Sen 1996-2014: And despite NM's leftward drift, Cornyn rode 14's R wave.
Gov: R waves + incumbency allowed Abbot & Perry to hold the governorship the last 4 cycles.
Sen 2012: However, Sadler narrowly picked up Kay Bailey Hutchison’s open seat.
Sen 1996-2014: And despite NM's leftward drift, Cornyn rode 14's R wave.


NV (Orange-San Diego): 11 EVs (53.8% C, 49.2% O) 33/40
WY (Inland Empire): 10 EVs (49.7% C, 49.6% O)
WY Gov 1962: Pat Brown beat ex-VP Nixon.
WY Gov 1974: Jerry Brown lost 12 years later b/c Yuma (74 AZ).
Sen 2000-18: Feinstein’s run diverged when she won NV but lost WY (18 CA).
WY (Inland Empire): 10 EVs (49.7% C, 49.6% O)
WY Gov 1962: Pat Brown beat ex-VP Nixon.
WY Gov 1974: Jerry Brown lost 12 years later b/c Yuma (74 AZ).
Sen 2000-18: Feinstein’s run diverged when she won NV but lost WY (18 CA).


OK: 10 EVs (61.4% T, 65.4% R) 34/40
Gov 1990: Dems’ last hurrah – Richards (TX) kept it close enough for Gov Walters (OK) to win.
Sen 1988: Bentsen (88 TX) and Boren (90 OK) retired at the same time.
Sen 1978: Nickles (80 OK) and Tower’s (78 TX) closest races coincided.
Gov 1990: Dems’ last hurrah – Richards (TX) kept it close enough for Gov Walters (OK) to win.
Sen 1988: Bentsen (88 TX) and Boren (90 OK) retired at the same time.
Sen 1978: Nickles (80 OK) and Tower’s (78 TX) closest races coincided.


PA (Philly): 10 EVs (54.9% C, 57.6% O) 35/40
VT (Allegheny Plateau): 10 EVs (56.9% T, 52.8% R)
Gov 1986-90: Bob Casey Sr ran >10% points better in VT than PA.
Sen 2006-18: Bob Casey Jr's inverse performance reflects rural-suburban trends (but would've won 2018 VT sans west NY).
VT (Allegheny Plateau): 10 EVs (56.9% T, 52.8% R)
Gov 1986-90: Bob Casey Sr ran >10% points better in VT than PA.
Sen 2006-18: Bob Casey Jr's inverse performance reflects rural-suburban trends (but would've won 2018 VT sans west NY).


TN: 11 EVs (62.1% T, 62.7% R) 36/40
Sen 1988/90: Dems were replaced with Rs by the next cycle:
◦ Heflin/Shelby (90/92 AL) => Retired/Party-switched;
◦ Sasser/Gore (88/90 TN) => Defeated in 94/Nominated for VP;
◦ Nunn/Fowler (90/92 GA) => Retired/Defeated in 92 run-off.
Sen 1988/90: Dems were replaced with Rs by the next cycle:
◦ Heflin/Shelby (90/92 AL) => Retired/Party-switched;
◦ Sasser/Gore (88/90 TN) => Defeated in 94/Nominated for VP;
◦ Nunn/Fowler (90/92 GA) => Retired/Defeated in 92 run-off.


UT: 10 EVs (52.5% T, 66.7% R) 37/40
Gov 1980: Scott Matheson Sr. (UT) & John Evans (ID) overcame the rest of UT (80 UT/WA/MT+78 ID/OR/WY).
Sen 1960: Frank Moss (UT) & Gale McGee (WY) won 3-terms (58 UT/WA/WY/MT+60 ID/OR).
Sen 1962: Spokane deprived Frank Church's (ID) 2nd term.
Gov 1980: Scott Matheson Sr. (UT) & John Evans (ID) overcame the rest of UT (80 UT/WA/MT+78 ID/OR/WY).
Sen 1960: Frank Moss (UT) & Gale McGee (WY) won 3-terms (58 UT/WA/WY/MT+60 ID/OR).
Sen 1962: Spokane deprived Frank Church's (ID) 2nd term.


WA: 11 EVs (53.7% C, 57.0% O) 38/40
Sen 1966-90: Gov Hatfield (OR) narrowly won the open seat, & recreated his 5-terms.
By the time he retired, only Bush’s post-9/11 midterm (Sen Smith 02 OR) & Schwarzenegger’s 17-point re-election (06 CA) let Rs surpass their Portland deficit.
Sen 1966-90: Gov Hatfield (OR) narrowly won the open seat, & recreated his 5-terms.
By the time he retired, only Bush’s post-9/11 midterm (Sen Smith 02 OR) & Schwarzenegger’s 17-point re-election (06 CA) let Rs surpass their Portland deficit.


WV: 11 EVs (66.4% T, 65.5% R) 39/40
Sen II: Despite residual Dem strength, Thurmond & Helms (SC/NC) forged a Republican lock after the former switched parties in 1964.
Sen 1986: Fritz Hollings' fading upstate SC strength powered Dems’ last gasp (86 GA/SC/NC + 84 TN/VA).
Sen II: Despite residual Dem strength, Thurmond & Helms (SC/NC) forged a Republican lock after the former switched parties in 1964.
Sen 1986: Fritz Hollings' fading upstate SC strength powered Dems’ last gasp (86 GA/SC/NC + 84 TN/VA).


All together, the overview of party strength reflects the various waves. 40/40
However, the differences also re-emphasize the arbitrariness of state boundaries - which underscores need for @NatlPopularVote for President & @FairVote’s #FairRepAct for House so all votes are equal.
However, the differences also re-emphasize the arbitrariness of state boundaries - which underscores need for @NatlPopularVote for President & @FairVote’s #FairRepAct for House so all votes are equal.
@ForecasterEnten whoops got that @ wrong.
@threadreaderapp unroll