
Thread: "How to predict #coronavirus trends with Kinematics of Epidemics?"
On Apr 4, I made a spot-on prediction for US #COVID deaths by Apr 12 (~20k).
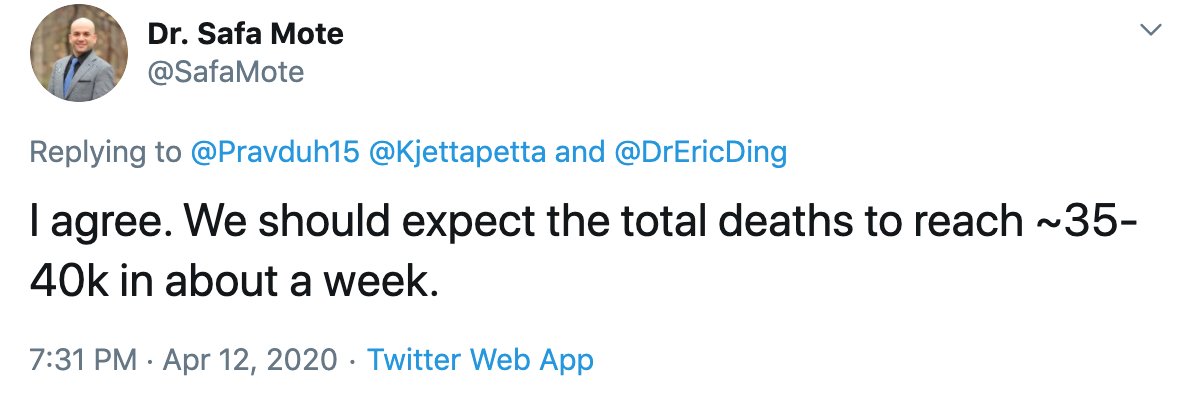
My prediction on Apr 12 for today, Apr 19, was ~35–40k deaths.
It proved accurate AGAIN. Sadly.
1/
On Apr 4, I made a spot-on prediction for US #COVID deaths by Apr 12 (~20k).
My prediction on Apr 12 for today, Apr 19, was ~35–40k deaths.
It proved accurate AGAIN. Sadly.
1/
A quick review of the basics.
The first subject area that is taught in Physics is Classical Mechanics. It was also historically the first area of Physics, mainly developed by Galileo (1564–1642) and Newton (1642–1727).
3/
The first subject area that is taught in Physics is Classical Mechanics. It was also historically the first area of Physics, mainly developed by Galileo (1564–1642) and Newton (1642–1727).
3/
Classical Mechanics describes motion of macroscopic physical objects traveling at speeds much slower than the speed of light. It essentially describes every motion in our daily lives:
walking, running, football, baseball, car, airplane, spacecraft, satellites, moon, Earth.
4/
walking, running, football, baseball, car, airplane, spacecraft, satellites, moon, Earth.
4/
In contrast, Relativistic Mechanics describes motion of objects moving at speeds comparable to the speed of light or in very strong gravitational fields, e.g., S2:
& Quantum Mechanics describes motion of microscopic particles, e.g., atoms, electrons.
5/
& Quantum Mechanics describes motion of microscopic particles, e.g., atoms, electrons.
5/
Classical Mechanics has two branches: Kinematics & Dynamics.
Kinematics studies the motion itself, without considering its causes.
Dynamics studies the causes of motion.
Newton's 2nd law of motion, often expressed as F=ma (Force= mass × acceleration), is a law of dynamics.
6/
Kinematics studies the motion itself, without considering its causes.
Dynamics studies the causes of motion.
Newton's 2nd law of motion, often expressed as F=ma (Force= mass × acceleration), is a law of dynamics.
6/
Galileo(1564–1642), Tycho Brahe (1546–1601), Kepler (1571–1630), & others had studied kinematics, especially of the planets. That paved the way for Newton (1642–1727) to establish the laws of dynamics in his book Principia (1687), and his famous inverse square law of gravity.
7/
7/
In Kinematics, the focus is essentially on three variables: distance, velocity (speed), and acceleration. These three variables are closely related:
Velocity is the rate of change of distance, and acceleration is the rate of change of velocity.
8/
Velocity is the rate of change of distance, and acceleration is the rate of change of velocity.
8/
The rate of change is called derivative in Calculus. (Newton invented Calculus to mathematically describe motion.) It is essentially the slope of a curve.
Graphs by C.R. Nave in the link below nicely summarize kinematics.
hyperphysics.phy-astr.gsu.edu/hbase/Mechanic…
9/
Graphs by C.R. Nave in the link below nicely summarize kinematics.
hyperphysics.phy-astr.gsu.edu/hbase/Mechanic…
9/
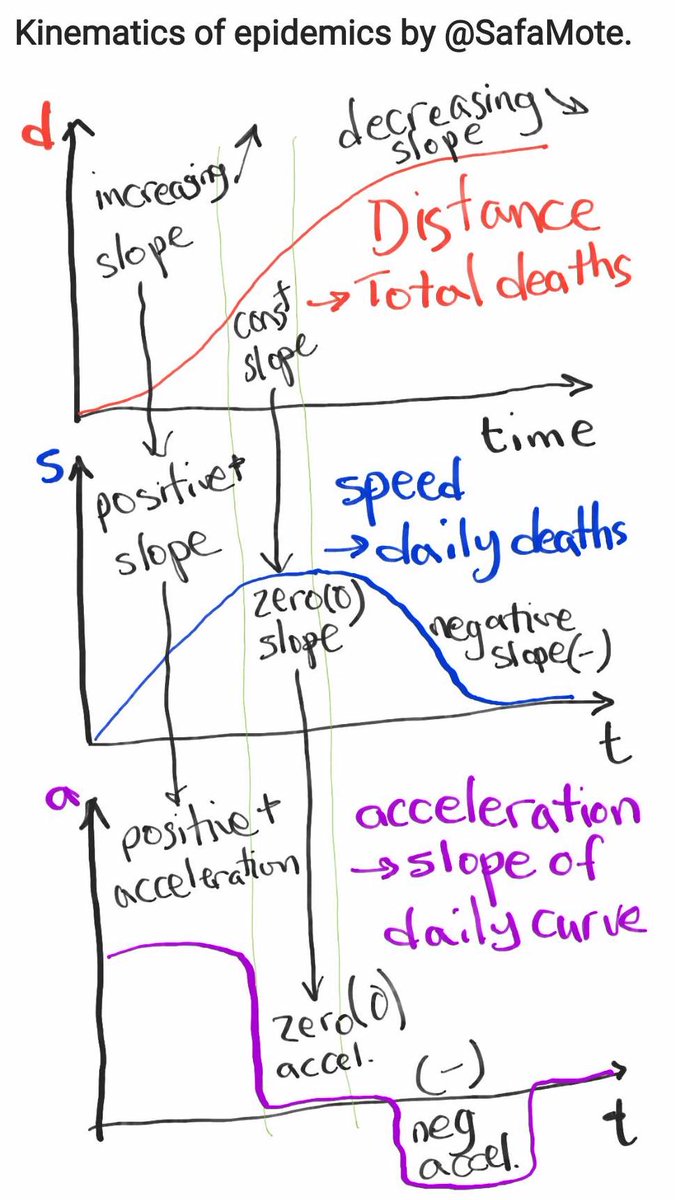
I am introducing the Kinematics of Epidemics by making the following analogies:
Distance: Total deaths
Velocity (Speed): Daily deaths
Acceleration: Rate of change (slope) of daily deaths
(Sorry for the poor figure below, hand-drawn on my phone.)
10/
Distance: Total deaths
Velocity (Speed): Daily deaths
Acceleration: Rate of change (slope) of daily deaths
(Sorry for the poor figure below, hand-drawn on my phone.)
10/
These analogies work similarly with cases instead of deaths.
Deaths are generally more accurately counted than cases, even though large uncertainties still remain for deaths.
11/
Deaths are generally more accurately counted than cases, even though large uncertainties still remain for deaths.
11/
Since velocity is the slope of distance, to calculate the change in distance we multiply velocity by the time step (one day in case of epidemics). Then we add these changes.
In calculus, this is called an integral (sum), equivalent to the area under the curve.
12/
In calculus, this is called an integral (sum), equivalent to the area under the curve.
12/
Similarly, to calculate the change in total deaths, we simply multiply daily deaths (velocity) by one day (time step), and sum over the days.
13/
13/


But there are always uncertainties in projections, so I added a typical ~7% uncertainty:
37.5 +/- 2.5k = 35–40k.
That estimate was again spot-on. Although today's count is on the high side of this range, ~39k deaths.
17/
37.5 +/- 2.5k = 35–40k.
That estimate was again spot-on. Although today's count is on the high side of this range, ~39k deaths.
17/
New York has just started a slow deceleration after 6 weeks of lockdowns.
Washington State has been in a plateau over the past 2 weeks.
TX, CA, MA are still accelerating.
IL, MI seem to be slowly entering a plateau.
Note the long DELAY/LAG effect:
20/
Washington State has been in a plateau over the past 2 weeks.
TX, CA, MA are still accelerating.
IL, MI seem to be slowly entering a plateau.
Note the long DELAY/LAG effect:
20/

Because of these long delays between infections and deaths curves — which I'd call DEATHS MOMENTUM — it would take many more weeks before we reach daily deaths under 10.
In particular, the deceleration rate that was reported in #Wuhan has not been observed anywhere else.
21/
In particular, the deceleration rate that was reported in #Wuhan has not been observed anywhere else.
21/
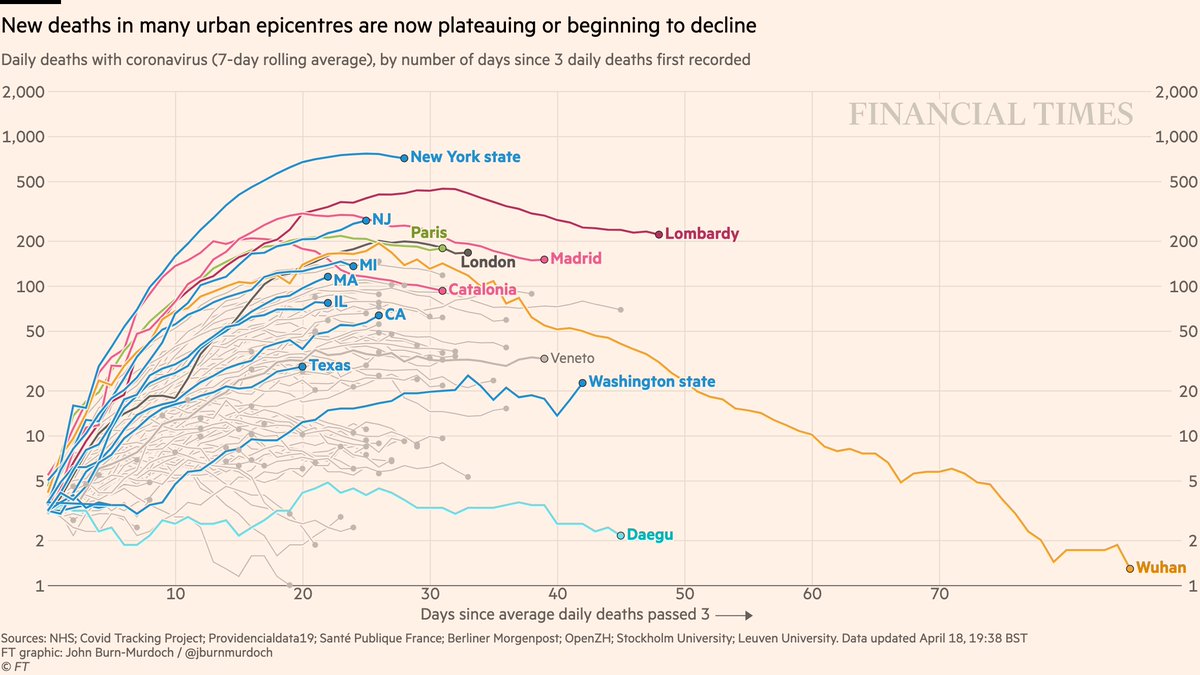
If current trends continue, NYS would not reach below ~10 deaths per day until mid June.
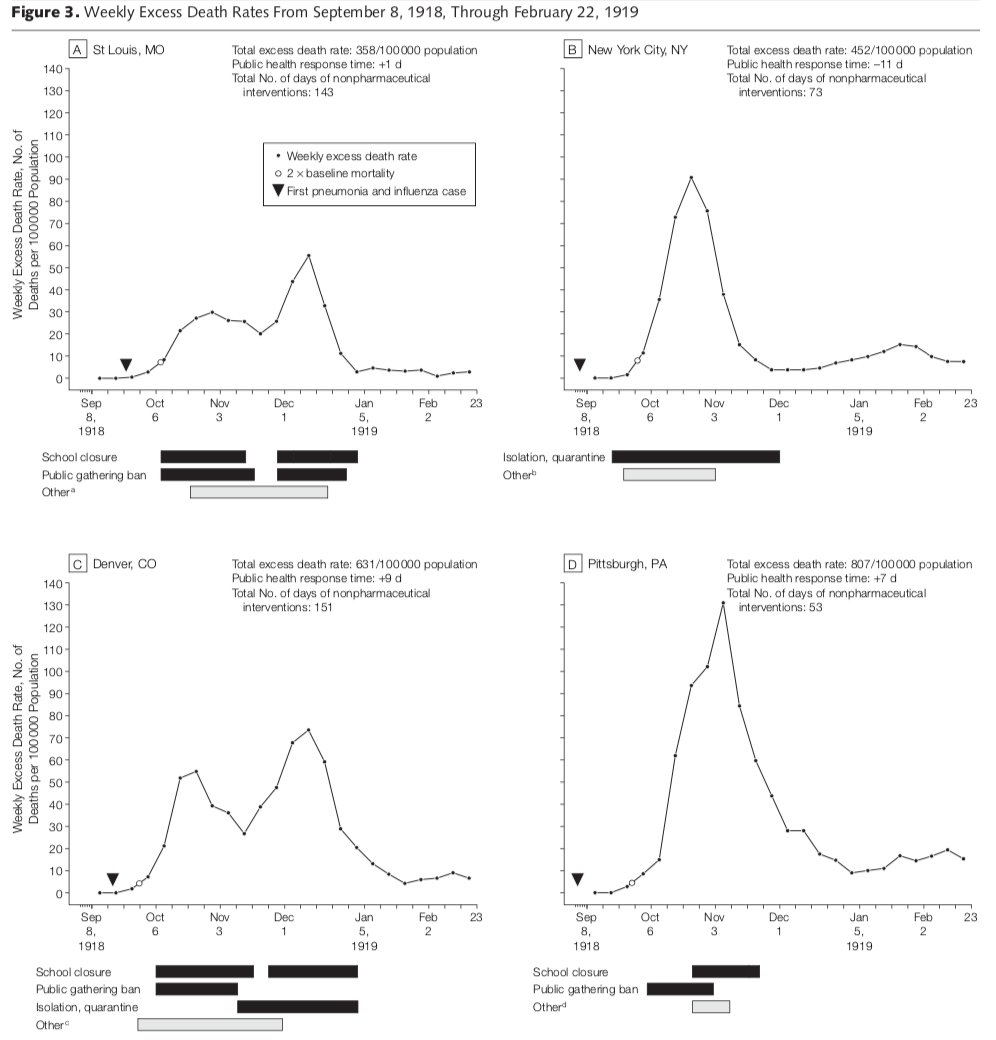
Rushed reopening can cause a return to acceleration (upward slope). And since we will be starting at larger daily values, the second peak could become much larger than the first peak.
22/
Rushed reopening can cause a return to acceleration (upward slope). And since we will be starting at larger daily values, the second peak could become much larger than the first peak.
22/
A larger second peak was observed in 1918–19 in St Louis & Denver during the Spanish Flu.
Figure from Markel et al., 2007. “Nonpharmaceutical Interventions Implemented by US Cities During the 1918–1919 Influenza Pandemic.” JAMA 298 (6): 644–54.
doi.org/10.1001/jama.2….
23/
Figure from Markel et al., 2007. “Nonpharmaceutical Interventions Implemented by US Cities During the 1918–1919 Influenza Pandemic.” JAMA 298 (6): 644–54.
doi.org/10.1001/jama.2….
23/
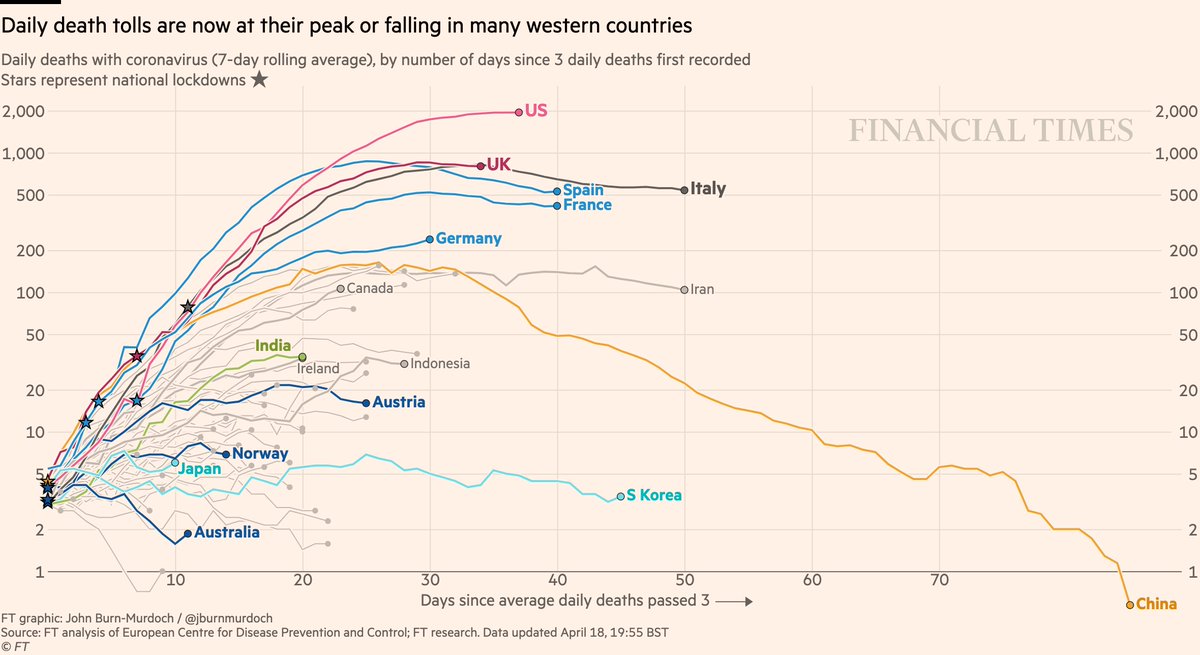
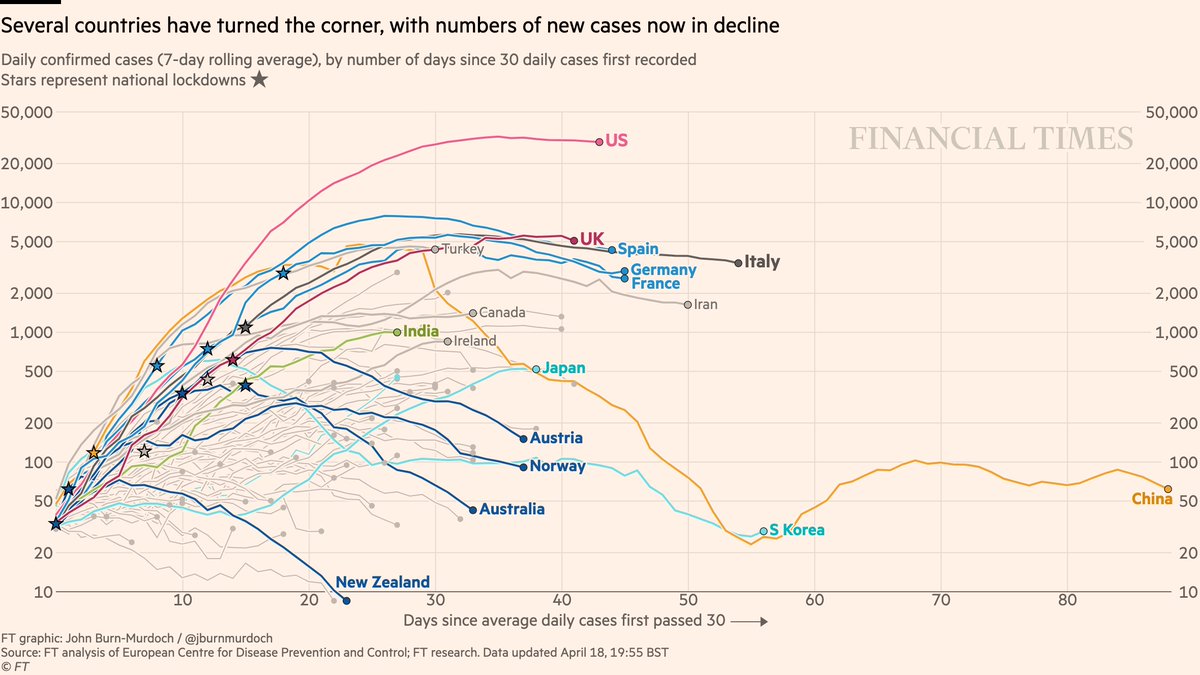
How about daily new cases?
Deceleration is substantial in #NewZealand, #Australia, #Norway, #Austria; moderate in #Germany, #Spain, #France; small in #Italy;
Almost no deceleration in the US & UK.
24/
Deceleration is substantial in #NewZealand, #Australia, #Norway, #Austria; moderate in #Germany, #Spain, #France; small in #Italy;
Almost no deceleration in the US & UK.
24/
So, from all aspects, the US & UK are FAR from ready to go back to "business as usual".
We will need to continue lockdowns until we see a substantial decline in these swollen curves.
25/
We will need to continue lockdowns until we see a substantial decline in these swollen curves.
25/
Currently, only a small fraction of people in the US are infected (<1%). So, it is not surprising that many people think #COVID is not a big deal, because after all the news, they are still not infected.
26/
26/
But the large count of current #coronavirus carriers, plus the MOMENTUM of INFECTION, means that those people who feel it's ok to reopen now would probably get infected during a new acceleration phase.
27/
27/
So, we should all carefully and rationally rethink the numbers, scales, & trends before we make an emotional argument for "reopening".
28/
28/
My apologies for this long thread on Kinematics of the #coronavirus Epidemic. I tried to summarize 2 weeks of lectures into < 30 tweets.
A big thanks to @FT and @jburnmurdoch for making their excellent plots freely available.
29/
/end
A big thanks to @FT and @jburnmurdoch for making their excellent plots freely available.
29/
/end

