
On Mar 24, we had ~800 #COVID deaths in the US. On Apr 4, when the count was at ~8,000, I predicted ~20,000 deaths by Easter Sunday, Apr 12.
My prediction was spot on. Current tally is 20,600.
1/
My prediction was spot on. Current tally is 20,600.
1/
In this PEDAGOGICAL thread, I will explain how I came up with this number. This thread is not meant for systems experts.
I became interested in, and very concerned about, the spread of #coronavirus since January 2020, when I saw the initial datasets from #Wuhan.
2/
I became interested in, and very concerned about, the spread of #coronavirus since January 2020, when I saw the initial datasets from #Wuhan.
2/
I am an applied mathematician, and I specialize in modeling dynamic systems, besides other things. I am not an epidemiologist, but the spread of infectious diseases are governed by the same mathematical rules that govern dynamical systems in general.
3/
3/
So the same mathematical principles that I had previously applied in my research to model other systems, such as weather, climate, water, energy, population, etc, applies here.
Ex: one of my papers below, in Science, on modeling climate feedbacks:
doi.org/10.1126/scienc…
4/
Ex: one of my papers below, in Science, on modeling climate feedbacks:
doi.org/10.1126/scienc…
4/
Some definitions first.
Dynamical System: A system of interconnected variables that evolves over time. Ex: pendulum; electric circuit; infectious disease; weather; the Solar System.
5/
Dynamical System: A system of interconnected variables that evolves over time. Ex: pendulum; electric circuit; infectious disease; weather; the Solar System.
5/
State Variable: a quantifiable property of the system that evolves over time through interaction with other parts of the system. Ex: angle of a pendulum; current through a circuit; number of infected/deceased/recovered pts; temperature, rainfall; position/velocity of planets.
6/
6/
State Variables evolve based on Flows into them minus Flows out of them. Ex: Change in COVID cases in a region (State Variable) is given by daily new infections (inflow) minus daily recovered (outflow), minus daily deaths (outflow).
7/
7/
Parameters: quantities that determine the rates of flows in the system, as well as the interactions among variables. Ex: Earth's gravitational acceleration (pendulum); disease transmission (R_0) & fatality rates, # of hospital & ICU beds (infectious disease).
8/
8/
Auxiliary Variables are variables that do not evolve independently, but are rather determined as a mathematical function of State Variables. Ex: deaths per capita = total deaths / total population; Reinfections = Recovered pts (State Var) ✕ reinfection rate;
9/
9/
In a pure physical/natural system, such as a pendulum, or the Solar System, evolution is determined purely by physical laws and interactions. By contrast, in coupled human-natural systems, POLICIES and DECISIONS play a CENTRAL ROLE.
10/
10/
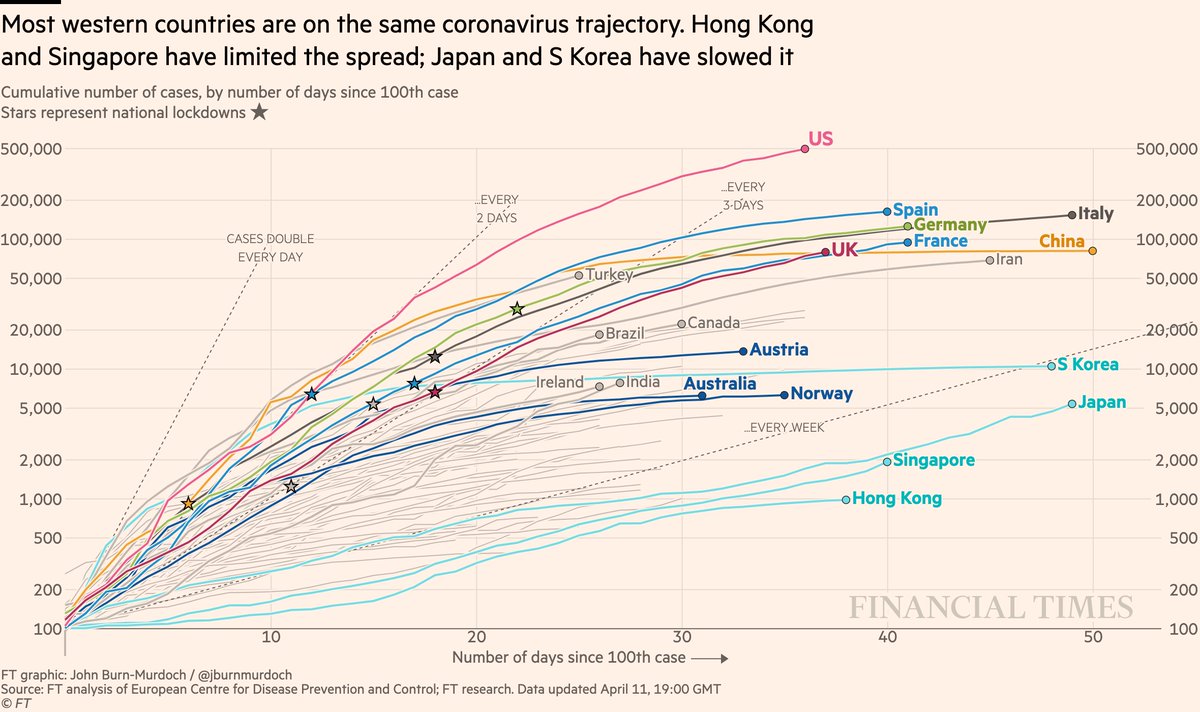
This is why different countries evolved on very different paths in this pandemic.
#Taiwan managed to CONTAIN the virus and keep the total infections very low (385).
#Singapore, #HongKong, & #NewZealand followed a similar path.
11/
#Taiwan managed to CONTAIN the virus and keep the total infections very low (385).
#Singapore, #HongKong, & #NewZealand followed a similar path.
11/

#SouthKorea's infections reached several 1000s, thus they had to impose strict lockdowns to stop further spread. But daily new cases are now very small (~<50).
#Japan, #Australia, #Norway, #Finland, #Austria might be able to follow a similar path.
12/
#Japan, #Australia, #Norway, #Finland, #Austria might be able to follow a similar path.
12/

This also explains the debate in the recent literature about values for transmission (R_0) & (case) fatality (CFR) rates. These are not physical constants, like Earth's gravitational pull (g), but rather parameters that depend heavily on specific countries & their POLICIES.
14/
14/
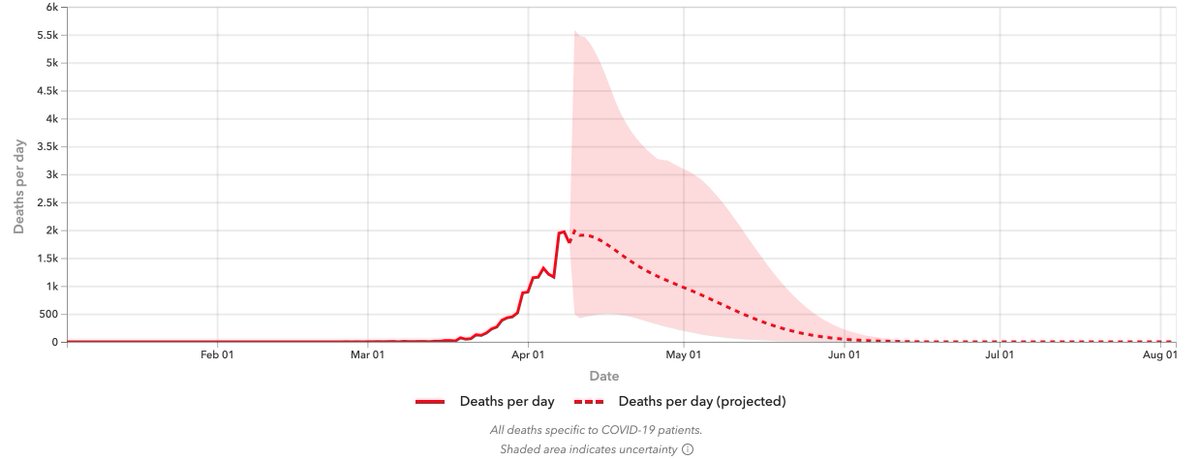
Heavy dependence on DECISIONS & POLICIES are also responsible for a portion of the large uncertainties in epidemiological models. See example below from IHME @UW.
15/
15/
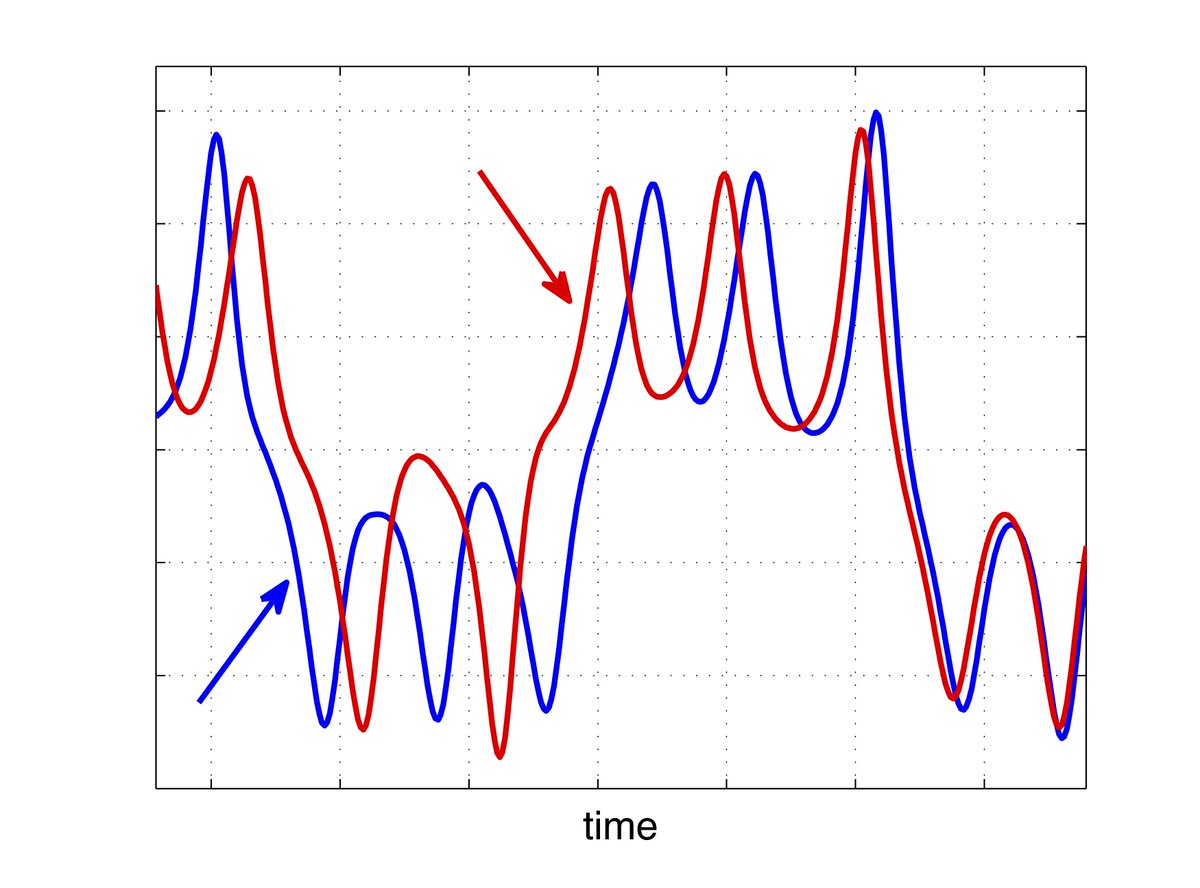
Another important ubiquitous concept in dynamical systems is DELAY. Fig below shows state variables that may LEAD or LAG one another.
The #coronavirus has up to a 14 day incubation period. Then ~ two weeks of general symptoms (fever, fatigue, cough, etc).
16/
The #coronavirus has up to a 14 day incubation period. Then ~ two weeks of general symptoms (fever, fatigue, cough, etc).
16/
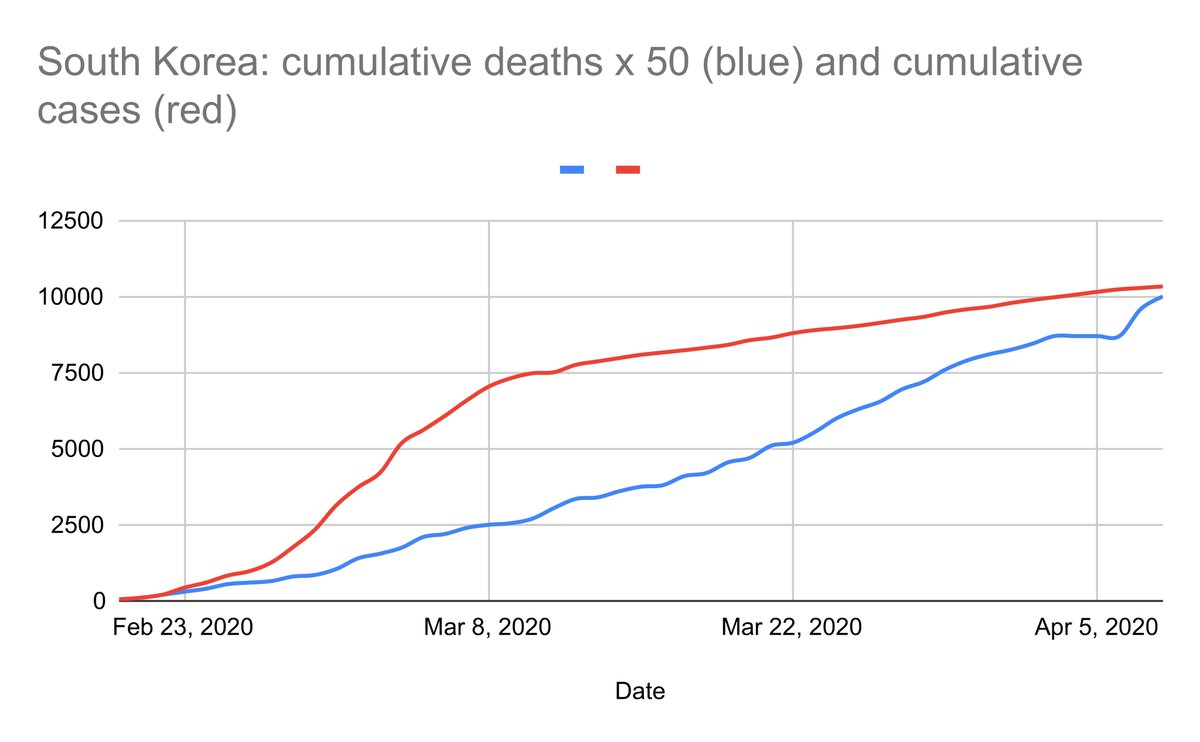
But once the virus finds its way into lungs, the illness can continue for another several weeks before recovery or death. This means SEVERAL WEEKS OF DELAY BETWEEN INFECTIONS & DEATHS CURVES.
Ex below from S. Korea.
17/
Ex below from S. Korea.
17/
The spread of an infectious disease before widespread immunity is governed mainly by exponential growth. This uncontrolled spread could be prevented by CONTAINMENT (as in #Taiwan) or MITIGATION (#SouthKorea). Also, vaccination could prevent this exponential spread.
18/
18/
Assuming an average transmission interval of 1 week, with a transmission rate of 1.3 (#flu), we get 1.3^ 16 = 66 infections after 16 weeks.
19/
19/
But with R_0 = 2.6 (lower estimate for #coronavirus), we get 2.6^16 = 4.3 Million. So, a doubling of the transmission rate (1.3 vs 2.6) does not translate to twice as many cases, but rather millions more infections.
20/
20/
I believe this EXPONENTIAL GROWTH was the factor that confused many people, even some public health experts, in the early months of the #coronavirus epidemic, hence they missed to foresee the coming tide.
21/
21/
Now to my specific prediction for the US.
I did not build or use a sophisticated dynamic model for #COVID. We knew that interventions started late in the US. And that there is a ~4 week delay between the onset of lockdowns (March in US) and slowdown of exponential growth.
22/
I did not build or use a sophisticated dynamic model for #COVID. We knew that interventions started late in the US. And that there is a ~4 week delay between the onset of lockdowns (March in US) and slowdown of exponential growth.
22/
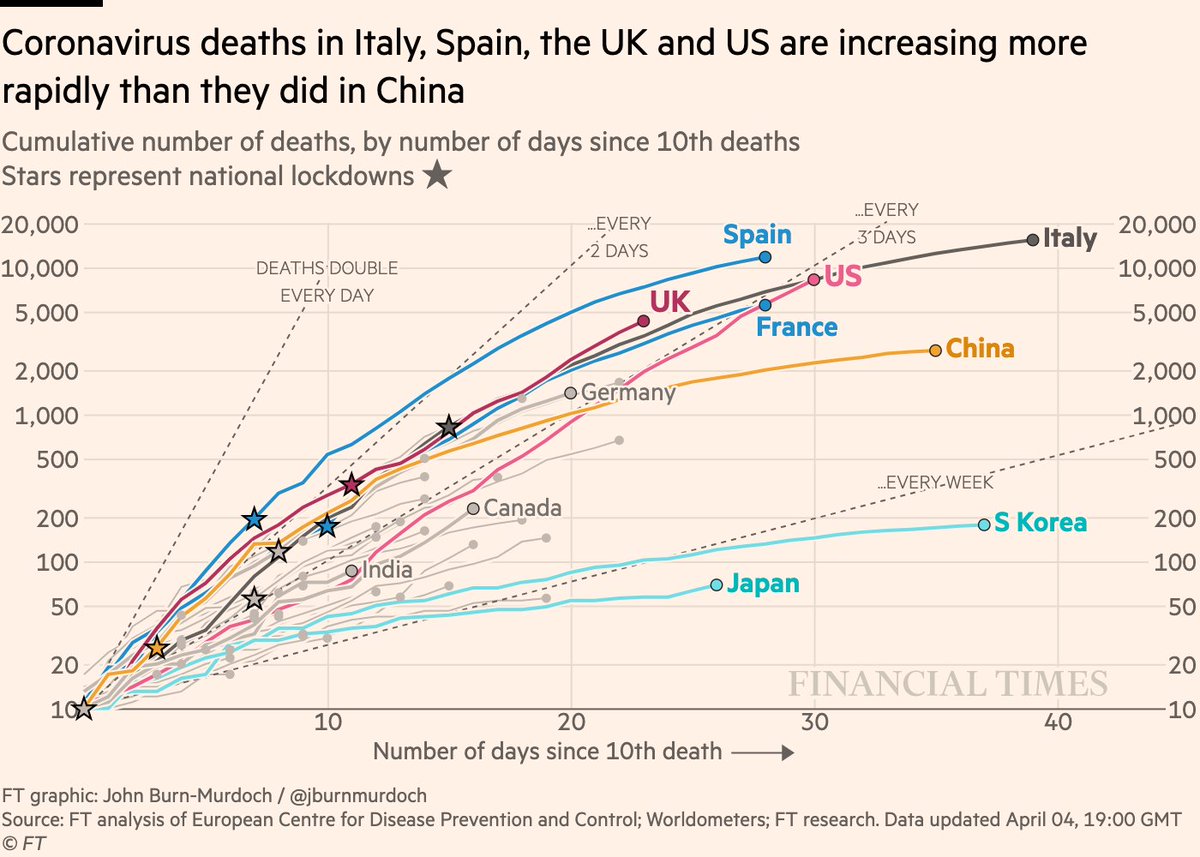
So, I used the log-scale plot below from Apr 4, and extrapolated the exponential curve, which becomes a straight line on a log-scale plot. With an average doubling time of ~6 days:
8,000 * 2 ^ (8/6) = 20,100.
23/
8,000 * 2 ^ (8/6) = 20,100.
23/
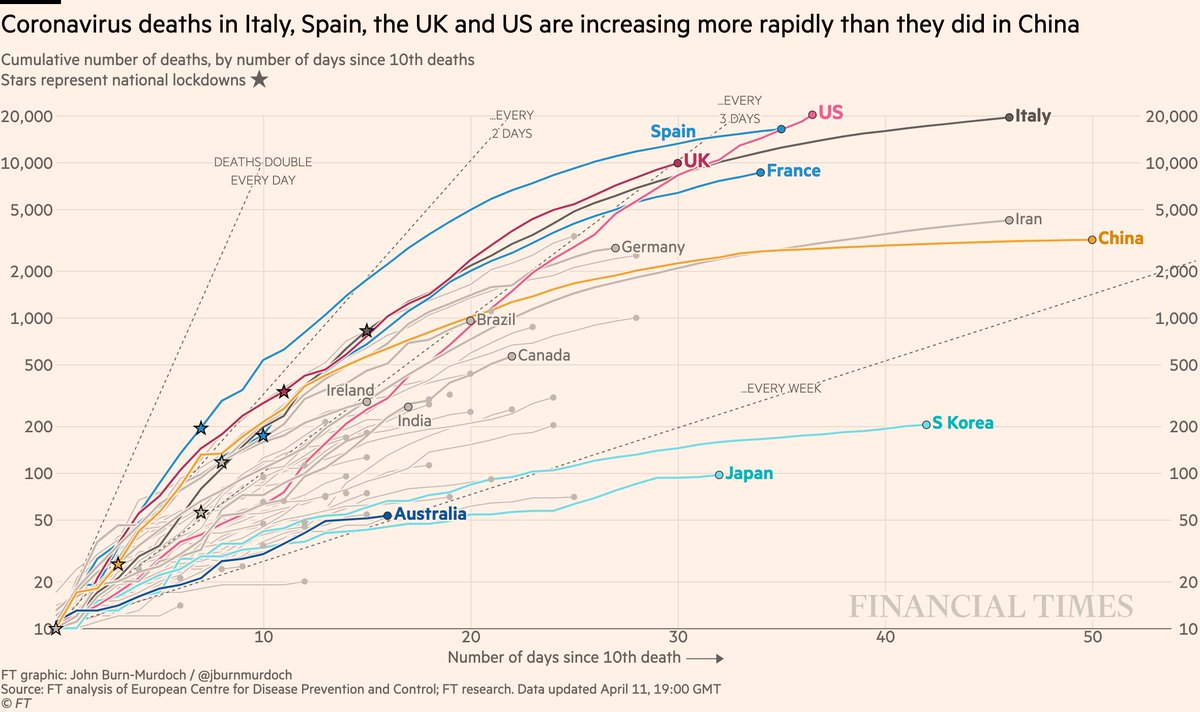
For comparison, below is a plot for the cumulative deaths up until today. We can see that the US has indeed continued its exponential growth over the past 10 days or so, with a doubling time of about 6 days. The growth is slowing down just a bit.
24/
24/
What are the future trends?
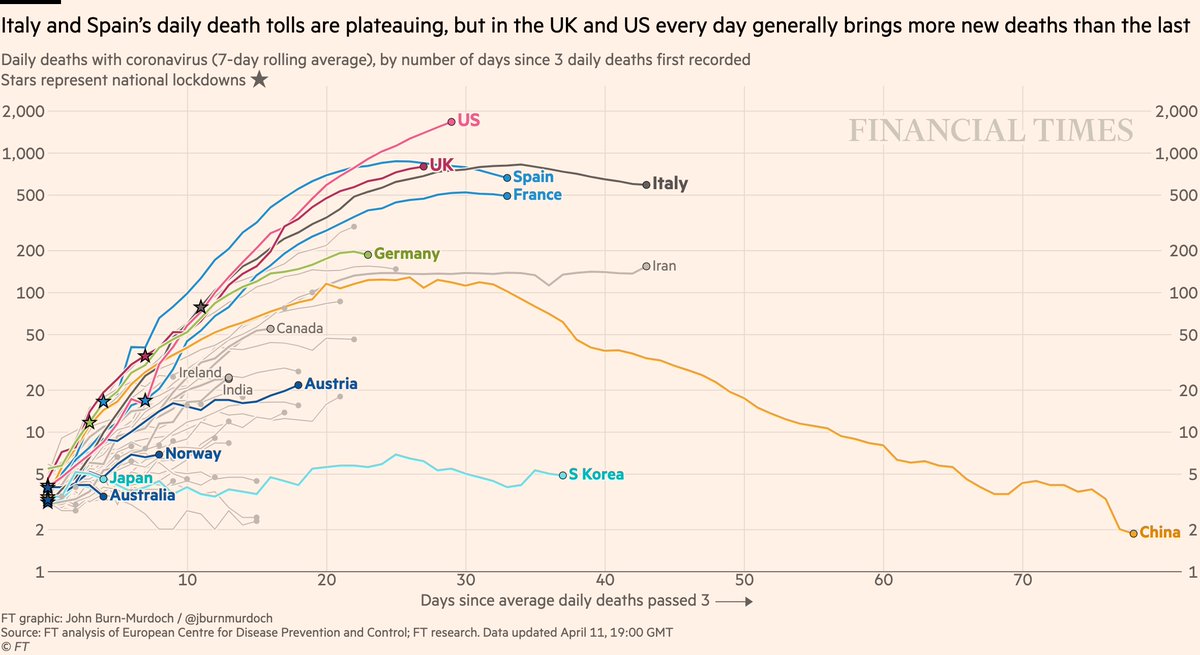
Below is a plot of daily deaths. Daily data are fuzzy, so one has to plot a rolling (or running) average instead, i.e., average of a time-series over a window of several days (7 days below.)
25/
Below is a plot of daily deaths. Daily data are fuzzy, so one has to plot a rolling (or running) average instead, i.e., average of a time-series over a window of several days (7 days below.)
25/

The slope (called "derivative" in Calculus) of the daily curve shows the changes in daily deaths.
+ : increasing
~0 : plateau
– : decreasing
26/
+ : increasing
~0 : plateau
– : decreasing
26/
Here is an analogy for those who remember High School or College Physics:
#Kinematics | #Epidemics
Acceleration | Slope of Daily Deaths
Velocity | Daily Deaths
Distance | Cumulative Deaths
27/
#Kinematics | #Epidemics
Acceleration | Slope of Daily Deaths
Velocity | Daily Deaths
Distance | Cumulative Deaths
27/
#SouthKorea, #Japan, #Australia, #Norway, #Germany have managed to keep the slopes of their daily deaths curves ~ horizontal, i.e., small or no growth in daily deaths, ~0.
#Italy & #Spain grew to large daily numbers but now have – slopes.
#US & #UK: still increasing, +.
28/
#Italy & #Spain grew to large daily numbers but now have – slopes.
#US & #UK: still increasing, +.
28/
#Taiwan, #Singapore, #NewZealand, #HongKong are not even on the daily deaths graph since they acted EARLY and EFFECTIVELY, which led to SUCCESSFUL CONTAINMENT that avoided large daily death tolls.
Below daily cases plot w Singapore & Hong Kong:
29/
Below daily cases plot w Singapore & Hong Kong:
29/

Like #Wuhan and #SouthKorea, we have to continue until daily new cases reach near zero. After that, a strict containment with testing, contact tracing, and isolation of patients could allow the country to re-open. But that has to be done VERY CAREFULLY & SLOWLY.
31/
31/
Why do I focus on deaths?
#COVID deaths provide a more robust indicator of disease spread than cases, because identifying cases depends on the extent of testing, as it happened in many countries, including the US.
We had many cases in the US, but they were undetected.
32/
#COVID deaths provide a more robust indicator of disease spread than cases, because identifying cases depends on the extent of testing, as it happened in many countries, including the US.
We had many cases in the US, but they were undetected.
32/
There are uncertainties in deaths too, but generally much smaller than uncertainties in cases, say, a factor of ~2 (for countries that do not purposefully hide their real death toll).
See, e.g., NYC and Bergamo:
33/
See, e.g., NYC and Bergamo:
33/
I apologize for this very long thread. I tried to summarize a 3 hour lecture into 30-40 tweets. Would be glad to answer any questions.
A big thank you to @FT #COVID Team and @jburnmurdoch for creating & updating their excellent plots, which I frequently use in my tweets.
34/
A big thank you to @FT #COVID Team and @jburnmurdoch for creating & updating their excellent plots, which I frequently use in my tweets.
34/
I would also like to thank the international team of volunteers at @COVID2019app, led by @jodigraphics15 & managed by @hectorology, who have worked really hard to collect and update an open database for #COVID, which provides daily global #coronavirus data.
CC: @AydenLincoln
CC: @AydenLincoln

