Apurva Sheth, CMT Profile picture
May 26, 2020 9 tweets 8 min read Read on X
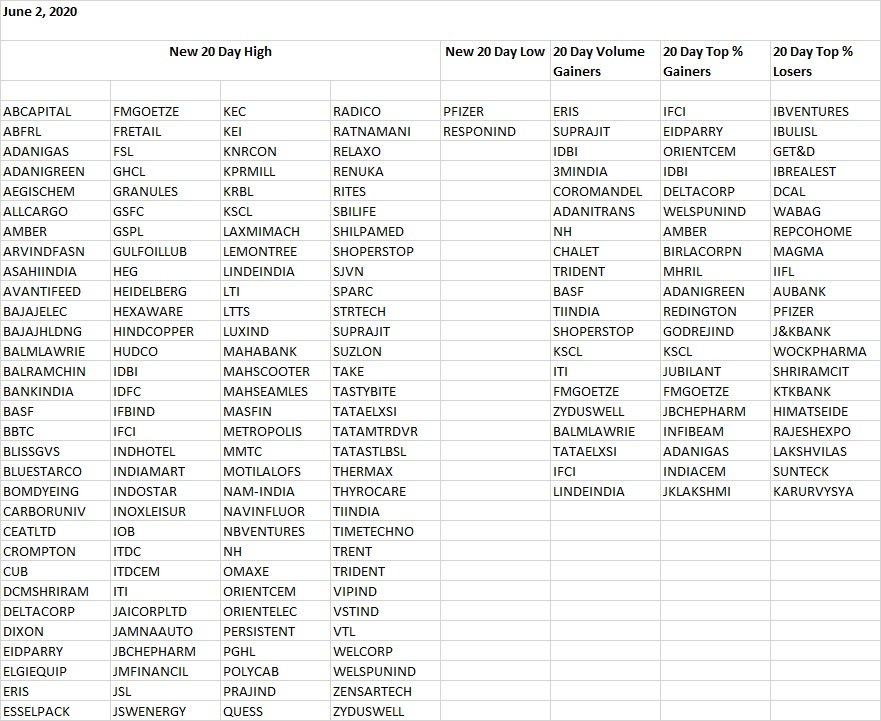
Introducing the #T20list

This list covers #CNX500 stocks but excludes F&O stocks from the study

stocks at new 20Day highs or lows suggest range #breakout

20Day volume gainers indicate #action

top 20Day % gainers & losers suggests #momentum Image
#Locustsattack could lead to a #bounty for #agrochemical companies

Smaller #cement stocks are gaining interest. Watch out.

#stockstowatch #howtotrade #trading #T20list


My video on how the #T20list can help traders identify #stockstotrade
Agro-chemical and cement stocks continue to dominate the #T20list as most of them gain ground today.

#stockstowatch #howtotrade Image
PSU Stocks Gain Interest

Notice the PSU’s I have marked in bold in today’s #T20list. 3 PSU stocks are featuring in the new 20 day highs and volume gainers list. Several PSU stocks apart from them also gained ground today. Watch out for more action in the days to come. Image
Financial services is a theme which is emerging from today’s #T20list. You can notice stocks marked in bold from industries like credit rating agencies, mutual funds, insurance, depositories, commodity and energy exchange. Keep a close eye on them. Image
Buyers Spoilt for Choice

The highlighted stocks in new 20 day high and top 20 day % gainers list are also in the top 20 day volume gainers list. These stocks have both price action and volume working in their favour.

#T20list Image
124 stocks out of 350 breakout above their 20d highs.
Its a difficult choice but u must go with fundamentally strong stocks. Don’t go too overboard. Markets normally throw surprises when nobody expects it. #T20list Image
The tally of stocks breaking out is rising consistently. Hope ur enjoying. However, I’d like 2 remind you to practice abundant caution now as many dud stocks have also started moving higher. So don’t fall for it. Choose only the best ones to trade and enjoy until the party is on. Image

• • •

Missing some Tweet in this thread? You can try to force a refresh
 

Keep Current with Apurva Sheth, CMT

Apurva Sheth, CMT Profile picture

Stay in touch and get notified when new unrolls are available from this author!

Read all threads

This Thread may be Removed Anytime!

PDF

Twitter may remove this content at anytime! Save it as PDF for later use!

Try unrolling a thread yourself!

how to unroll video
  1. Follow @ThreadReaderApp to mention us!

  2. From a Twitter thread mention us with a keyword "unroll"
@threadreaderapp unroll

Practice here first or read more on our help page!

More from @apurvansheth

Oct 19, 2020
Do you believe #markets are #cyclical in nature?
Do you think #history #rhymes, if not #repeats?
Do you agree #greed and #fear are two main forces in the market?
If answer of above Q's is yes then following tweets will solidify ur view if its a no then they will change ur view.
Above is a monthly chart of #Sensex. It goes through an alternating #greedandfear cycle of 8 years. Sensex moves up in greed phase and consolidates in fear phase. It was up 469% in greed phase of 1992. was up only 20% from 1992 to 2000. From 2000 to 2008 it was up 271%.
In fear phase of 2008 to 2016 it was up only 48%. #Sensex has entered greed phase in 2016 and will stay there till 2024. So far its up more than 50%. But the story doesnt end there. The sectors which move up during these phases also go through a cycle.
Read 22 tweets
Sep 28, 2020
Have you ever felt that you have lived the present situation before? Its called #Déjàvu. Right now I'm experiencing this moment in the markets. #PSUBanks are going through tough times. But this isnt new. They were in a similar situation back in 2016. (1/n)
#PSUBanks were dealing with NPA's and losses in Mar 2016. Their troubles are amplified after the #COVIDー19 outbreak. But it seems worst is over. Here's a weekly chart of #NiftyPSUBank index. (2/n) ImageImage
#PSUBanks are forming bullish divergence in #RelativeStrengthIndex(RSI) on weekly charts. #RSI is a momentum indicator. Bullish divergence in it indicates that ongoing downtrend is losing steam. It doesnt guarantee a reversal but increases the chances. (3/n) Image
Read 12 tweets
Aug 31, 2020
#Market #breadth is weak despite 100 point gap up in #nifty...quite unusual considering the recent rally in broader markets👀 Lets see if it catches up during the day
#Humptydumty #nifty had a great fall...is this the #top?
Declining stocks outweighed advances early in the day this was an indication of things to come.

#advancedecline #nifty #triplecentury Image
Read 5 tweets
Aug 28, 2020
I believe #ratio #charts are one of the most underrated and underutilized tools in #technicalanalysis. Do you agree?
Ever wondered which stock to chose between the two?

#HDFC or #HDFCBank?
#TCS or #Infosys?
#HeroMoto or #BajajAuto?
#ACC or #Ambuja?
#BPCL or #HPCL?
#BajajFinserv or #Bajajfinance?

But don't know whats the best approach to pick one?
#Ratio #charts can help you identify the best stock for #trading and #investment. You can plot a #ratiochart by dividing the price on one stock with another. Its preferable to divide the high priced stock with low priced one to get ratios greater than 1.
Read 13 tweets
Jul 6, 2020
I am building up on the concept of #RTM shared by @heartwon in this post -

#RTM = Short-Term Mvng Avg (5DEMA) / Longer-Term Mvng Avg (20 DEMA)

He adds another #RTM: 4 Week EMA / 12 Week EMA on the #charts to get a holistic view
So the two #RTM's work like a MACD except that an #MACD plots the absolute difference between 2 mvng avgs. But since we are dividing one avg with another in #RTM we can use it to compare one stock with another which we cant do in a MACD.
I have applied the concept of RTM on F&O stocks and come up with some insights. If the daily #RTM value is above the Weekly #RTM value then I define the trend as bullish. Then I calculate the difference between Daily and weekly #RTM's across F&O stocks. Image
Read 6 tweets
Jun 13, 2020
My friend @VMK100 sent me this insightful short note on mental fitness for traders by @normanhallett. I'm summarizing the points worth learning in this thread for the benefit of #trading community. Image
1. You've got a superb #tradingsystem...so why are you losing?

You are not in control of your #emotions.
2. Why are you not able to limit your losses and let your profits run?

You have been taking the losing personally which doesn't allow you to take losses.

It’s not about YOU. It’s about THE MARKET. If you don’t take your emotions out of it,
you don’t have a shot.
Read 20 tweets

Did Thread Reader help you today?

Support us! We are indie developers!


This site is made by just two indie developers on a laptop doing marketing, support and development! Read more about the story.

Become a Premium Member ($3/month or $30/year) and get exclusive features!

Become Premium

Don't want to be a Premium member but still want to support us?

Make a small donation by buying us coffee ($5) or help with server cost ($10)

Donate via Paypal

Or Donate anonymously using crypto!

Ethereum

0xfe58350B80634f60Fa6Dc149a72b4DFbc17D341E copy

Bitcoin

3ATGMxNzCUFzxpMCHL5sWSt4DVtS8UqXpi copy

Thank you for your support!

Follow Us!

:(