
Since the last rainfall forecast bulletin on Saturday, the forecast West Sahara rainfall burst has come and gone, and the forecast #ME/#HoA rainfall burst is now about to commence.
Today's rainfall forecasts for #NorthAfrica, #HornOfAfrica and #MiddleEast follow.
Today's rainfall forecasts for #NorthAfrica, #HornOfAfrica and #MiddleEast follow.
First an update on Western Sahara. The peak of the storms came overnight on Saturday morning. Here we see a 6 hour rainfall animation from 2.30am to 8.30am.
And here we see a wider view following sunrise on Saturday morning. If you are curious as to what was forecast Saturday's rainfall forecast thread is quoted below >>
https://twitter.com/althecat/status/1413890771741200386
The other area we were watching is on the eastern side side of the Sahara, across the Red Sea on the Arabian Peninsula. Again we have an update:
See, Saturday's #ArabianStorms below. Radar shows light rainfall in the #Jeddah - #Makkah area deep into the night
See, Saturday's #ArabianStorms below. Radar shows light rainfall in the #Jeddah - #Makkah area deep into the night
And then today (this is this afternoon we began to see what is coming from the Indian Monsoon burst & related phenomena discussed on Friday.
Significant amounts of cloud cover has started to form as atmospheric water moves in from the North East.
Significant amounts of cloud cover has started to form as atmospheric water moves in from the North East.
Pakistan hasn't featured in these forecasts before - but its relevant today as much of the moisture moving over the Arabian Peninsula is coming in over Pakistan. This 10-day rainfall animation for Pakistan shows a forecast of what rain is expected to fall in transit.
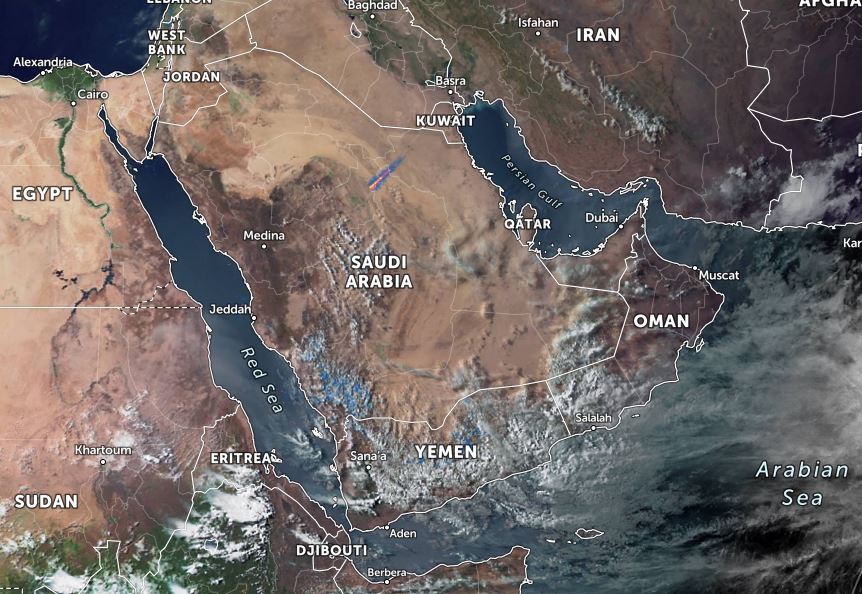
This wider angle view from satellite imagery today from @zoom_earth shows the beginning of this event this afternoon, as forecast.
This is a 16-day animation of what is expected. The first 5-7 days is probably fairly reliable beyond that significant change is possible. Note however (as we will show later in this thread) that all major models are in agreement about this rain event now.
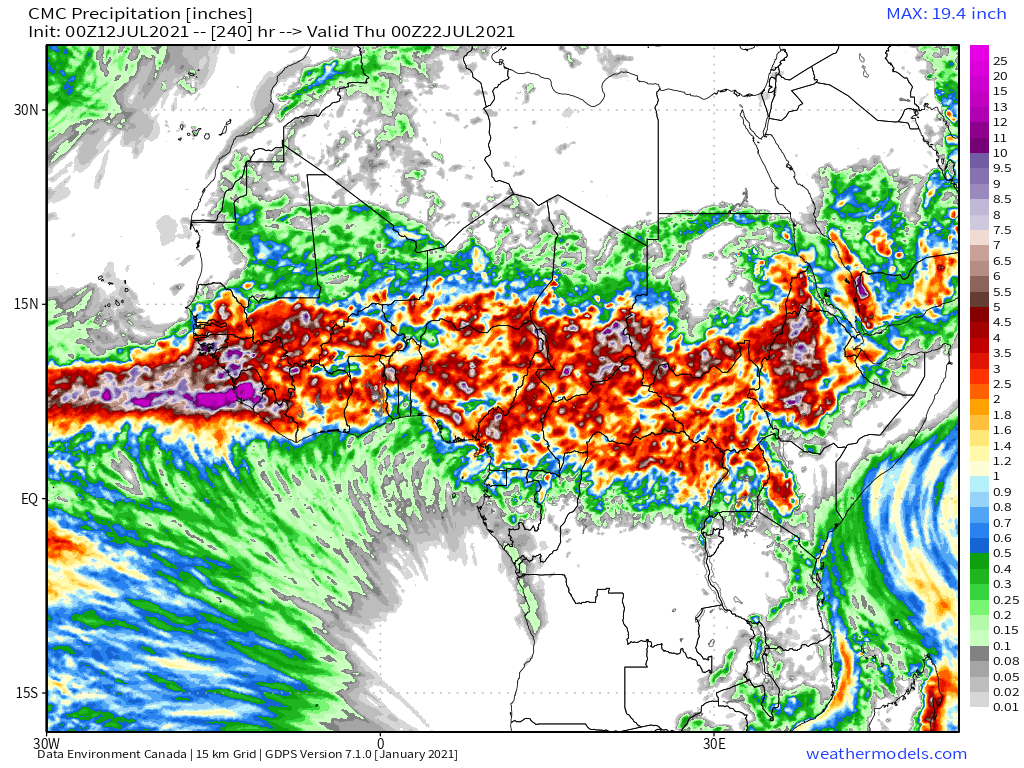
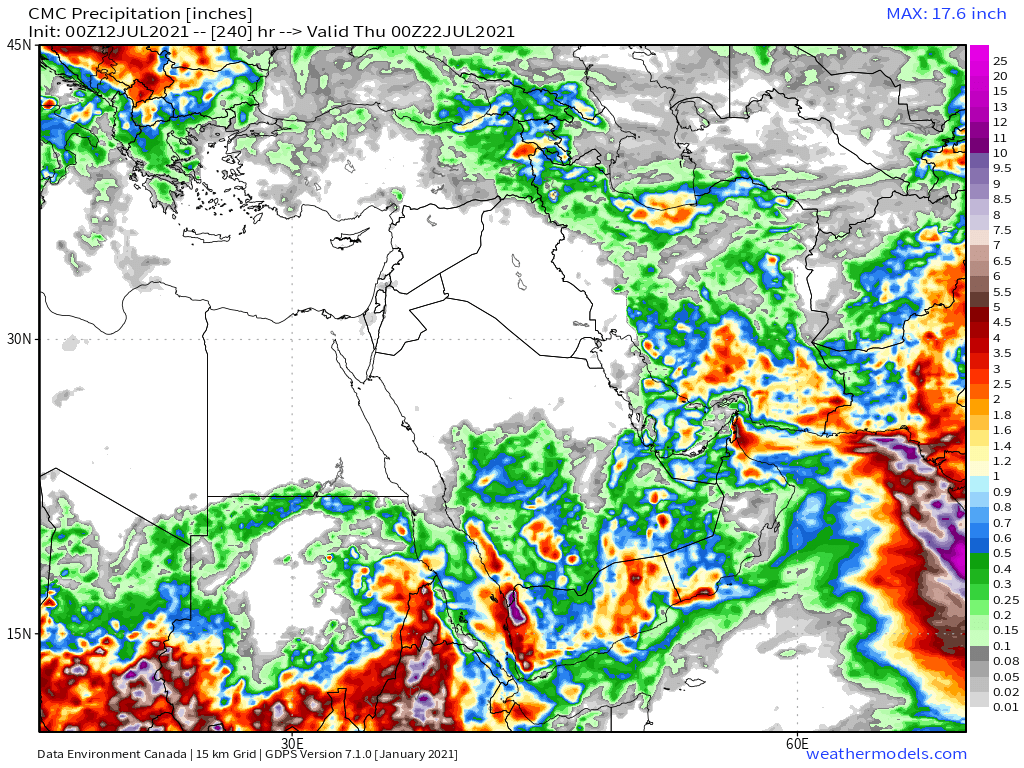
Here we see an accumulated rainfall forecast over 10 days from the Canadian CMC model. The CMC has been the most aggressive model in forecasting rain in the Middle East for the past few months. But even it has under-estimated the level of rain that has actually fallen.
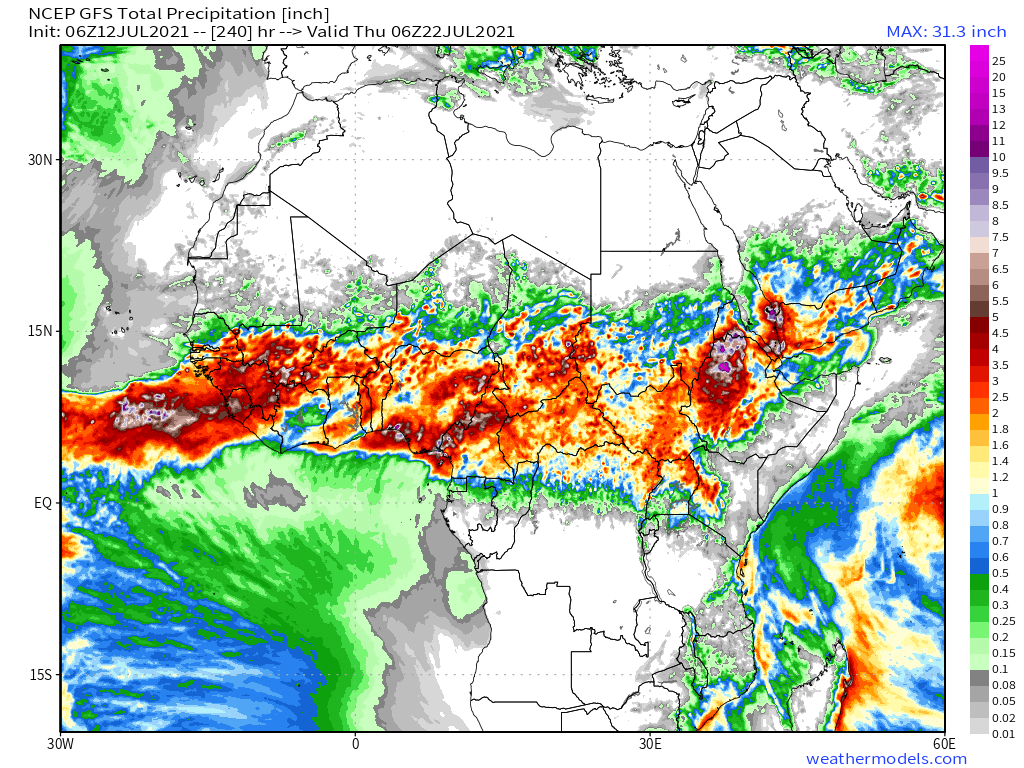
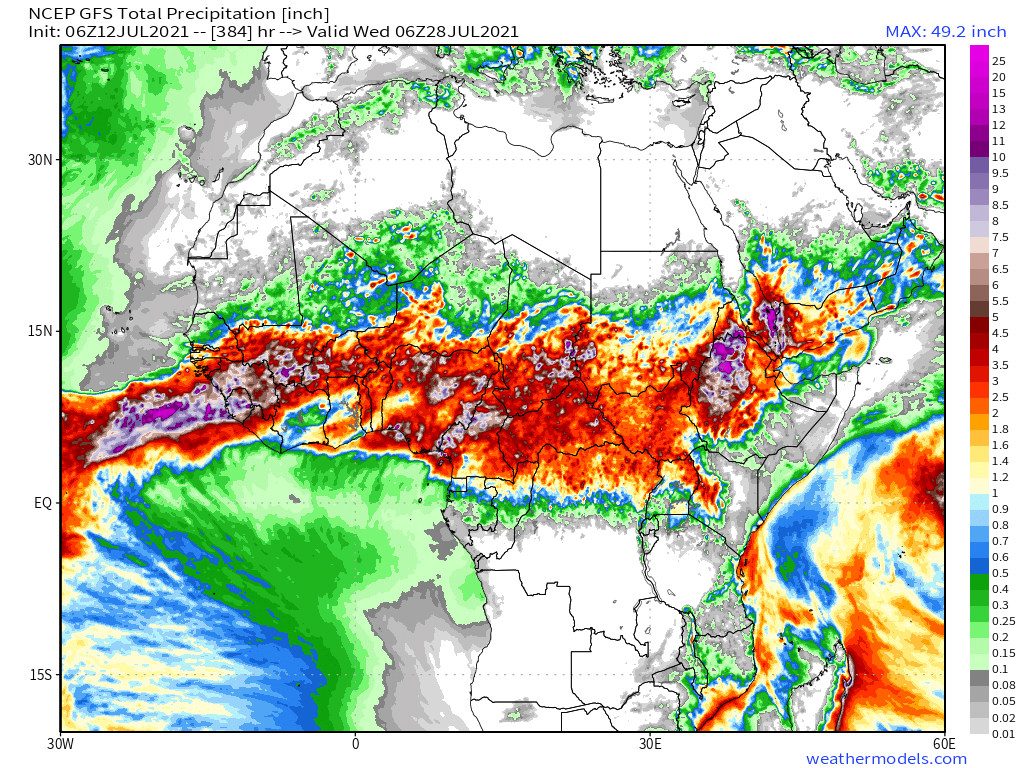
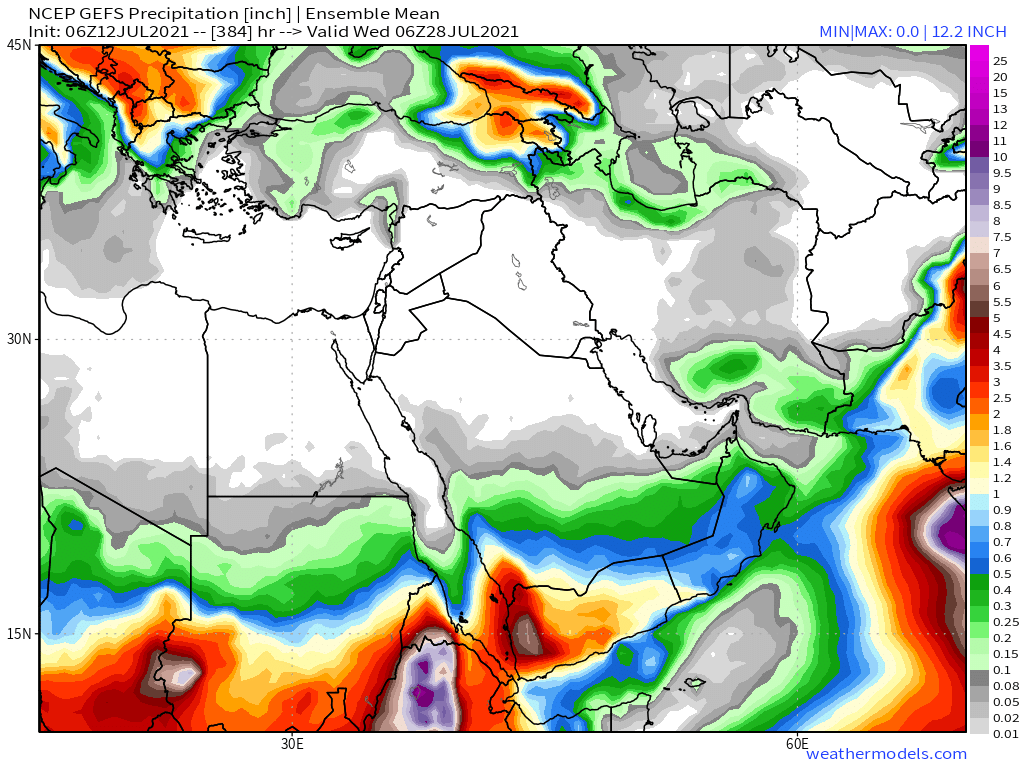
The better known (gold standard) @NOAA GFS weather model forecast is longer, 16 days, and not significantly different in terms of what it predicts. I.E. rain over more than half of the Arabian Peninsula over the next fortnight.
@NOAA Notably both of these models are also predicting rainfall which is closing in on the Chad border with Libya. This is deep desert #DesertRain, and the peak rainy season for the northern Sahel isn't due to start till August.
Here we see rainfall in Chad and Niger this am.
Here we see rainfall in Chad and Niger this am.
Here we see the CMC model's 10-day forecast for the whole of the Sahara which is predicting that the rainfall in the Western Sahara will continue. The KMA and GFS are in broad agreement with this prognosis.
This is remarkable in several respects. Historically rainfall in meaningful quantities north of the 15th parallel is rare, the rain that does fall generally falls June-September and the climate data can be found here >> earthwise.bgs.ac.uk/index.php/Clim… via @Wikipedia
@Wikipedia This sub-thread in my #WestAfricanMonsoon rainfall forecasts series a few days ago addressed this.
https://twitter.com/althecat/status/1412701866018938880
Unfortunately observational data on this from the ground is difficult to come by and the reports of flooding in Sudan referred to in ^^ this thread, while credible, turned out to be misinformation. However there was a very big storm in Sudan on this day.
Which brings us to the #GERD and rainfall inflows to the Abbay. What impact will the weather event that is underway bring to #Ethiopia and the #GERD, and the closely aligned weather systems across the Red Sea in #Yemen?
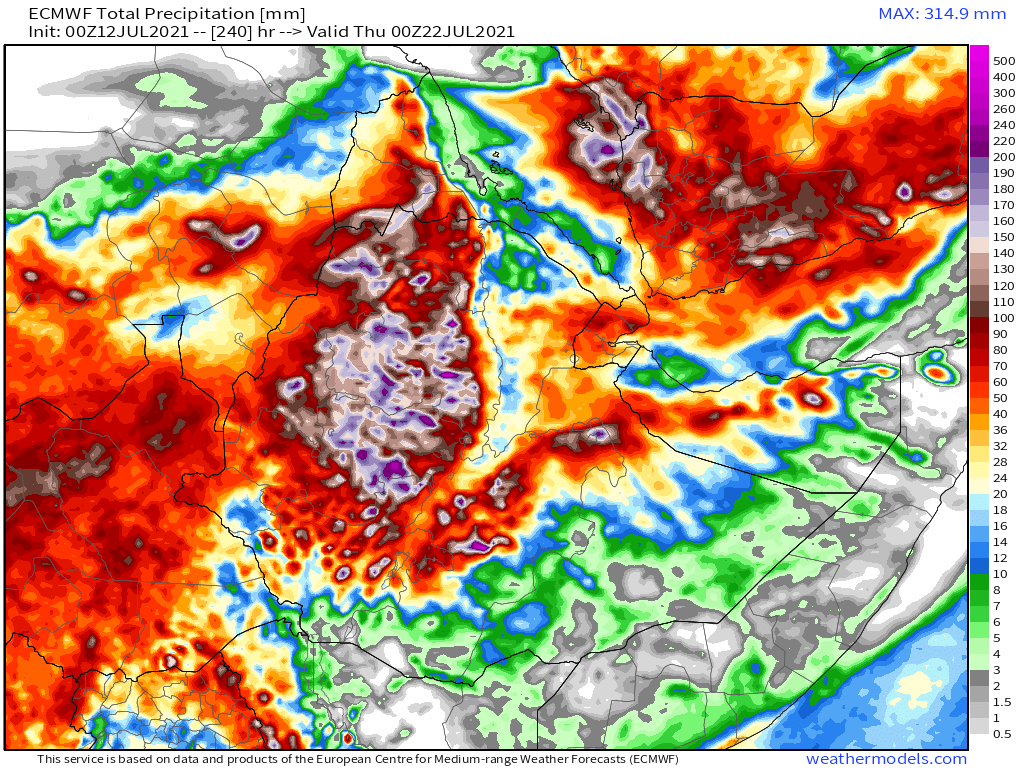
The KMA model which is the most aggressive rainfall forecast for the Horn of Africa. This forecast shows rainfall over a 12 day (288hr) period of up to half a meter of rain over all four of the main Nile basins: The White Nile, Abbay (Blue Nile), Abobbo and Tekeze catchments.
And the @NOAA GFS model has a similar view.
[NOTE this is not an official weather forecast: but these levels of rains on sodden ground are definitely flash flood producing and potentially lethal. Everyone living in this huge area will need to take care and stay on high ground.]
[NOTE this is not an official weather forecast: but these levels of rains on sodden ground are definitely flash flood producing and potentially lethal. Everyone living in this huge area will need to take care and stay on high ground.]
This animation shows how these rainfall forecasts are built up in six hourly increments. This is from the GFS model. Its accuracy for any given 6 hourly period beyond 24 hours is probably significantly questionable though.
Finally, before retuning to re regular content, it is worth looking at the bigger picture and what is causing this. Here we see a PWAR anomaly (i.e. a plot of where atmospheric water is significantly higher than normal for this time of year.
The plot covers a very wide area from China/Mongolia to India and SEA as well as the Middle East and parts of the horn. The water was we saw previously is flowing into the #ME and #HoA from the north east. And there is also a significant flow towards the north east.
Here is a counterpart image for the North Atlantic, Europe and Africa- albeit much shorter - only 120 hours vs 384 in the one above. This one illustrates the circular motion of the North western hemisphere water balance. Driven by the tropics but with complex dynamics.
In particular in this second animation you can see water flows coming south from the Mediterranean, joining the flows from Northern India/Pakistan and that increasing the levels of PWAT over the Sahel.
And finally we have a map over the same period of rainfall in the Indian Subcontinent - which is arguably the main driver of all that we see here. This is the regular Indian Monsoon and these levels of rain and moisture are not unusual for this region. [@YeoKrishan]
We now return to the regular content.
I.E. Rainfall forecasts for #NorthAfrica #HornOfAfrica (Ethiopia & #GERD) and the #MiddleEast which today will include eyewitness images from the wonderful
@Arab_Storms extreme weather twitter account.
I.E. Rainfall forecasts for #NorthAfrica #HornOfAfrica (Ethiopia & #GERD) and the #MiddleEast which today will include eyewitness images from the wonderful
@Arab_Storms extreme weather twitter account.
Today's 10-Day Rainfall forecasts for North Africa from July 12th through July 23rd.
[Note that all four models are forecasting this upcoming Arabian Peninsula rainfall event.]
[Note that all four models are forecasting this upcoming Arabian Peninsula rainfall event.]

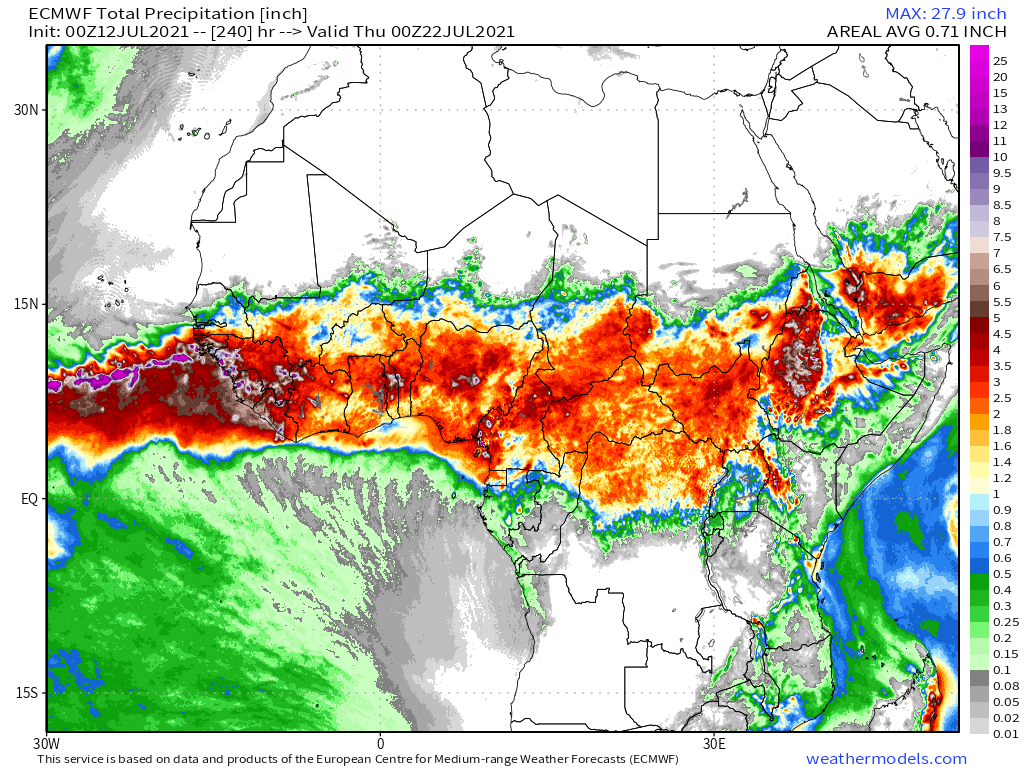
48-hour rainfall forecasts (today and tomorrow from the same four models: the Euro @ECMWF, U.S. @NOAA's GFS, Canada's CMC and the Korean KMA models.


And finally for #NorthAfrica we have the long-range 16-day (GFS) and 12-day (KMA) forecasts - which remain remarkably well aligned.
You will get a better view of the forecast rain over the southern Arabian Peninsula later in the bulletin.
You will get a better view of the forecast rain over the southern Arabian Peninsula later in the bulletin.

Here's a view of Yesterday (July 11, Saturday's) monsoon rising over the Horn of Africa.
And here is today's, which is notably stronger. It looks as if tonight might be particularly intense with all this cloud coming in from the North East over Yemen.
Today's July 12th 10-day rainfall forecasts for #Ethiopia (+1 12-day from KMA) and the #HornOfAfrica including #Somalia, #Somaliland, eastern parts of #SouthSudan, south eastern parts of Sudan, #Djbouti and #Eritrea.
The purple areas cover the #Abbay and #TekezeAtbara basins.
The purple areas cover the #Abbay and #TekezeAtbara basins.


48 Hour forecasts (today and tomorrow) from the same three models. Rains are now forecast in the west of #Somaliland


As an introduction to the #MiddleEast forecast section of the bulletin here is an image of ligtht rain well after dark (shown in blue from radar data by @zoom_earth) on Saturday night over #KSA #SaudiArabia.

@zoom_earth As previously mentioned @Arab_Storms is a great account to follow on account of its amazing curated collection of crazy real-time storm events from around the world. This one is less crazy, but from the relevant area, Saudi Arabia.
https://twitter.com/Arab_Storms/status/1414210221526843402?s=20
This one is from July 10th (Friday) in Saudi Arabia.
https://twitter.com/Arab_Storms/status/1413920006556078086?s=20
And here we see an Arabian tweet about the event which is about to unfold over the southern end of the Arabian Peninsula.
https://twitter.com/ArabiaWeatherSA/status/1413857487741128706?s=20
Oman consistently has the most amazing waterfall images. This one is also from Friday.
https://twitter.com/Arab_Storms/status/1413768600230371329?s=20
And this one sourced from @BBCNews is just amazing and caught my eye.
https://twitter.com/Arab_Storms/status/1413447328137039880?s=20
And finally some camels caught in the rain in Saudi Arabia.
https://twitter.com/Arab_Storms/status/1413216739329036294?s=20
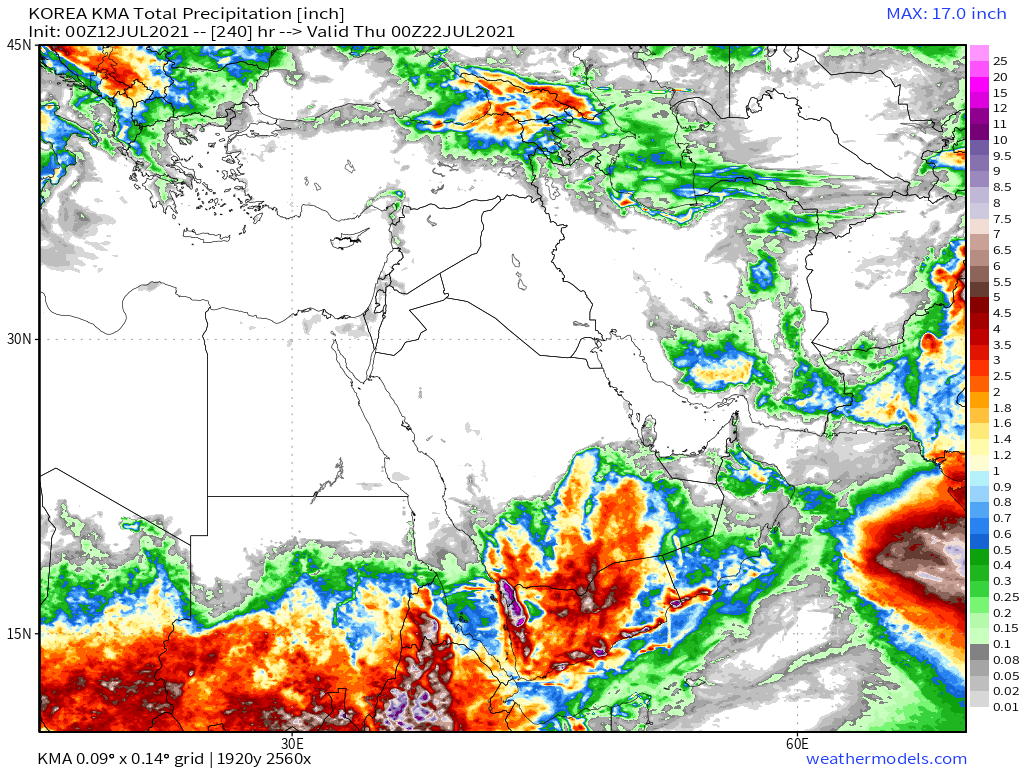
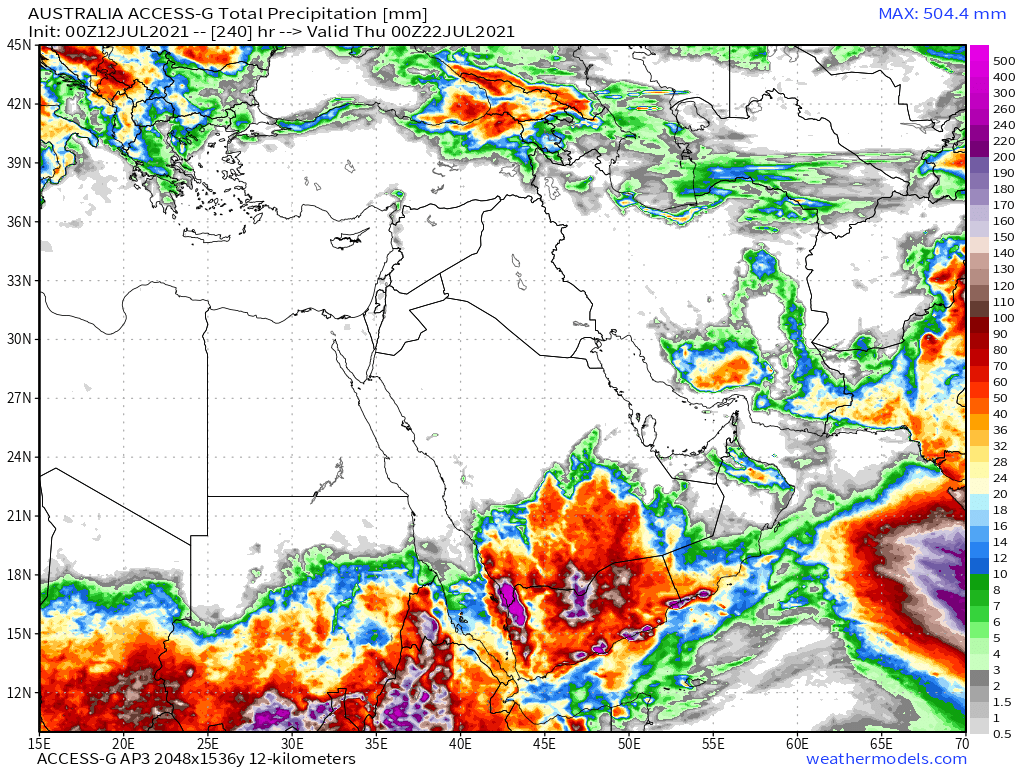
July 12th 10-Day accumulated rain forecasts for the #MiddleEast from the GFS, CMC, KMA & ACG weather models.
#ArabianStorms
#KSA #Yemen #Oman #Jordan #Sudan #Iran #Syria #GERD #Sudan #DesertRain #UAE
الله أعلم
#ArabianStorms
#KSA #Yemen #Oman #Jordan #Sudan #Iran #Syria #GERD #Sudan #DesertRain #UAE
الله أعلم

48 Hour July 12th (today and tomorrow), accumulated rain forecasts for the #MiddleEast from the ECM, CMC, KMA and ACG weather models.
#ArabianStorms
#KSA #Yemen #Oman #Jordan #Sudan #Iran #Syria #GERD #Sudan #DesertRain
الله أعلم
#ArabianStorms
#KSA #Yemen #Oman #Jordan #Sudan #Iran #Syria #GERD #Sudan #DesertRain
الله أعلم

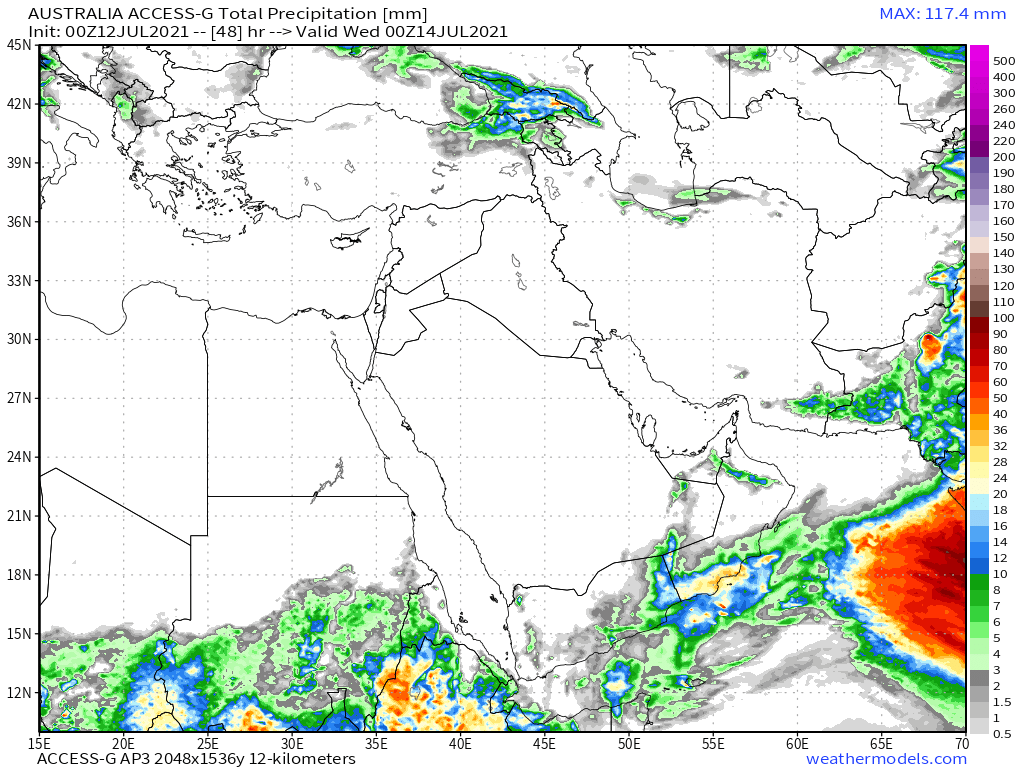

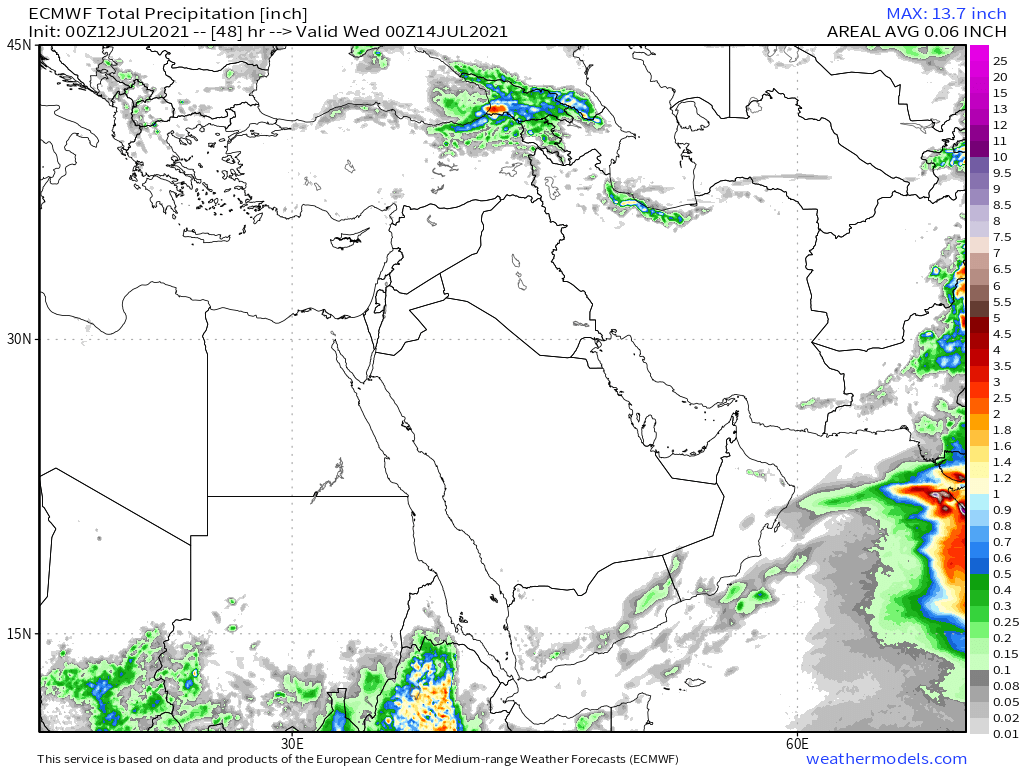
As you can see there is a bit of disagreement about when this rainfall event will begin. With the CMC thinking tomorrow. And the ECM being more cautious. As the GFS model runs were included in earlier tweets they have not been included here.
And finally we have today's long-range #MiddleEast July 10th rainfall forecasts.
The16-day GFS & GEFS models, the 12 day KMA and the 15 day EPS (Euro ensemble) model forecasts.
Note that UAE rainfall is back in the frame in all models.
الله أعلم
The16-day GFS & GEFS models, the 12 day KMA and the 15 day EPS (Euro ensemble) model forecasts.
Note that UAE rainfall is back in the frame in all models.
الله أعلم


To conclude here is today's North Western Hemisphere zero hour simulation data (i.e. now) from the GFS.
1. Precipitable water PWAT anomaly
2. PWAT (potential rain + energy)
3. MLSP (Mean Sea Level Pressure)
4. 250Hpa (jet stream winds approx 11kms high)
1. Precipitable water PWAT anomaly
2. PWAT (potential rain + energy)
3. MLSP (Mean Sea Level Pressure)
4. 250Hpa (jet stream winds approx 11kms high)


/ENDS
@Threadreaderapp unroll
@Threadreaderapp unroll
... threadfix ...
https://twitter.com/althecat/status/1414660798450962440?s=20
...threadfix ...
https://twitter.com/althecat/status/1414662412813410308?s=20
• • •
Missing some Tweet in this thread? You can try to
force a refresh


