In Dec 2018, we wrote why Jeff Gundlach was likely incorrect about 6% yields.
“Rates are at levels that historically led to some sort of event either economic, financial, or both, When that occurs, rates will go to 1.5% and closer to Zero.“
We got to 0.5% realinvestmentadvice.com/surge-in-bond-…
The surge in 2-year #bond#yields is unprecedented. Historically, such a surge in short-term yields coincides with either #recessions or #market events. With yields now 4-std deviations above its 52-week moving average, such has denoted peaks previously. realinvestmentadvice.com/surge-in-bond-…
The current surge in bond yields has taken the 10-year #bond to extreme oversold levels. The 10-year rate is now 4-std dev above its 52-week moving average. It is also approaching the top of the long-term downtrend channel from 1980. realinvestmentadvice.com/surge-in-bond-…
Notably, people don’t buy #houses or #cars. They buy #payments. Payments are a function of interest rates.
Higher #rates create “demand destruction.” Therefore, as rates increase the deflationary impact will quickly show in commodity prices. realinvestmentadvice.com/surge-in-bond-…
Recently, Paul Tudor Jones made headlines stating that the #debt and #deficits would lead the U.S. into #bankruptcy. As such, he would not own #Government #bonds. We look at the data to see if it supports his claims. realinvestmentadvice.com/resources/blog…
The chart below shows the long-term view of short and long-bond interest rates, inflation, and GDP.
Interest rates rose during three previous periods in history.
1-During the economic/inflationary spike in the early 1860s
2-The “Golden Age” from 1900-1929 saw inflation rise as economic growth resulted from the Industrial Revolution.
3-The most recent period was the prolonged manufacturing cycle in the 1950s and 1960s. That cycle followed the end of WWII when the U.S. was the global manufacturing epicenter.
-The current surge in #inflation, and ultimately interest #rates, was not a function of organic #economic growth. It was a stimulus-driven surge in the supply/demand equation following the pandemic-driven shutdown. realinvestmentadvice.com/resources/blog…
As those #monetary and #fiscal inflows from the #pandemic spending reverse, that support will fade. In the future, we must understand the factors that drive rates over time: #economic growth, #wages, and #inflation. Visually, we can create a composite index of GDP, wages, and inflation versus interest rates. realinvestmentadvice.com/resources/blog…
The #BullBearReport is out!
We have suggested a #rally was coming as #markets reached oversold levels. That #rally came with a vengeance following the #FOMC meeting. With #rate #hikes on pause, the #bulls bought everything from #stocks to #bonds. But will the rally last?
Given that the #Fed did little to talk up projections of further #rate hikes, the #market took this as meaning the Fed is likely done hiking rates.
The break of the 200-DMA was reversed on Thursday, and the 50-DMA was breached on Friday. Those actions set the market up for a rally into year-end.
The #BullBearReport is out!
Last week, we suggested a #market #rally was likely after the #correction to the 20-DMA. That rally took the market to a new 52-week. However, #complacency has become elevated. What is the $VIX telling us now? realinvestmentadvice.com/complacency-se…
With the #market back to more overbought levels, some #correction is needed to provide a better risk/reward entry point. Using Fibonacci retracement levels, investors should consider adding exposure at 4250 down to the 200-DMA.
https://t.co/mfrneEKHN5realinvestmentadvice.com/complacency-se…
#Investors have become very #bullish on the #market as #FOMO returns. #Volatility has dropped below average, #calloptions are surging, and #sentiment is rising.
https://t.co/4aTJrjYTQnrealinvestmentadvice.com/complacency-se…
So far, investors have mostly overlooked the rate shock impact on the real economy. However, the Fed’s aggressive rate hikes have collapsed the composite Economic Composite Index and the 6-month rate of change of the Leading Economic Index. realinvestmentadvice.com/the-2023-inves…
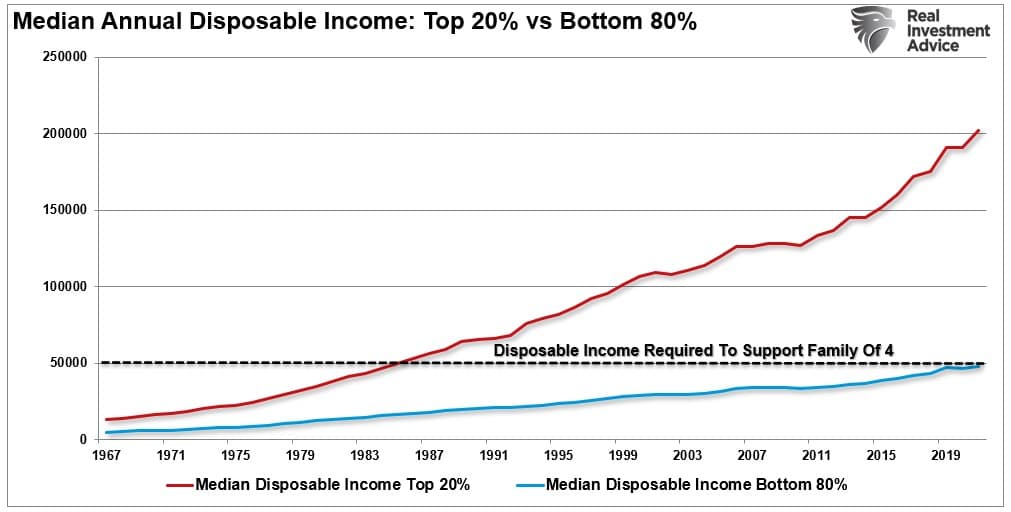
The shrinking of the middle class is accompanied by an increase in the share of adults in the upper-income tier from 14% in 1971 to 21% in 2021. At the same time, there was an increase in the share who are in the lower-income tier, from 25% to 29%. realinvestmentadvice.com/there-really-i…
Most importantly, and what is often not included in the analysis, is the standard of living gets “paid for” on an “after-tax” basis. When we include taxation, it becomes clear that roughly 80% of America is failing to support the “middle-class” lifestyle. realinvestmentadvice.com/there-really-i…