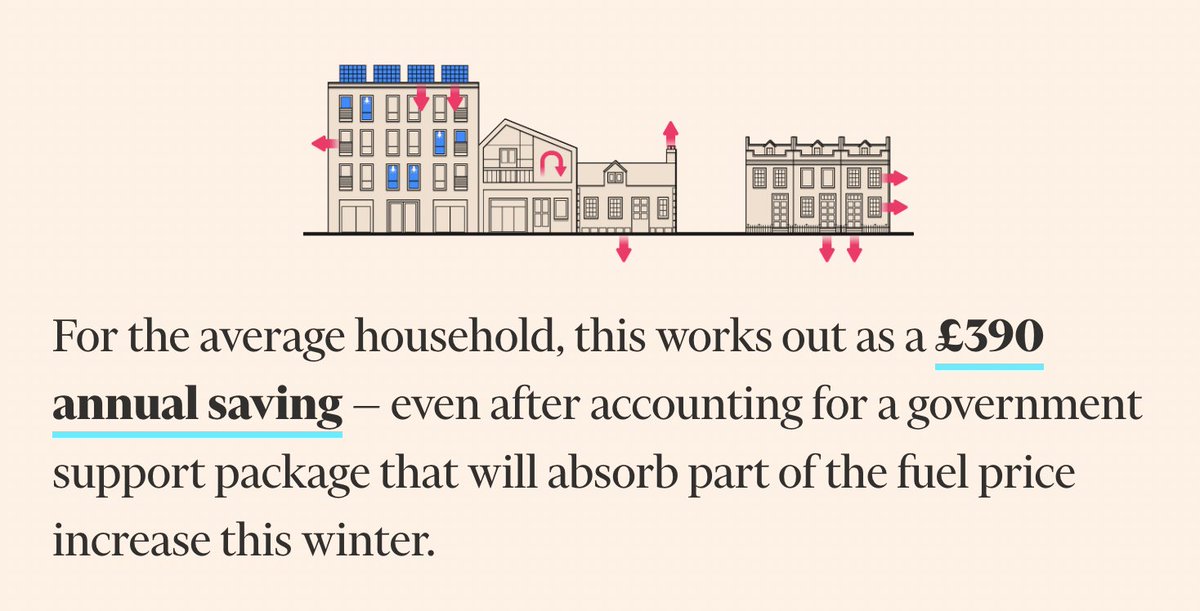
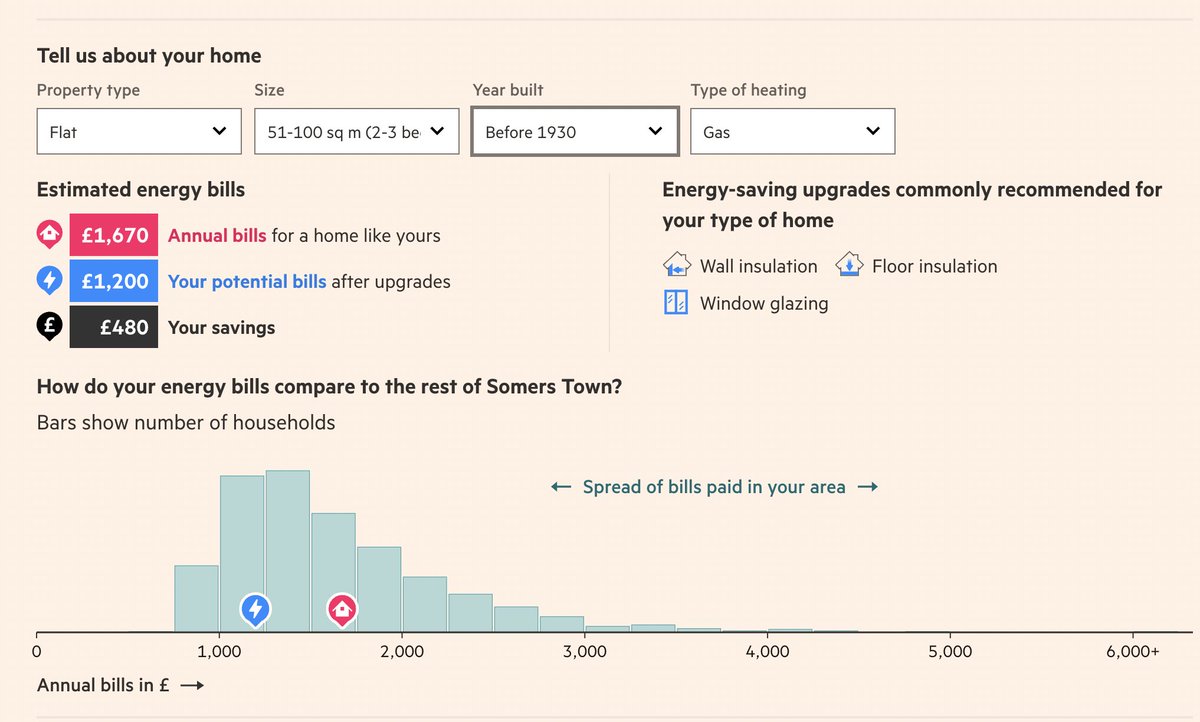
After 5 months of intense work the @FT published this piece that involved a ton of hands-on work. Check it out ➡️ ig.ft.com/uk-energy-effi…. It looks sleek but I do want to raise a few further points that I think could be discussed differently #EnergyCrisis#EnergyBills#energy
Point 1: We provided bill estimates under multiple price scenarios. Treating the #EnergyPriceGuarantee as the "price" I find problematic. The EPG implies a #EnergySubsidy benefitting mostly the well off that we all need to fund through #austerity and/or higher #taxation. So this
does not represent the full economic cost. It also ignores carbon prices which we all need should be MUCH higher. Using estimates based on the Oct 2022 Ofgem price cap ~ £3500 per year which is inline with predictions for most of 2023 (see forecasts from @CornwallInsight).
With the £3500 per yr (that is still 3 x more than 2021 prices) we are closer to 14bn. Now the estimates are obtained from 13.7 million properties, representing around 50% of building stock. Scaling back to population would yield savings closer to 20-28bn per yr.
We have done
a somewhat sophisticated reweighing. Our estimates may be conservative. Properties without EPC (not included in our data) at least based on @beisgovuk data have higher "treatment effects" of energy efficiency measures suggesting their starting energy efficiency level may be worse
Point 2: #CarbonPrices - we tentatively quantified the CO2 savings implicit in the energy savings that could be realized if properties were retrofitted. At current CO2 prices of around £75/ton this is an additional saving of up to £3bn/yr that as society, we should incorporate.
Many media outlets unfortunately do often resort to "accounting economics" or "spreadsheet economics". I do think there is a genuine problem & economists as a profession need to do much more to explain the concept of a counterfactual and externalities & their costs much better.
Point 3: Energy prices may go down again - I hope so, but hydrocarbon prices must remain high in order to ensure we stand a chance to avert the worst of #ClimateCrisis. The #RussianUkrainianWar essentially anticipates a much higher level of #CarbonTaxation that we should embrace.
Point 4: Distributional effects/heterogeneity. In the working paper (tinyurl.com/4dvft7es) we study the correlates of energy savings. Among others we show energy savings potential is higher in well-off areas & current policy weakens incentives to invest in #EnergyEfficiency.
The distributional patterns and differences were not discussed at all. Its a tricky one, because ultimately it requires strengthening incentives of better-off households to invest in retrofitting. This doesnt make for nice political optics but is the right thing to do...
In this paper tinyurl.com/3vfh2rxd I discussed a set of policy options that could be quite cheap and could work. There is a U-shape pattern as well with quite poor areas also having notable retrofit potential. We need to understand the barriers to adoption of such measures.
Point 5: Taking this all together, the average savings is likely MUCH higher than the quoted headline figure. Taking the full cost plus the CO2 savings we are talking about AVG savings of at least of £600 per year with huge heterogeneity. This is the unconditional avg!
To understand what works & what doesnt research & evidence-based policy making is vital. I discussed the broad research agenda around the EPG, retrofitting & the context in detail at a @NIESRorg event with @jagjit_chadha, @ben_moll & @AdrianPabst1 video
There is more in the works. The work and outputs will be available on trfetzer.com/energy-crisis-…. For geeks: the website at the @FT may not seem much. But behind the scenes there is a TON going on. The backend required creating nearly 1.4 million files.
It is great to learn how data journalists like @niko_tinius@ejhollowood@jburnmurdoch@samjoiner work. Academics working together with data journalists may be really important going forward. Data and evidence can help cut through the noise. Onwards and upwards
• • •
Missing some Tweet in this thread? You can try to
force a refresh
So, @Jeremy_Hunt now did a full and welcome u-turn on the #minibudget2022. And they are starting to tackle another policy that needs fixing, the #EnergyPriceguarantee#EPG. Why should this happen? This is a story that can ultimately be summarised in these two pictures.... 1/..
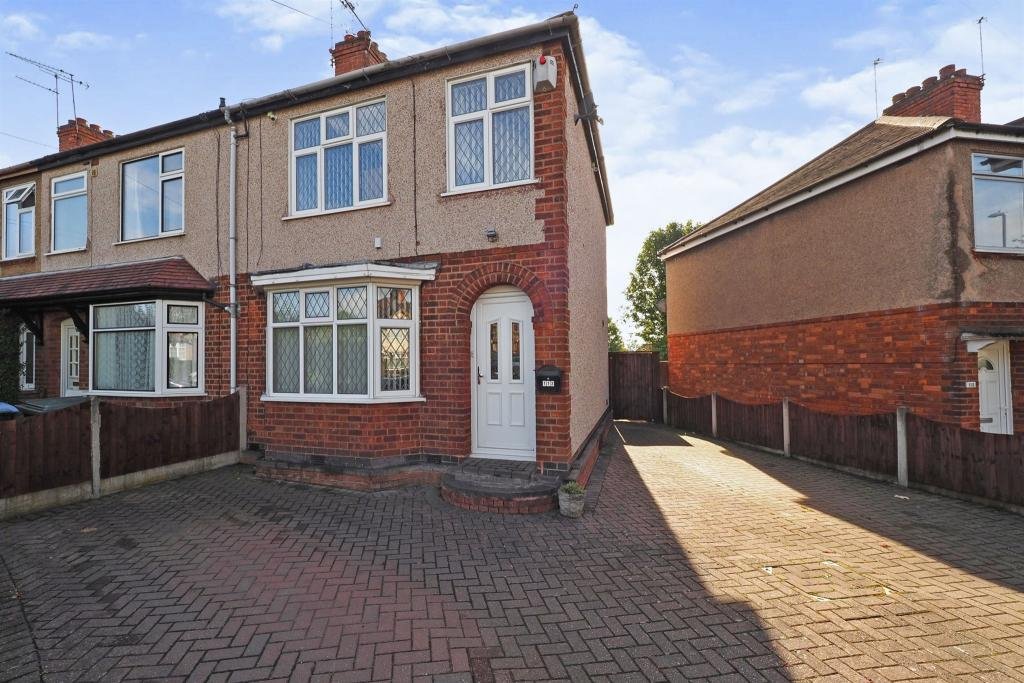
On the left, we have a classic end-terrace house. On the right, well, you have a mansion. The big difference: energy consumption. The left needs around 15,000 kWh per year, the right one, at least 70,000 kWh. How does this compare to the average UK household? Well: 2/..
The graph highlights one thing: energy consumption is strongly increasing in household income. But even in the highest income group there is huge variation. 50% of households even in top income group consume less than half as much energy than the top 5% in this group. 3/..
I start sounding like a broken record. The issue of UK is not primarily due to a high level of taxation but due to poor use of public money & the poor quality public goods bought in return. I have documented this across numerous pieces of careful research... here is a short 🧵⬇️
Exhibit 1: Most of austerity was a drag on growth. In "Did #Austerity Cause #Brexit?" I show that austerity itself was contractionary and the tax that could have been collected on higher incomes without austerity would have easily saved as much as austerity was projected to save.
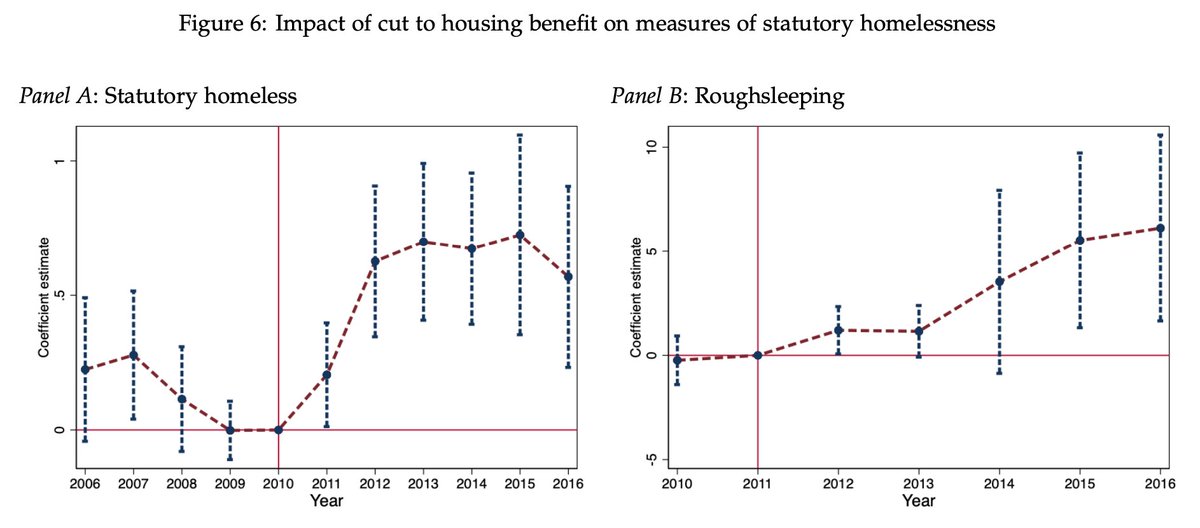
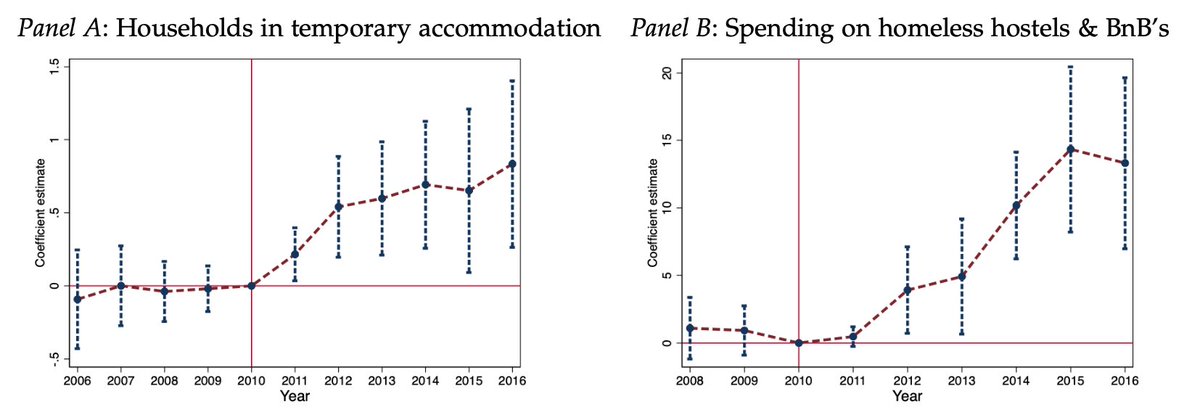
Exhibit 2: Housing benefit cuts (FYI: these benefits are only so expensive as the UK's economic model is build on housing shortage)... but there weren't much savings as councils had to deal with the fallout: higher homeless prevention spending and putting up people in privately
Does #COVID19 crowd out care for non COVID patients in the #NHS? Has this led to a loss of lives? Are the numbers negligible? The short answers are: yes, yes & no!
Paper ➡️ bit.ly/33XMyHB & a long🧵on how we capture non COVID19 excess deaths & much more ⬇️ 1/n
Lets start with a headline result: we estimate that for every 30 #COVID deaths there is at least one avoidable non COVID excess death in 🏴 hospitals. To arrive at this we use cool #NHS data which makes for a great #EconTwitter#econometrics#DataScience teaching example. 2/n
The #NHS has population individual level hospital episode data (HES) linked to death certificates. For each admitted patient, they predict P(Death|X). This is an out-of-sample prediction coming from Lasso logistic regression model trained on data from the last 3 years. 3/n
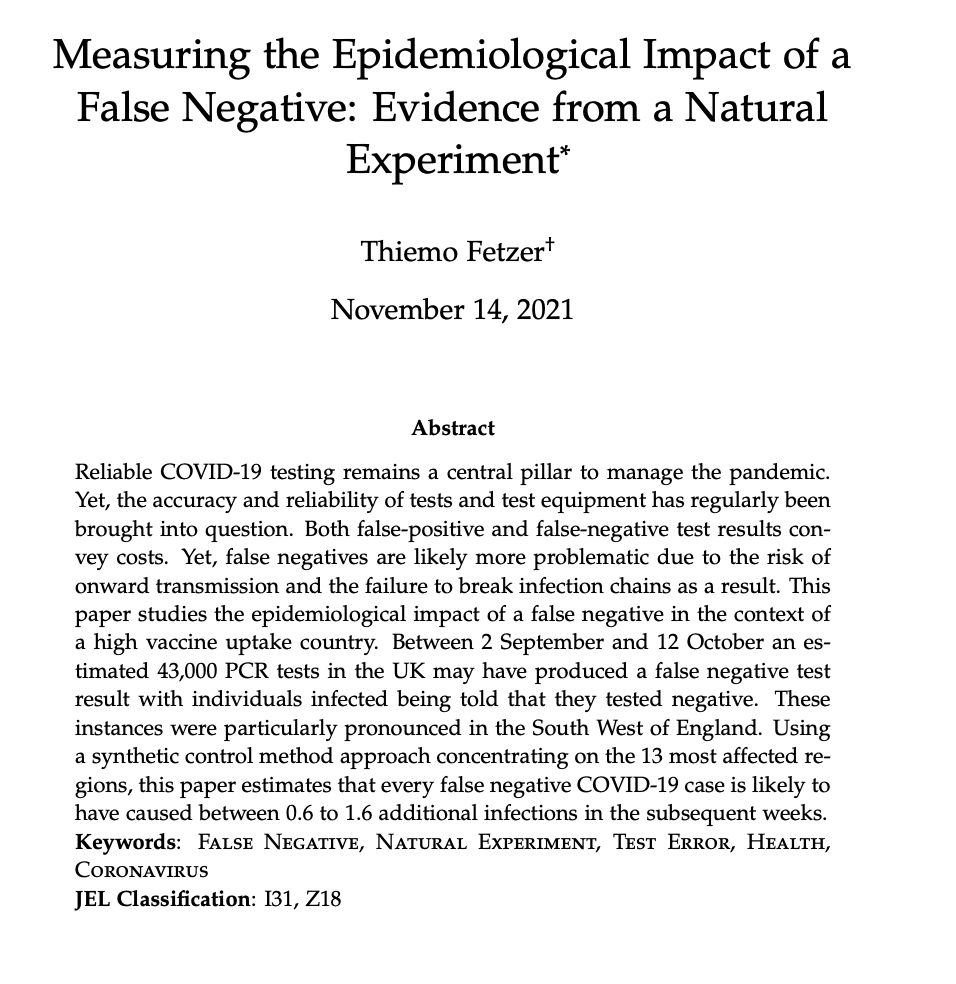
What is the epidemiological impact of a #falsenegative#COVID test? An important question in a high vaxx/low NPI context, but one that cannot be studied in a experiment for obvious reasons. Enter the UK, a reliable supplier of #naturalexperiments. 🧵⬇️
➡️bit.ly/3DhqQv5
On Oct 15, @UKHSA suspended an #Immensa lab, because of community reports of neg PCR tests following a pos lateral flow. There was loads of excellent reporting e.g. by @rowenamason@tomjs@JamieGrierson. NHS TT estimates that 43,000 individuals may have been given a .. 2/N
false negative result most concentrated in South West of England. Even across all of England, a notable increase in both absolute # and relative % of PCR tests matched to a positive LFD tests producing a negative result from early Sept to early Oct 3/N
Today is the 5th year anniversary of the 2016 EU referendum vote in which the UK had narrowly voted to #Leave the European Union. Unlike Trump, the impact is permanent and already caused notable damage. Here is a 🧵 of 🧵 with some past work and deliberations on #Brexit... 1/...
In one of the first papers we asked "Who voted for #Brexit?". The paper is a systematic correlational analysis of what is common to #Leave support across districts and within cities & we also show that a #Brexit model can predict LePen voting. Link: goo.gl/VzBo57 2/
Similarly, we augment the analysis using individual level data. This helps tackle whether correlational district level evidence is due to ecological fallacy. Open access at @ejprjournalgoo.gl/sPzzwf 3/
So I am going to report on some lack of progress about a #FOIA request we launched to @PHE_uk last Nov to make data available on the #Excel error that resulted in 15k #COVID19 cases to not be contact traced in a timely fashion (whatdotheyknow.com/request/region…). The response so far is ...
quite underwhelming. In the paper we reverse engineer the geographic distribution of the missing cases which is far from perfect. We find that places with higher exposure to the contact tracing error saw a notable differential increase in infections and subsequent deaths.
Naturally we would much rather prefer to work with the actual data as the measurement will be more precise. And further, it would allow for a direct measurement of infections among contacts of individuals that were traced with a delay. But @PHE_uk do not consider this is of