Chris Profile picture
Feb 3 15 tweets 10 min read
As of Jan 21, an estimated 7547 Canadian children have lost a primary or secondary caregiver to Covid-19.
24% of those have been since protections were removed in individual provinces.

Individual provincial impacts are in this thread.
🧵
#canpoli #cdnpoli Infographic portraying the figure of a child holding the han
As of Jan 28, an estimated 117 NB children have lost a primary or secondary caregiver to Covid-19.
57% of those have been since protections were removed.
#NewBrunswick #nbpoli Infographic portraying the figure of a child holding the han
As of Jan 21, an estimated 107 NS children have lost a primary or secondary caregiver to Covid-19.
68% of those have been since protections were removed.
#NovaScotia #nspoli Infographic portraying the figure of a child holding the han
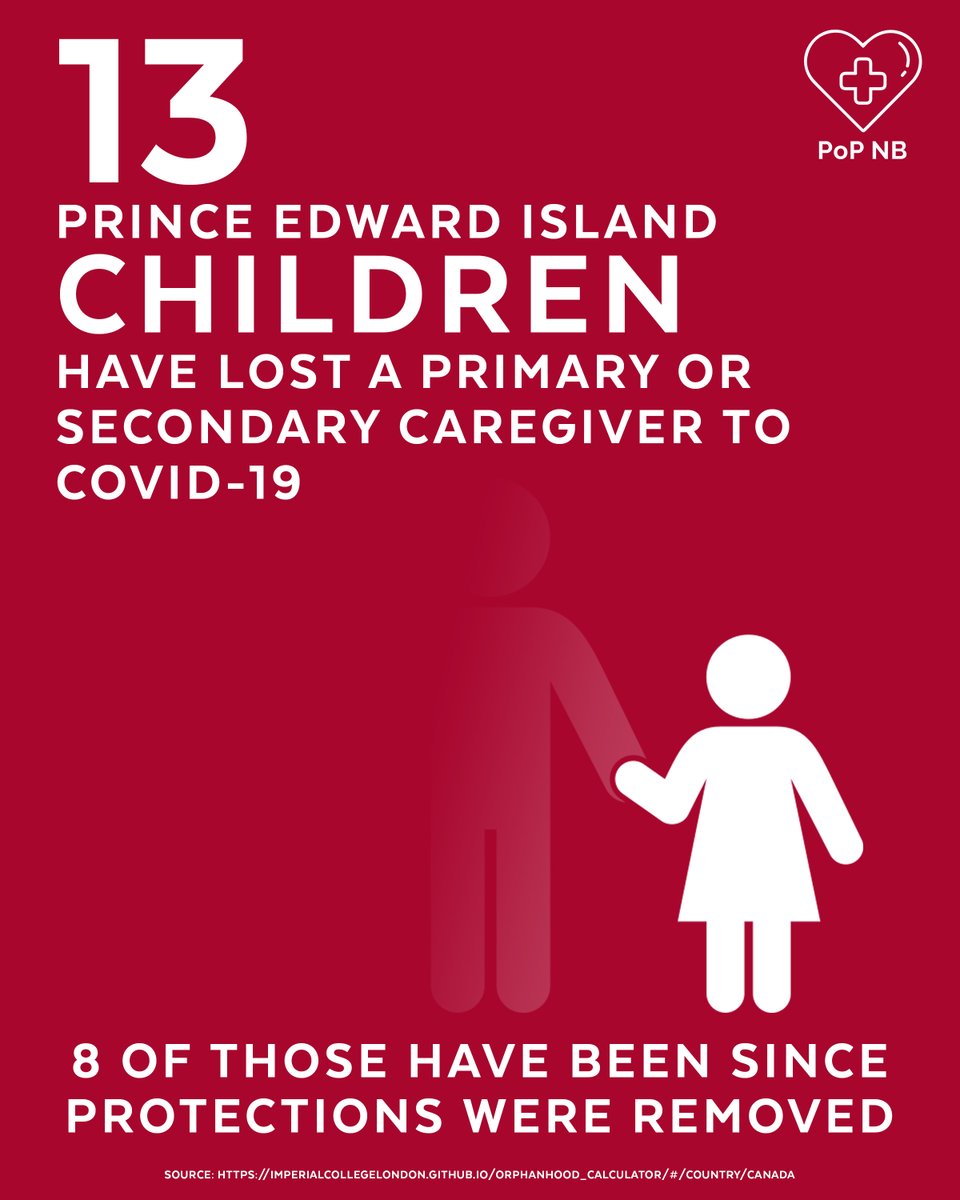
As of Jan 21, an estimated 13 PEI children have lost a primary or secondary caregiver to Covid-19.
66% of those have been since protections were removed.
#peipoli Infographic portraying the figure of a child holding the han
As of Jan 21, an estimated 44 NL children have lost a primary or secondary caregiver to Covid-19.
73% of those have been since protections were removed.
#newfoundland #nlpoli Infographic portraying the figure of a child holding the han
As of Jan 21, an estimated 2668 QC children have lost a primary or secondary caregiver to Covid-19.
12% of those have been since protections were removed.
#Quebec #quebecpoli Infographic portraying the figure of a child holding the han
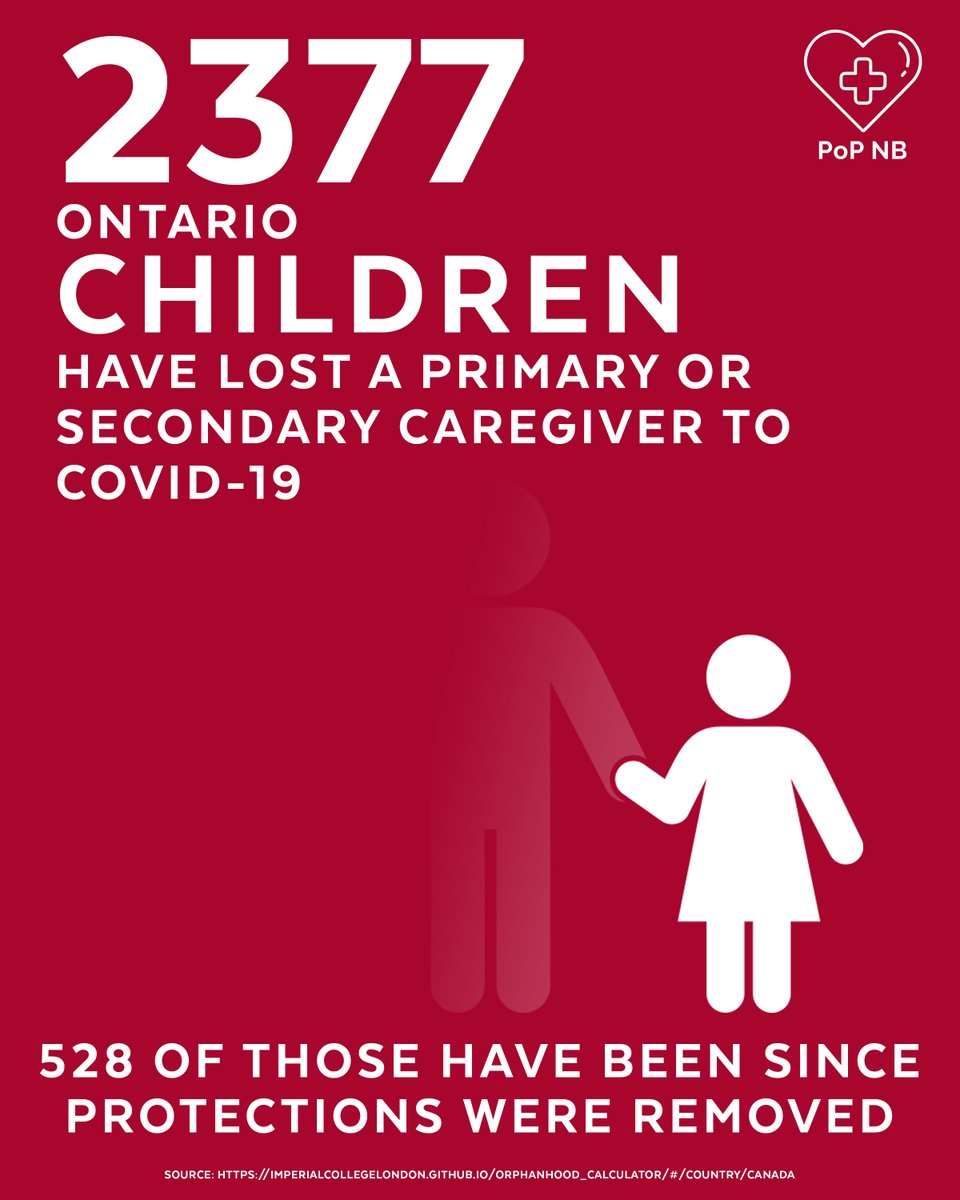
As of Jan 21, an estimated 2377 ON children have lost a primary or secondary caregiver to Covid-19.
22% of those have been since protections were removed.
#Ontario #onpoli Infographic portraying the figure of a child holding the han
As of Jan 21, an estimated 362 MB children have lost a primary or secondary caregiver to Covid-19.
29% of those have been since protections were removed.
#Manitoba #mbpoli Infographic portraying the figure of a child holding the han
As of Jan 21, an estimated 273 SK children have lost a primary or secondary caregiver to Covid-19.
38% of those have been since protections were removed.
#Saskatchewan #skpoli Infographic portraying the figure of a child holding the han
As of Jan 21, an estimated 818 AB children have lost a primary or secondary caregiver to Covid-19.
28% of those have been since protections were removed.
#Alberta #abpoli Infographic portraying the figure of a child holding the han
As of Jan 21, an estimated 758 BC children have lost a primary or secondary caregiver to Covid-19.
42% of those have been since protections were removed.
#BritishColumbia #bcpol Infographic portraying the figure of a child holding the han
As of Jan 21, an estimated 5 YT children have lost a primary or secondary caregiver to Covid-19.
20% of those have been since protections were removed.
#ytpoli Infographic portraying the figure of a child holding the han
As of Jan 21, an estimated 3 NT children have lost a primary or secondary caregiver to Covid-19.
#ntpoli Infographic portraying the figure of a child holding the han
Not leaving NU out of this list.
They have reported 7 deaths as of Jan 21, which would proportionally equate to an estimated 1 NU child losing a primary or secondary caregiver to Covid-19.
#nupoli

• • •

Missing some Tweet in this thread? You can try to force a refresh
 

Keep Current with Chris

Chris Profile picture

Stay in touch and get notified when new unrolls are available from this author!

Read all threads

This Thread may be Removed Anytime!

PDF

Twitter may remove this content at anytime! Save it as PDF for later use!

Try unrolling a thread yourself!

how to unroll video
  1. Follow @ThreadReaderApp to mention us!

  2. From a Twitter thread mention us with a keyword "unroll"
@threadreaderapp unroll

Practice here first or read more on our help page!

More from @HallwayOrchard

Dec 21, 2022
Public Health's revised Covid Watch report is less clear than any of their previous pandemic reporting.
Naturally, there are questions regarding the reason and timing of this change.
🧵
In particular, age specific hospitalization data has been combined into new cohorts, with the weekly number hospitalized removed from the report.

Instead we now have a quantity of people who have been hospitalized since Aug 28; a number which is meaningless without prior values.
I can only think of one reason why reported metrics would be limited to the 16 week period of August 28 to present... the numbers are smaller.
This new date range seems arbitrary otherwise.
Read 12 tweets
Dec 20, 2022
Today's GNB report sheds some light on last week's death revision.
I am inferring (emphasis here since we lack explanatory material) the 86 revised deaths were not in addition to previous "weekly" deaths.

The truth is we have not known *any* weekly death numbers since September.
Looking at the chart in the revised death count report, we see that 82 deaths have been "newly confirmed" in the period between Sep 3 and Dec 4 (news release said 86).

We assumed these 82 were in *addition* to the 64 deaths in weekly reports over those 12 weeks.
Looking at the same chart in today's report, we see that the 7 new deaths did not occur between December 11 - 17 (the reporting period), but between September 18 and December 4.

The "previously confirmed deaths" below match the revision chart from Friday.
Read 6 tweets
Dec 17, 2022
GNB yesterday: "47 people have died from Covid-19 between September 3 and November 29; about 5 per week."

GNB today: "Actually, it's about three times that many... about 15 per week."

Retroactive truth silently released on a weekend without any notification is still deception.
Without any explanatory material, GNB released an updated Covid-19 death count. The report contains a title page and one nearly illegible chart.
www2.gnb.ca/content/dam/gn…
They've added a 7DA trend line for the error, which one supposes is meant to imply declining death? Baffling.
We now know two people die every day from Covid-19 in New Brunswick.

This is twice the mortality rate which lead to our strongest mandated protections one year ago. An infographic comparing New Brunswick Covid-19 metrics of D
Read 4 tweets
Dec 15, 2022
We'll soon be in the position of having to accept or deny invitations to gather. Our replies and our concerns may be met in different ways. While the risks will vary, the science they are based on is consistent.
May this summary help.
🧵 #COVIDisAirborne
(reposting w/ ALT text) Title slide with red backgr...
How is Covid-19 spread? #COVIDisAirborne HOW IS COVID-19 SPREAD? COV...
The air we breathe #COVIDisAirborne THE AIR WE BREATHE Exhaled ...
Read 10 tweets
Dec 15, 2022
We'll soon be in the position of having to accept or deny invitations to gather. Our replies and our concerns may be met in different ways. While the risks will vary, the science they are based on is consistent.
May this summary help.
🧵 #COVIDisVascular
(reposting w/ alt text) Title slide with red backgr...
Vascular impacts #COVIDisVascular VASCULAR IMPACTS: Vascular ...
Hospitalization and ICU #COVIDisVascular HOSPITALIZATION AND ICU: Pe...
Read 10 tweets

Did Thread Reader help you today?

Support us! We are indie developers!


This site is made by just two indie developers on a laptop doing marketing, support and development! Read more about the story.

Become a Premium Member ($3/month or $30/year) and get exclusive features!

Become Premium

Don't want to be a Premium member but still want to support us?

Make a small donation by buying us coffee ($5) or help with server cost ($10)

Donate via Paypal

Or Donate anonymously using crypto!

Ethereum

0xfe58350B80634f60Fa6Dc149a72b4DFbc17D341E copy

Bitcoin

3ATGMxNzCUFzxpMCHL5sWSt4DVtS8UqXpi copy

Thank you for your support!

Follow Us on Twitter!

:(