(1/10) In today's thread, we ask whether US stock market breadth is washed out enough to consider buying in due course?
The answer depends on your timeframe and investment perspective. Are you a trader looking for a rally, or an investor looking for a multi-year bottom? $SPY
The answer depends on your timeframe and investment perspective. Are you a trader looking for a rally, or an investor looking for a multi-year bottom? $SPY
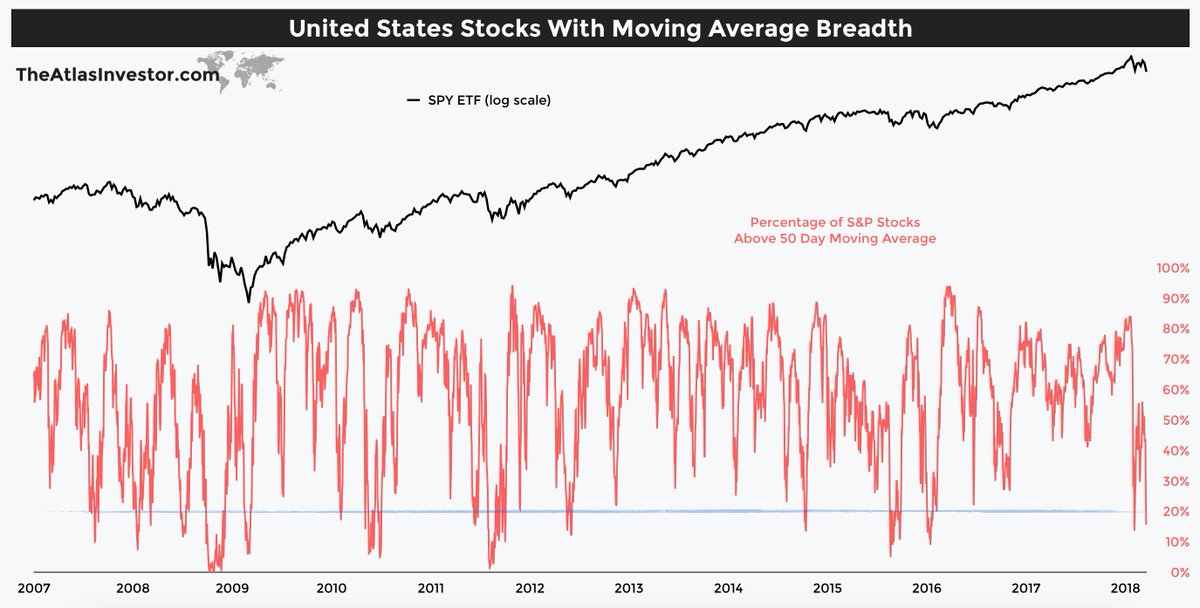
(2/10) Percentage of $SPY stocks trading above...
5 Day MA: 5.8%
10 Day MA: 6.2%
20 Day MA: 9.4%
50 Day MA: 13.9%
Short term breadth readings clearly show panic selling and oversold conditions, which usually — but not always — indicate a bounce is coming.
5 Day MA: 5.8%
10 Day MA: 6.2%
20 Day MA: 9.4%
50 Day MA: 13.9%
Short term breadth readings clearly show panic selling and oversold conditions, which usually — but not always — indicate a bounce is coming.
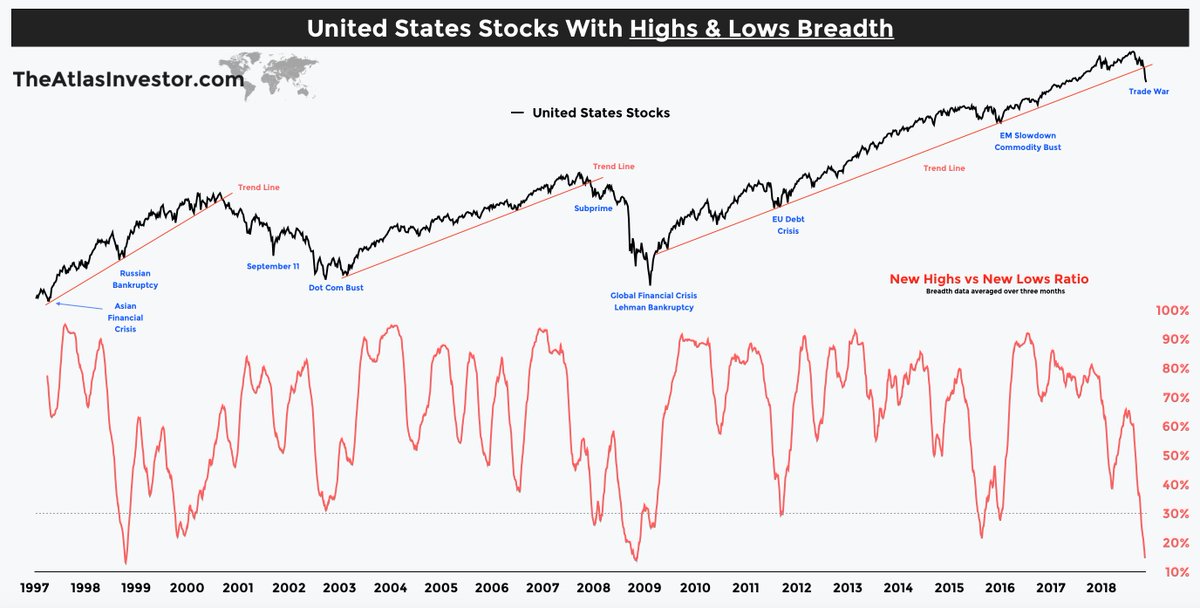
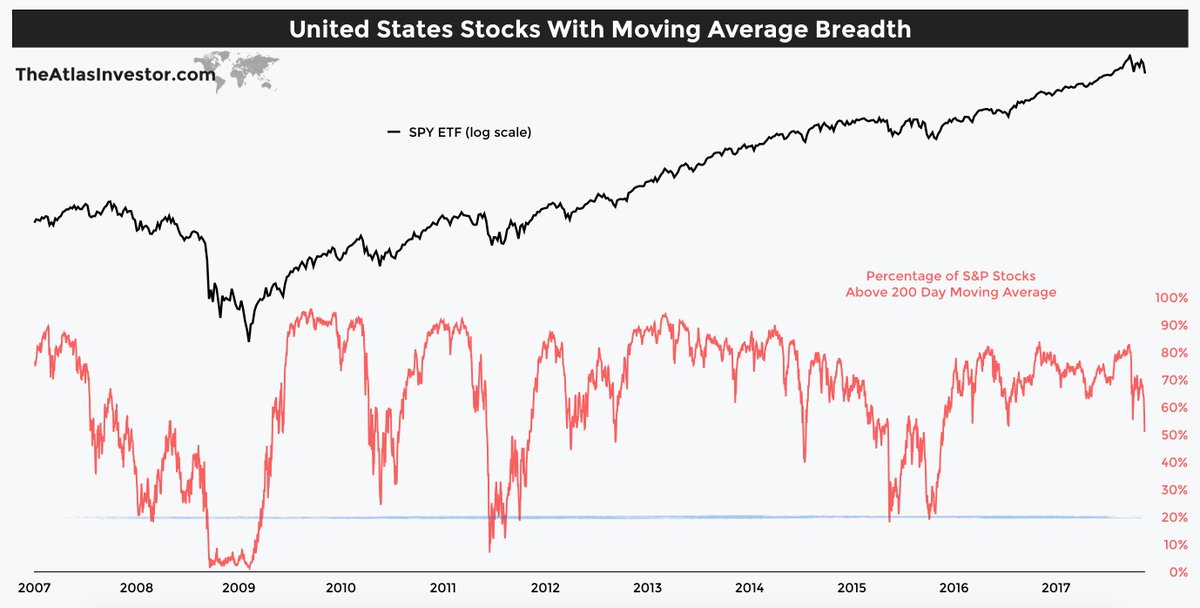
(3/10) However, when we look at breadth readings from the long-term and frankly speaking, more important time frame... the US stock market is nowhere near oversold.
Percentage of $SPY components above the 200 day MA: 51%.
Major lows tend to occur as the reading drops below 20%.
Percentage of $SPY components above the 200 day MA: 51%.
Major lows tend to occur as the reading drops below 20%.
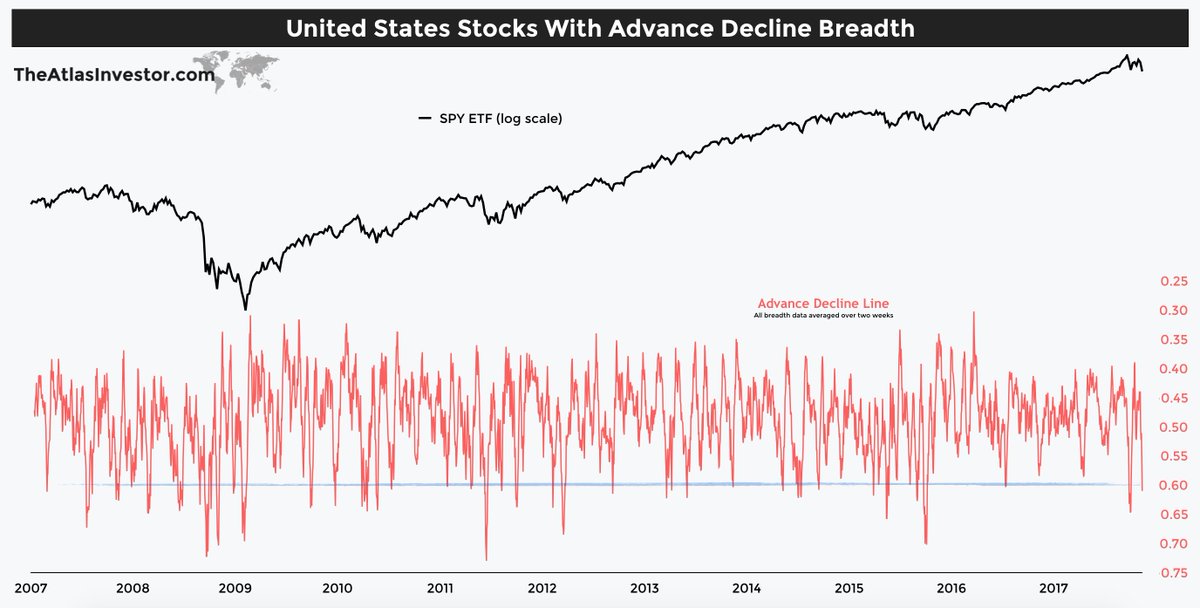
(4/10) What about the Advance-Decline readings, and Up vs Down volume?
Once again a similar story here. When we average the AD Line and UP Volume over 10 trading days (two-week average), we can clearly see oversold readings suggesting a potential bounce ahead. $SPY
Once again a similar story here. When we average the AD Line and UP Volume over 10 trading days (two-week average), we can clearly see oversold readings suggesting a potential bounce ahead. $SPY
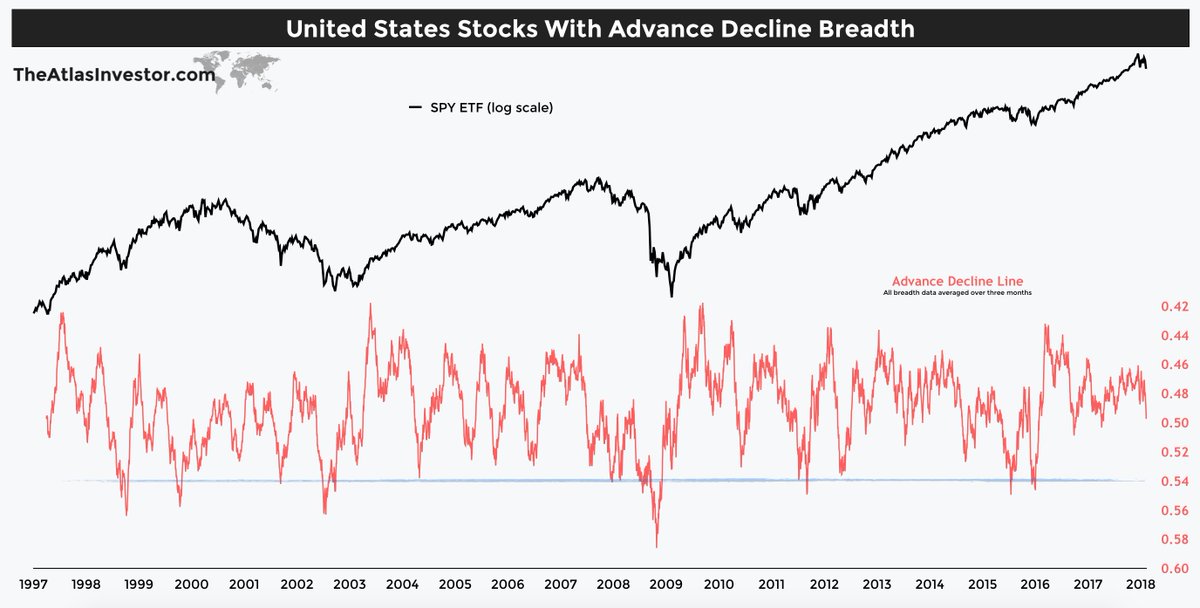
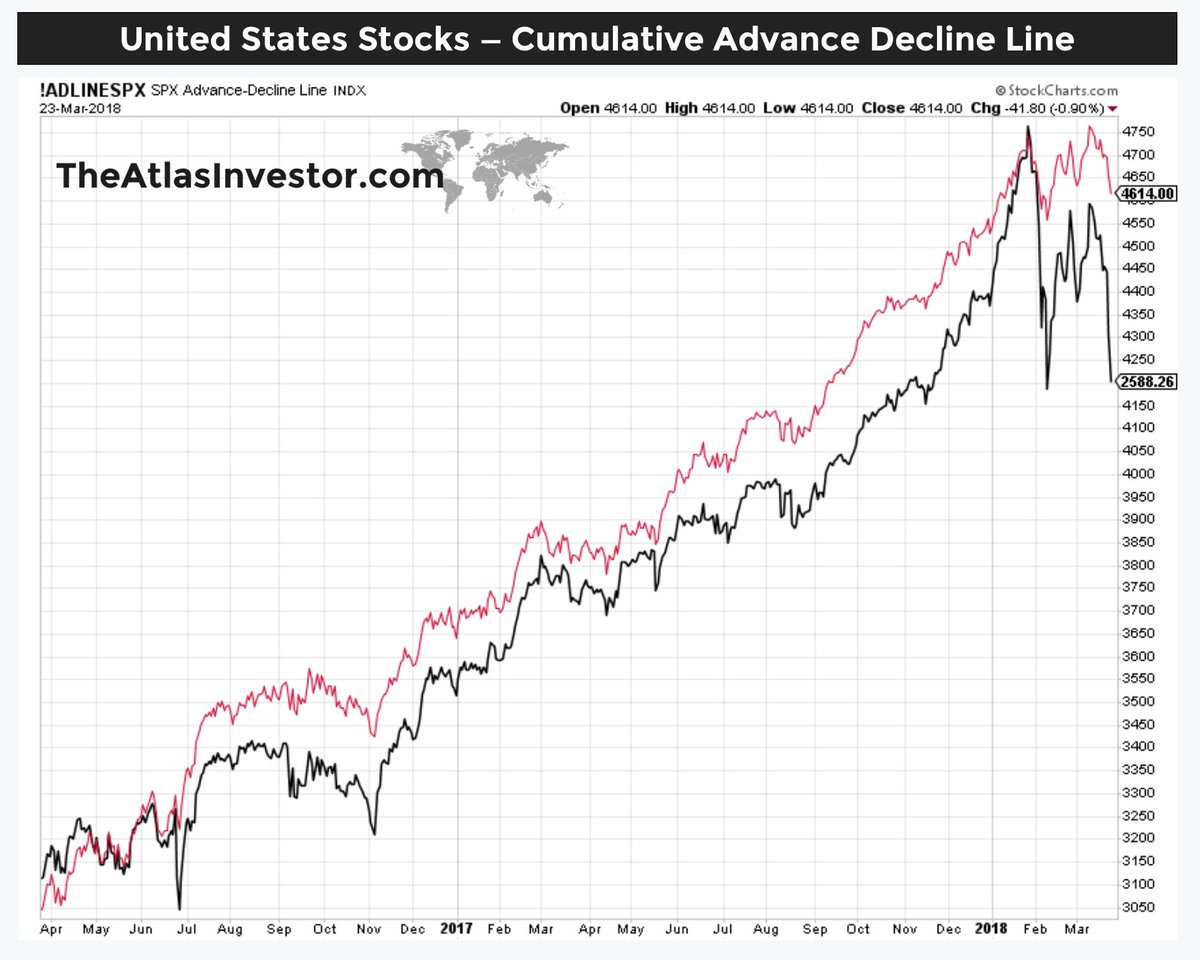
(5/10) What about the longer term perspective of the Advance-Decline and Up vs Down volume?
Just like when it comes to the percentage of stocks above MAs, this breadth indicator also signals that conditions are nowhere near oversold.
Just like when it comes to the percentage of stocks above MAs, this breadth indicator also signals that conditions are nowhere near oversold.
(6/10) By now you can clearly see that you cannot trust perma-bulls or perma-bears. Both frame data to suit their point of view.
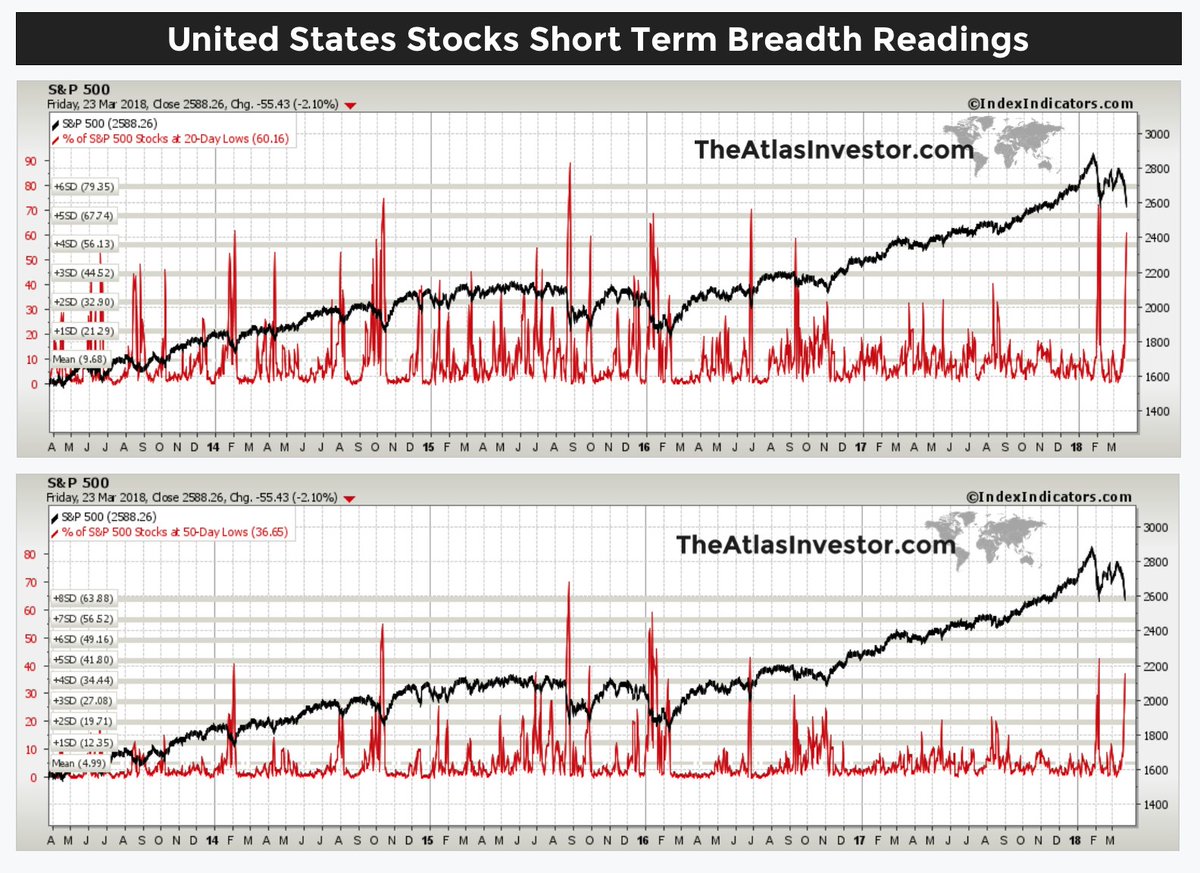
What about the New Highs and New Lows? Is this indicator oversold? Percentage of $SPY stocks at 20-day lows @ 60% & 50-day lows @ 37%.
Very oversold.
What about the New Highs and New Lows? Is this indicator oversold? Percentage of $SPY stocks at 20-day lows @ 60% & 50-day lows @ 37%.
Very oversold.
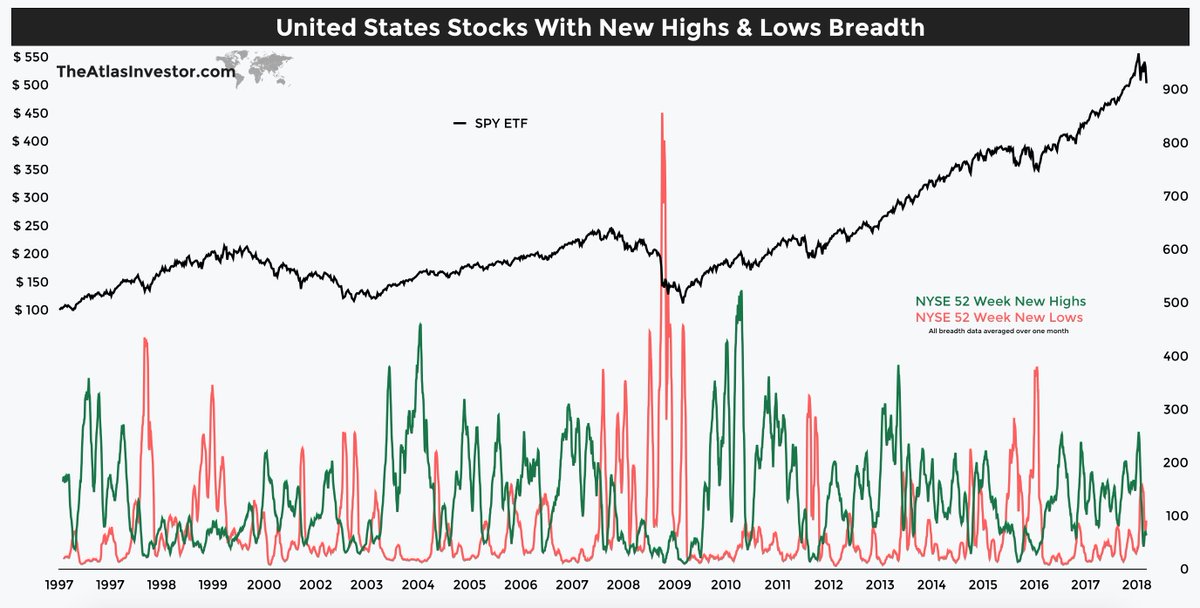
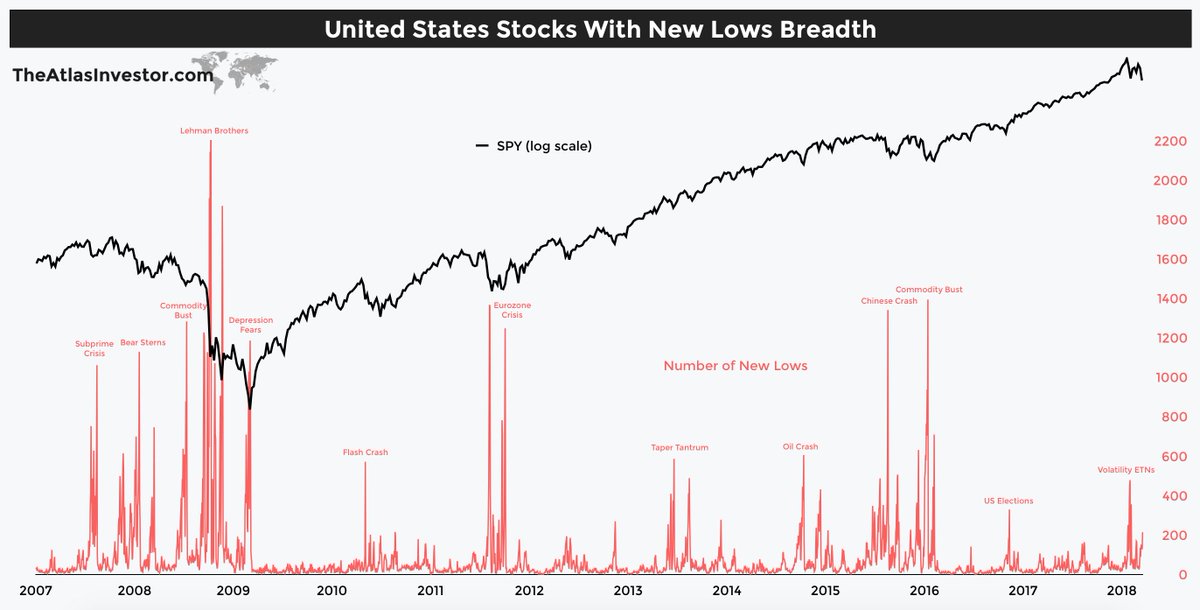
(7/10) However, when we observe the number of 52 week new lows for the $SPY or even better the whole NYSE — we can observe the recent spike in new lows is nowhere near the magnitude of previous major panics.
What were major panics? 1998, 2001, 2002/03, 2008/09, 2011, 2015/16.
What were major panics? 1998, 2001, 2002/03, 2008/09, 2011, 2015/16.
(8/10) Framing data to suit view isn't wise. This is common among unprofitable investors, who have a "big social media following" for churching a large amount of content.
They are good at charging for newsletter subscriptions, but not so good at profiting with "real money".
They are good at charging for newsletter subscriptions, but not so good at profiting with "real money".
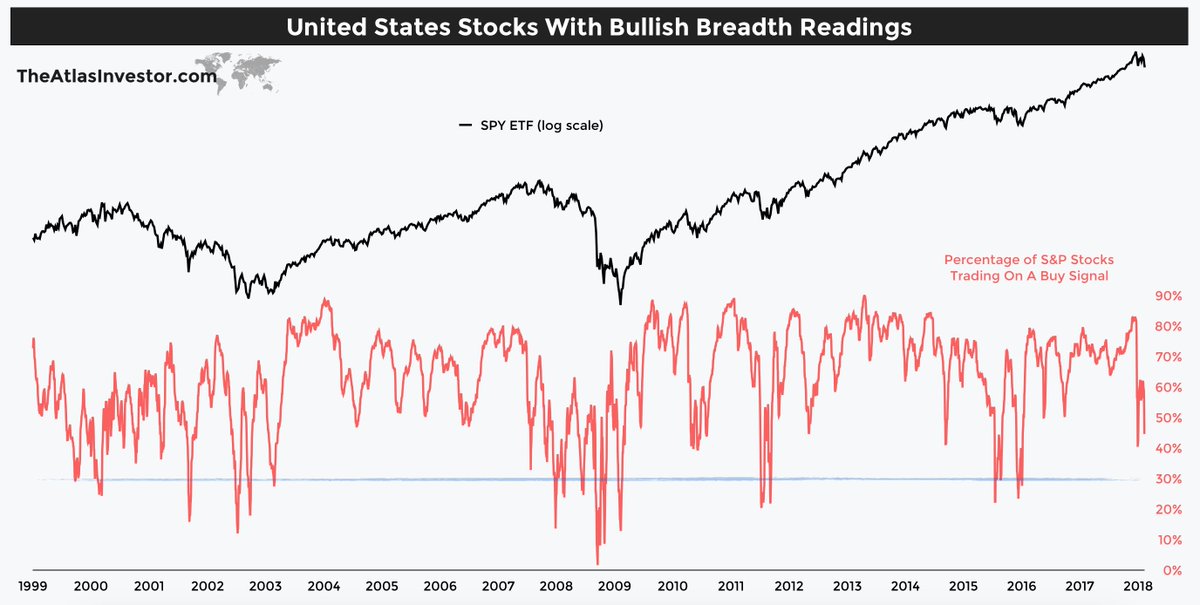
(9/10) Percentage of $SPY stocks trading on a buy signal also dropped sharply in recent months.
Historically, readings below 30% have marked significant lows. We are not there yet. Here is the thing. Do we have to get that oversold?
Not at all. Markets do not have rules.
Historically, readings below 30% have marked significant lows. We are not there yet. Here is the thing. Do we have to get that oversold?
Not at all. Markets do not have rules.
(10/10) Outperforming markets is not an easy job.
You need someone accomplished level of expertise, who invests millions & millions of dollars on behalf of his clients. Someone who does this as a full-time job, with a solid track record.
theatlasinvestor.com/track-record
You need someone accomplished level of expertise, who invests millions & millions of dollars on behalf of his clients. Someone who does this as a full-time job, with a solid track record.
theatlasinvestor.com/track-record